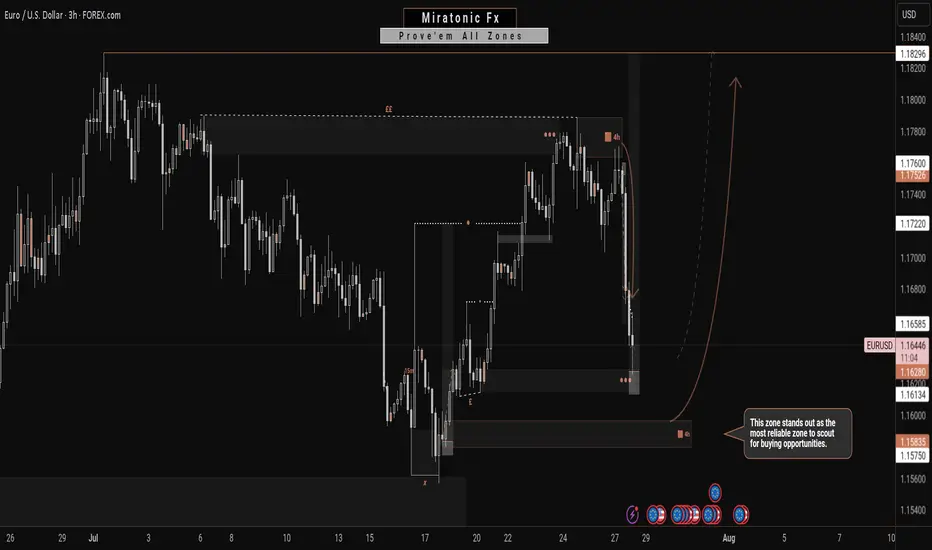
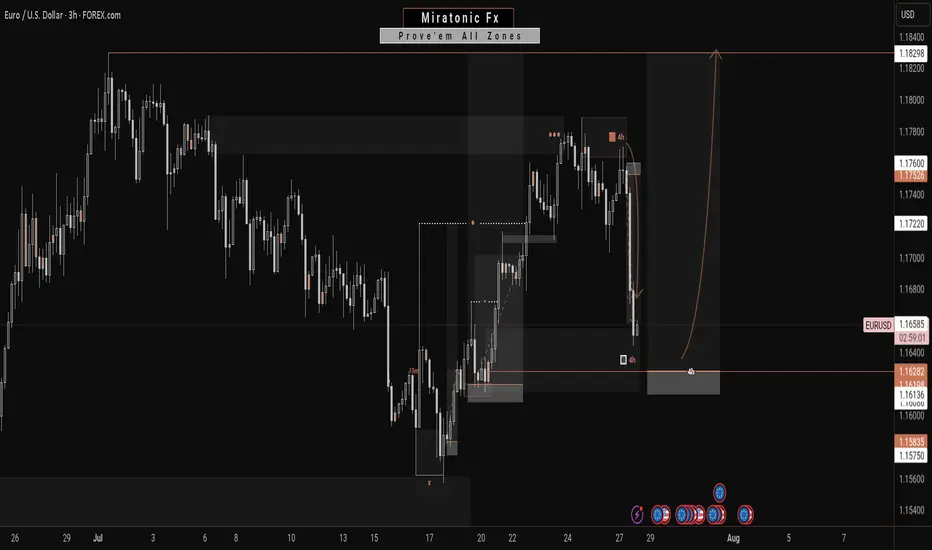
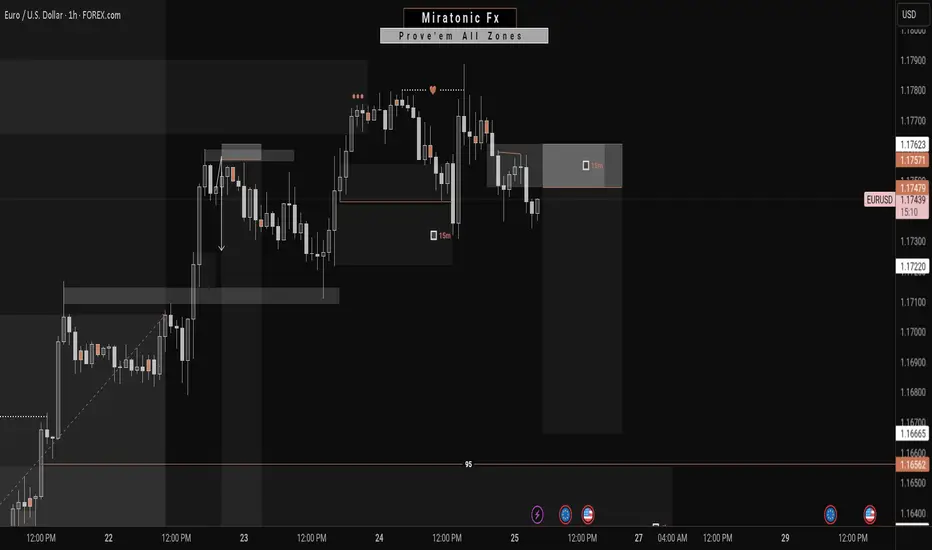
Potentially, A Safer Way To Long The EURUSDIn contrast to my previous outlook, the current price action suggests an increased probability of a deeper bearish move—potentially invalidating the buy zone marked out in the previous analysis. This sudden change is largely driven by the prospect of untapped liquidity residing beneath that zone, reinforcing the well-known market principle that price seeks out liquidity before committing to directional moves.
Given this development, the newly identified zone on the chart emerges as a more technically sound and reliable area from which to anticipate bullish interest. It aligns better with the broader liquidity profile and offers a stronger base for accumulation. Traders may opt to wait for confirmations within this zone or, depending on their risk appetite, consider executing buy positions upon price entry.
As always, patience and clarity are key as we allow price to reveal its intention.
Fingers crossed 🤞
Wishing you all a focused and profitable trading week.
Catch you on the next one. 🫡
EUR (Euro)
EURUSD - Monday analysis - Tarifs EUR/USD Analysis – Market Response to US–EU Tariff Agreement
Following the agreement between the United States and the European Union to implement 15% tariffs, the DXY is strengthening, which is triggering a sharp decline on EUR/USD.
I’m focusing on a potential pullback to rejoin the move or the formation of a new structure.
Given that such strong moves often lack long-term sustainability, I’ll be watching the 1.16654 level closely — looking for a possible structure break and the beginning of a corrective phase.
Trade management will be based on the evolving price action throughout the session.
🔻 In summary: Today, I'm looking for opportunities to either join the ongoing move or enter a fresh structure that sets us up for the next leg — especially with a news-heavy week ahead.
👉 Follow me for more EUR/USD trade ideas, market updates. 💼
I share structured analysis every Monday and Wednesday to help you stay aligned with the market 🗓️📊
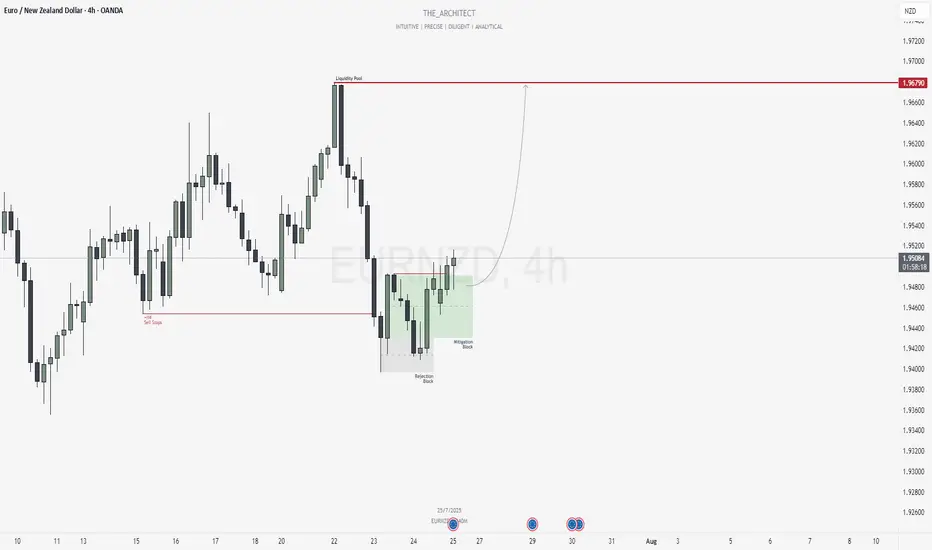
EURNZD: Bullish Shift and Institutional Re-Entry from SupportGreetings Traders,
In today’s analysis of EURNZD, we observe that institutional order flow on the H4 timeframe has recently shifted bullish. This alignment now provides us with a clear bias to seek buying opportunities in line with the predominant higher timeframe trend.
Higher Timeframe Context:
The weekly timeframe is currently delivering bullish order flow. With the recent bullish market structure shift (MSS) on the H4, we now have confluence across both timeframes, which strengthens our confidence in seeking long setups on lower timeframes.
Key Observations on H4:
Sell Stop Raid & Structural Rejection: Price action recently swept sell-side liquidity, a typical behavior indicating institutional order pairing. Following this, price attempted to move lower but failed to break the previous low, instead being supported by a Rejection Block. This led to a bullish market structure shift—our key signal of trend continuation.
Mitigation Block Entry Zone: Price has since retraced into a Mitigation Block—an area where previous institutional selling occurred. The purpose of this pullback is to mitigate earlier positions and initiate fresh buying orders. This now becomes our zone of interest for potential confirmation entries towards the upside.
Trading Plan:
Entry Strategy: Look for lower timeframe confirmation entries within the H4 Mitigation Block.
Target: The objective is to target the H4 liquidity pool residing at premium prices, aligning with the discount-to-premium delivery model.
For a detailed market walkthrough and in-depth execution zones, be sure to watch this week’s Forex Market Breakdown:https://tradingview.sweetlogin.com/chart/EURNZD/BZC9xW1L-July-21-Forex-Outlook-Don-t-Miss-These-High-Reward-Setups/
As always, remain patient and disciplined. Wait for confirmation before executing, and manage your risk accordingly.
Kind Regards,
The Architect 🏛️📈
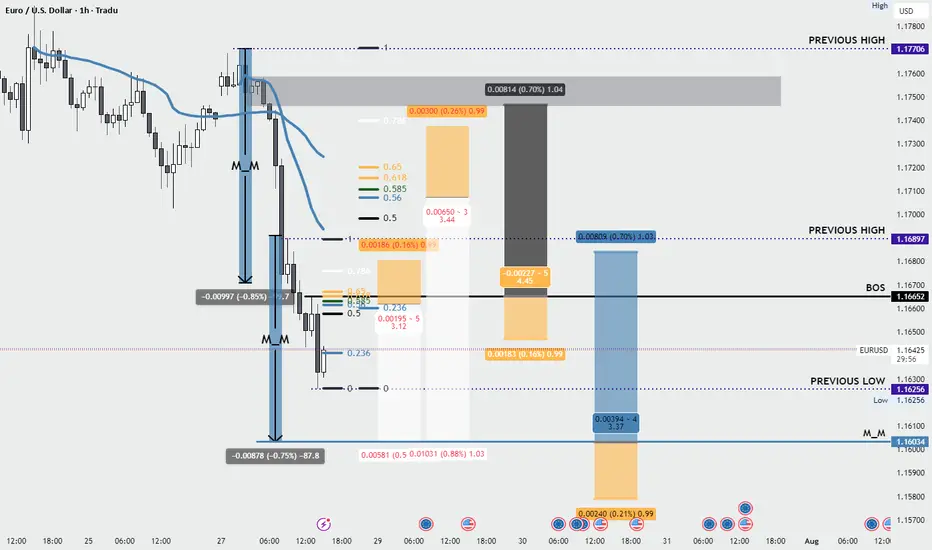
Next Move On EURUSD: A Bullish ContinuationWith this 4H bearish impulsive move, it’s easy to assume a reversal is underway to break the previous daily swing low. However, this appears more like a liquidity grab—fueling the next leg to the upside.
Price has retraced into a key zone that previously performed a strong liquidation. With significant liquidity already swept and clean inducements now resting above, this level becomes crucial.
This zone is the last stand: a break downward may target the daily swing low, while a hold and reaction could propel price toward the swing high.
Fingers crossed 🤞 as we watch price play out.
Have a great trading week, traders.
Catch you in the next one. 🫡
Silver Breakout, Tech Resistance & TRY Rotation 📊🔥 Silver Breakout, Tech Resistance & TRY Rotation – Structure Meets Reality 🌍📉
Hey traders, FXPROFESSOR here 👨🏫
Today’s charts show how technical structure and real-world capital behavior can tell one powerful story. We’re watching Silver surge, Tech stall, and the Turkish Lira react to local capital flows — all aligning with clean market levels.
Let’s break it down:
🔍 Silver (XAG/USD)
Price exploded into $39.30, reaching the top of a well-defined ascending channel.
Now stalling — pullbacks toward $35.38 or even $32.17 would be natural.
🧠 Structurally strong, fundamentally backed by industrial demand, inflation hedging, and tight supply dynamics. Just not a good timing to 'ape it' today.
📉 US Tech 100 (USTEC)
Testing resistance around 23,434.
RSI and OBV show signs of exhaustion, suggesting potential pause or pullback.
In a stretched macro environment, tech is vulnerable to rotation — especially if yields shift or inflation expectations change.
💱 EUR/TRY – Turkish Lira Rotation
We just saw a sharp rejection at 47.78, a key round-number resistance.
On the ground, there’s a notable shift — My Turkish brother says 'FX profits being converted into real estate and hard assets, especially by locals and returning expats'. And I trust a good Turk as much as i trust my Greek family! (yes, we can be friends when there is respect and no hatred! common interests work best in this troubled world)
The chart reflects this move: potential drop toward 46.00 → 45.45 → 43.79 if momentum fades.
🧩 What These Charts Teach Us
This is a perfect storm where technical resistance, macro rotation, and local capital behavior all align:
🔹 Silver rising = hard assets in favor
🔹 Tech pausing = overextension risk
🔹 TRY dropping = profit-taking & capital redeployment
Trade what you see — but understand why it’s happening.
One Love,
The FX PROFESSOR 💙
Disclosure: I am happy to be part of the Trade Nation's Influencer program and receive a monthly fee for using their TradingView charts in my analysis. Awesome broker, where the trader really comes first! 🌟🤝📈

Dollar Index (DXY): Possible Reversal | Inverse Head & ShouldersThe dollar has had a tough year, but that might be changing.
I’ve spotted a well-known reversal pattern: an Inverse Head & Shoulders.
This pattern features three dips, with the middle one—the "head"—being the deepest.
Now, the price has rebounded from the Right Shoulder and is heading higher.
It’s approaching the Neckline at $98.7, which needs to be broken for a bullish confirmation.
If that happens, the projected target is around $101.6, based on the depth of the pattern.
This lines up closely with the previous high of $102 from May. The target area is highlighted in the blue box.
However, if the price falls below the Right Shoulder’s low at $97.1, the pattern would be invalidated.
Anyone else see this pattern?
Could this be the bottom for the dollar?

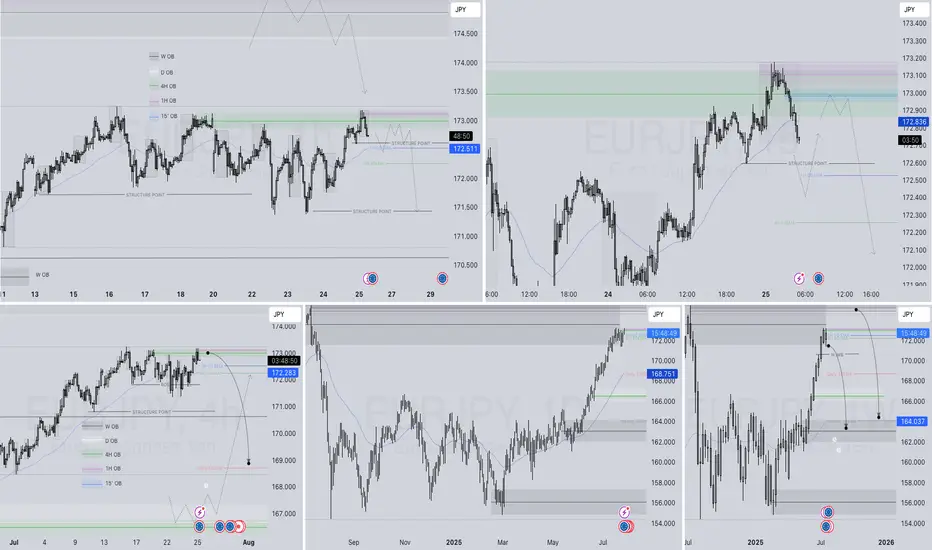
EURJPY – DAILY FORECAST Q3 | W31 | D28 | Y25📊 EURJPY – DAILY FORECAST
Q3 | W31 | D28 | Y25
Daily Forecast 🔍📅
Here’s a short diagnosis of the current chart setup 🧠📈
Higher time frame order blocks have been identified — these are our patient points of interest 🎯🧭.
It’s crucial to wait for a confirmed break of structure 🧱✅ before forming a directional bias.
This keeps us disciplined and aligned with what price action is truly telling us.
📈 Risk Management Protocols
🔑 Core principles:
Max 1% risk per trade
Only execute at pre-identified levels
Use alerts, not emotion
Stick to your RR plan — minimum 1:2
🧠 You’re not paid for how many trades you take, you’re paid for how well you manage risk.
🧠 Weekly FRGNT Insight
"Trade what the market gives, not what your ego wants."
Stay mechanical. Stay focused. Let the probabilities work.
OANDA:EURJPY

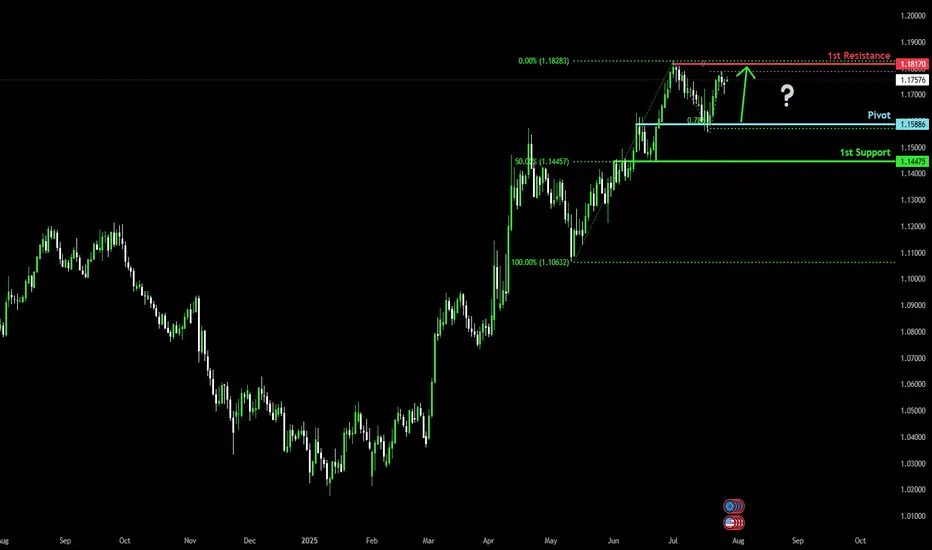
Bullish momentum to extend?The Fiber (EUR/USD) is falling towards the pivot, which acts as an overlap support and could rise to the 1st resistance, which has been identified as a swing high resistance.
Pivot: 1.1588
1st Support: 1.1447
1st Resistance: 1.1817
Risk Warning:
Trading Forex and CFDs carries a high level of risk to your capital and you should only trade with money you can afford to lose. Trading Forex and CFDs may not be suitable for all investors, so please ensure that you fully understand the risks involved and seek independent advice if necessary.
Disclaimer:
The above opinions given constitute general market commentary, and do not constitute the opinion or advice of IC Markets or any form of personal or investment advice.
Any opinions, news, research, analyses, prices, other information, or links to third-party sites contained on this website are provided on an "as-is" basis, are intended only to be informative, is not an advice nor a recommendation, nor research, or a record of our trading prices, or an offer of, or solicitation for a transaction in any financial instrument and thus should not be treated as such. The information provided does not involve any specific investment objectives, financial situation and needs of any specific person who may receive it. Please be aware, that past performance is not a reliable indicator of future performance and/or results. Past Performance or Forward-looking scenarios based upon the reasonable beliefs of the third-party provider are not a guarantee of future performance. Actual results may differ materially from those anticipated in forward-looking or past performance statements. IC Markets makes no representation or warranty and assumes no liability as to the accuracy or completeness of the information provided, nor any loss arising from any investment based on a recommendation, forecast or any information supplied by any third-party.
EURJPY 4Hour TF - July 27th, 2025EURJPY 7/27/2025
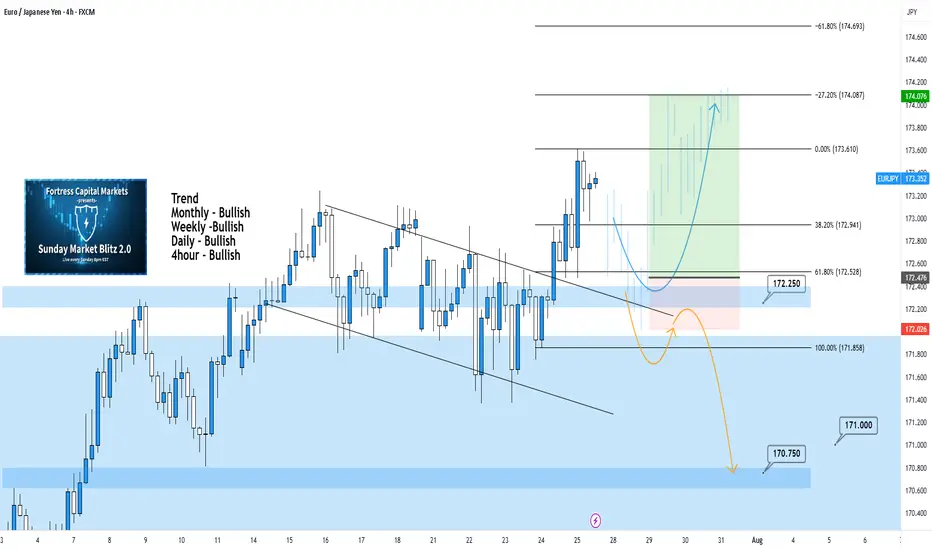
EURJPY 4hour Bullish Idea
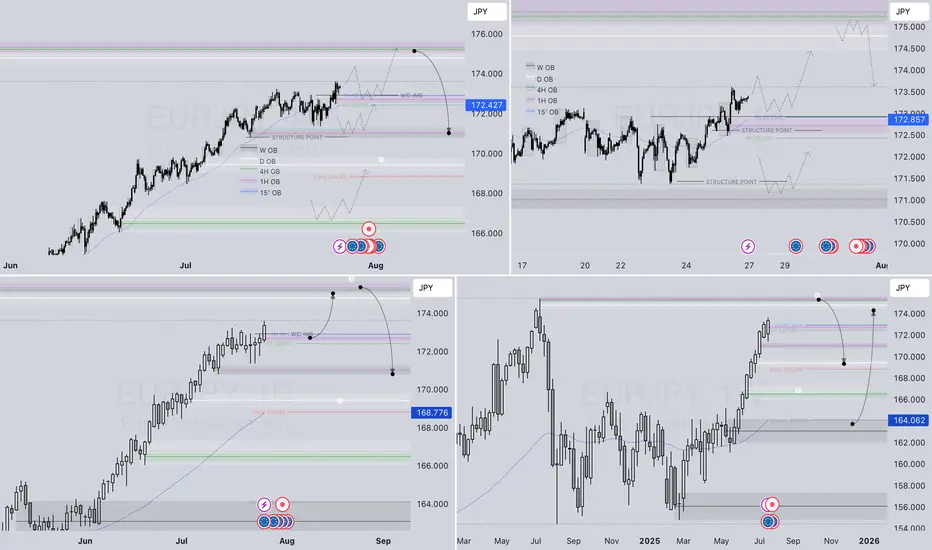
Monthly - Bullish
Weekly - Bullish
Daily - Bullish
4hour - Bullish
All timeframes suggest we are bullish and after last week that is clear. We’re expecting a bit of a pullback but let’s get into two potential setups for the week ahead:
Bullish Continuation - If we are to continue with the bullish trend we would like to enter a trade at the next point of structure. In this scenario, the next point of structure would be a higher low as close to 172.250 support & our 61.8% fib level as possible.
Look to target higher toward our -27% fib level if this happens.
Bearish Reversal - For us to consider EJ bearish again we would need to see a strong break below our support at 172.250.
If we see bearish structure below this zone we can say price action will most likely fall lower, potentially down to 170.750.
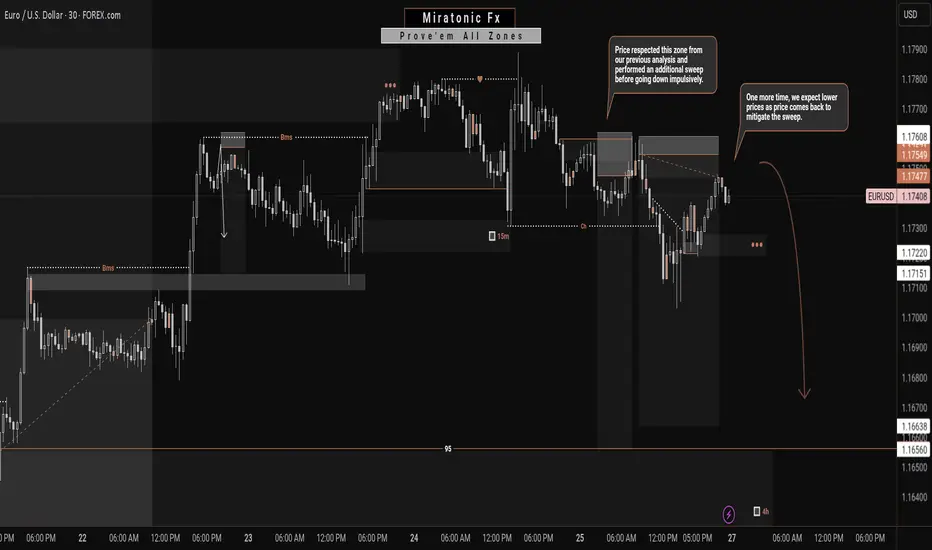
EURUSD: A Bearish Continuation?From my previous analysis, we anticipated a short-term decline on the EURUSD for a Daily bearish pullback. Price respected our zone and made a even stronger sweep before plummeting as forecasted.
Currently, price has returned to mitigate that liquidity sweep. Given the prior impulsive bearish move—which this current bullish correction stems from—we expect another drop, targeting the weak structure below for a potential liquidity grab or continuation.
We'll continue to monitor how price behaves around the current levels, but unless there's a significant shift in momentum, our bearish outlook remains valid. ✅
Follow us for more updates. 🔔
See you on the next one. 🫡
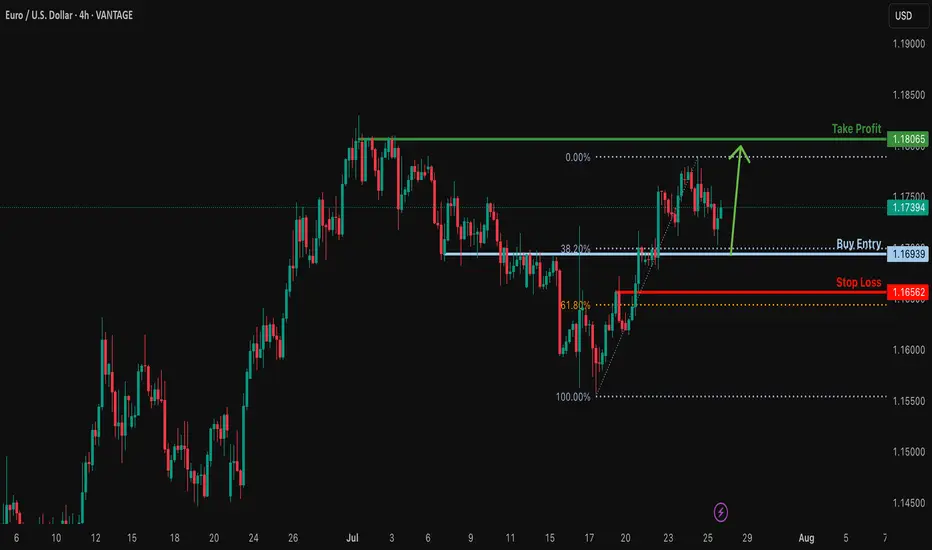
Bullish bounce off 38.2% Fibonacci support?EUR/USD is falling towards the support level, which is an overlap support that aligns with the 38.2% Fibonacci retracement and could bounce from this level to our take-profit.
Entry: 1.1693
Why we like it:
There is an overlap support that lines up with the 38.2% Fibonacci retracement.
Stop loss: 1.1656
Why we like it:
There is a pullback support that is slightly above the 61.8% Fibonacci retracement.
Take profit: 1.1806
Why we like it:
There is a swing high resistance.
Enjoying your TradingView experience? Review us!
Please be advised that the information presented on TradingView is provided to Vantage (‘Vantage Global Limited’, ‘we’) by a third-party provider (‘Everest Fortune Group’). Please be reminded that you are solely responsible for the trading decisions on your account. There is a very high degree of risk involved in trading. Any information and/or content is intended entirely for research, educational and informational purposes only and does not constitute investment or consultation advice or investment strategy. The information is not tailored to the investment needs of any specific person and therefore does not involve a consideration of any of the investment objectives, financial situation or needs of any viewer that may receive it. Kindly also note that past performance is not a reliable indicator of future results. Actual results may differ materially from those anticipated in forward-looking or past performance statements. We assume no liability as to the accuracy or completeness of any of the information and/or content provided herein and the Company cannot be held responsible for any omission, mistake nor for any loss or damage including without limitation to any loss of profit which may arise from reliance on any information supplied by Everest Fortune Group.
EURCHF Set To Fall! SELL!
My dear friends,
My technical analysis for EURCHF is below:
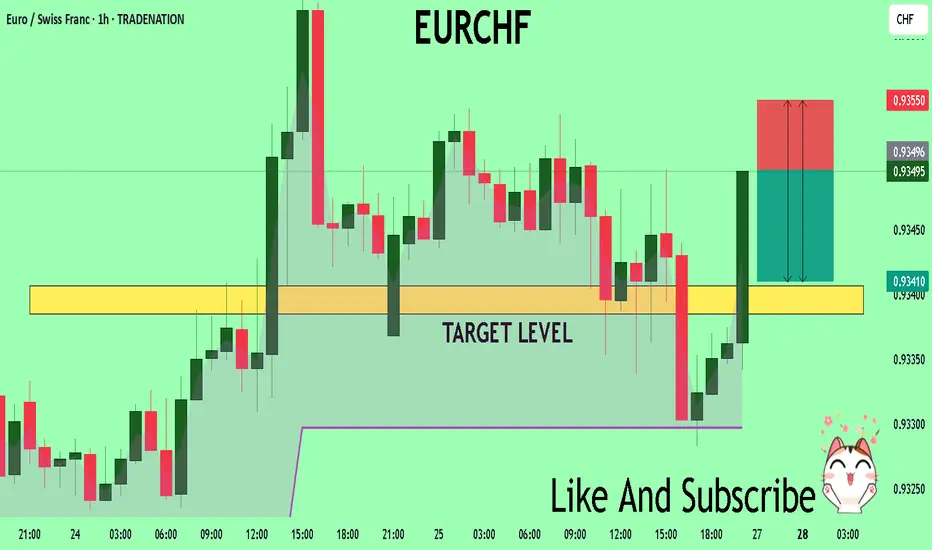
The market is trading on 0.9349 pivot level.
Bias - Bearish
Technical Indicators: Both Super Trend & Pivot HL indicate a highly probable Bearish continuation.
Target - 0.9340
Recommended Stop Loss - 0.9355
About Used Indicators:
A pivot point is a technical analysis indicator, or calculations, used to determine the overall trend of the market over different time frames.
Disclosure: I am part of Trade Nation's Influencer program and receive a monthly fee for using their TradingView charts in my analysis.
———————————
WISH YOU ALL LUCK
EURJPY – WEEKLY FORECAST Q3 | W31 | Y25📊 EURJPY – WEEKLY FORECAST
Q3 | W31 | Y25
Weekly Forecast 🔍📅
Here’s a short diagnosis of the current chart setup 🧠📈
Higher time frame order blocks have been identified — these are our patient points of interest 🎯🧭.
It’s crucial to wait for a confirmed break of structure 🧱✅ before forming a directional bias.
This keeps us disciplined and aligned with what price action is truly telling us.
📈 Risk Management Protocols
🔑 Core principles:
Max 1% risk per trade
Only execute at pre-identified levels
Use alerts, not emotion
Stick to your RR plan — minimum 1:2
🧠 You’re not paid for how many trades you take, you’re paid for how well you manage risk.
🧠 Weekly FRGNT Insight
"Trade what the market gives, not what your ego wants."
Stay mechanical. Stay focused. Let the probabilities work.
OANDA:EURJPY
Euro vs Kiwi Bull Raid: High Reward Target Strategy🏴☠️EUR/NZD Heist Plan: "Robbing the Kiwi Vault with Thief Trading Style" 💰🔥
🌍 Hi! Hola! Ola! Bonjour! Hallo! Marhaba! 🌍
Dear Money Makers, Chart Bandits & Market Strategists! 🤑💸✈️
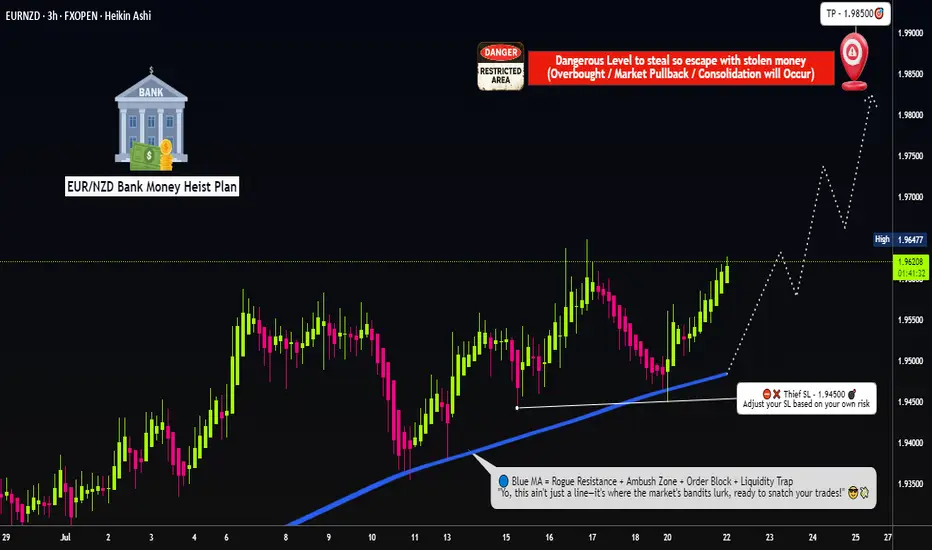
Here’s the EUR/NZD (Euro vs Kiwi) blueprint crafted using the signature 🔥Thief Trading Style🔥 — a blend of bold technicals, insightful fundamentals, and pure tactical precision. We’re setting our sights on a potential bullish breakout — targeting the high-security resistance zone where big money hides.
💡The Robbery Plan (Thief Entry Setup):
🟢 Entry Point:
"The vault is wide open — time to extract the bullish loot!"
⚔️ Entry can be taken at market price, but the smarter thieves use a layered Buy Limit strategy at pullback zones (near swing lows/highs on the 15-30 min TF) to snipe the best entries with reduced exposure.
🔁 Scaling in = DCA-style Thief Method: split entries for efficiency, just like robbing in waves.
🔻 Stop Loss Plan (Escape Route):
🔒 Place SL below the recent swing low using 3H timeframe (1.94500 for scalpers/day traders).
🛡️ Adjust based on risk appetite, lot size, and number of entries in play.
🎯 Take Profit Target:
🏁 Exit the heist near 1.98500, where strong resistance awaits. That’s the Danger Zone — the edge of our mission.
🔍EUR/NZD Outlook Snapshot:
This pair is flashing bullish vibes due to:
🏛️ Macro & Fundamental tailwinds
📊 COT positioning & Sentiment readings
🔗 Intermarket influences
📈 Price structure & liquidity zones
For more depth: dive into external analysis tools, COT reports, and sentiment dashboards to fine-tune your view. The direction is clear — the bulls are assembling.
⚠️ Trading Alerts & Risk Management Reminders:
🚨 News releases = volatility mines.
Before entering, make sure to:
Avoid new positions near red-flag economic events
Protect your open trades with trailing SLs or partial exits
Stay alert — the market shifts fast, adapt faster
💬 Final Word from the Vault Boss:
📢 Smashing likes = boosting the crew. 💥
Support the Thief Trading Style by hitting the BOOST button and keep the robbery crew rolling strong 💪💸
We're here to outsmart the market — one clean chart raid at a time.
Stay tuned for the next master plan. Until then, rob smart, rob safe. 🧠🔐💥
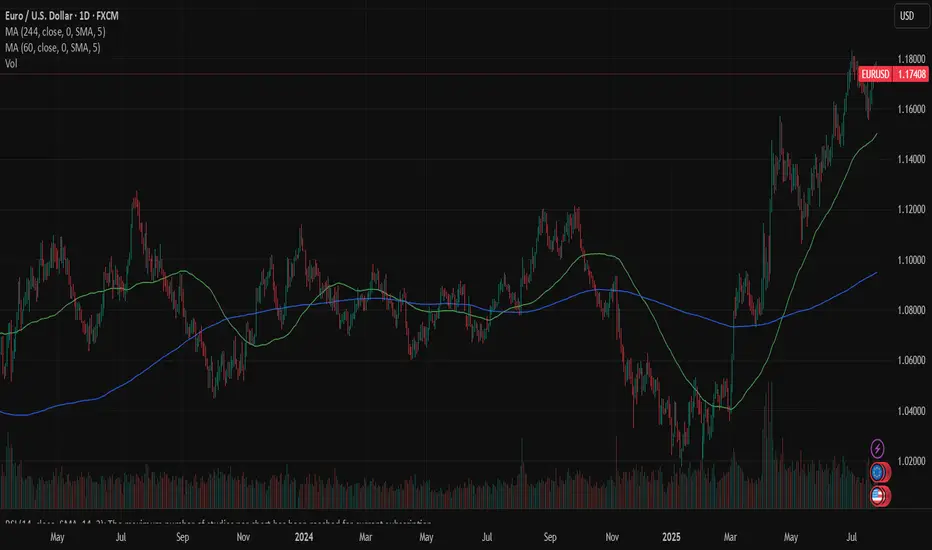
EURUSD: FOMC, PCE, NFP, JOLTs - busy week guaranteedThe ECB meeting was one of the major events during the previous week, when it comes to macro data. As it was widely expected, the ECB left rates unchanged, amid uncertainties related to trade tariffs with the U.S.. The ECB maintains its previous macro outlook, viewing the Euro Zone economy as resilient but facing downside risks. President Lagarde highlighted global trade tensions, geopolitical instability and negative shifts in market sentiment as key risks to further growth. At the same time, Lagarde dismissed concerns about the stronger euro, reiterating that the ECB does not target the exchange rate directly. With the inflation level of 2% and deposit rate of 2%, the ECB is in the position to take a wait-and-see stance on further rate cuts, although some analysts are mentioning the possibility of another 25bps cut in September.
Other macro data for the Euro Zone and Germany include the HCOB Manufacturing PMI Flash for July, which stood at 49,8 for the Euro Zone and 49,2 for Germany. Both indicators were standing in line with market expectations. The Ifo business Climate in Germany in July reached 88,6, in line with market forecast.
The previous week was relatively weak when it comes to currently important macro data for the U.S. economy. Posted data include Existing Home Sales in June, which reached 3,93M and were a bit lower from forecasted 4,0M. The indicator dropped by 2,7% compared to the previous month. The S&P Global Manufacturing PMI flash for July reached 49,5 a bit lower from market forecast of 52,6. At the same time the S&P Global Services PMI flash for July beat market expectation with the level of 55,2. The durable Goods Orders in June dropped by -9,3% compared to the previous month, which was a bit lower from -10,8% expected by the market.
The ECB meeting left its mark on the parity of eurusd currency pair during the previous week. The euro strengthened till the level of 1,1786, but eased as of the end of the week, closing it at 1,1742. The currency pair was testing the 1,17 support line on Friday's trading session. The RSI continues to move at levels above the 50 line, ending the week modestly below the level of 60. The MA50 continues to diverge from MA200, without an indication of a potential cross in the near term period.
The week ahead is an important one from the perspective of macro data. A bunch of currently closely watched data for the U.S. will be posted, including PCE, NFP, JOLTs, Unemployment rate in July. In addition to data, the FOMC meeting will be held on Wednesday, July 30th, where the Fed will decide on interest rates. Current market expectation is that the Fed will leave rates unchanged at this meeting. However, the final decision is with the Fed, in which case, any surprises might significantly move the currency pair toward one side. Also, in case of surprises with any of the above mentioned macro data the market reaction could bring higher volatility. Precaution in trading with eurusd in the week ahead is highly advisable. As per current charts, there is a high probability that the currency pair will move to the downside to test the 1,17 support level for one more time. Levels around the 1,1650 might also be shortly tested. In case that the market decides for a higher ground, there is some probability for the level of 1,18, as the next resistance level to be tested shortly.
Important news to watch during the week ahead are:
EUR: GDP Growth Rate for Q2 for both Germany and the Euro Zone, Unemployment rate in Germany in July, Inflation rate in Germany and the Euro Zone preliminary for July,
USD: JOLTs Job Openings in June, GDP Growth Rate for Q2, Pending Home Sales in June, the FOMC meeting and Fed interest rate decision will be held on Wednesday, July 30th, PCE Price Index for June will be posted on Thursday, July 31st, Non-farm Payrolls for July, Unemployment rate in July, ISM Manufacturing PMI in July, University of Michigan Consumer Sentiment final for July.
Gold vs Euro: Heist Plan Activated – Watch the Breakout🏆XAU/EUR Golden Robbery Masterplan: Steal from Weak Hands, Escape with Gold!💰✨
🌍Hi! Hola! Ola! Bonjour! Hallo! Marhaba!🌍
Welcome, Money Makers & Market Robbers! 🤑💰💸✈️
Another top-secret robbery mission drops now — this time on the XAU/EUR battlefield! Gold vs Euro... Who wins? We do! 🏴☠️🎯
🔍The Setup:
Thief Trading Strategy™ Active – Bullish Breakout Mode Engaged
🔒 Resistance wall at 3400 is the lock.
💣 Breakout is the detonation point.
🟢 Target: 2970.00 (but smart robbers always escape before the sirens ring 🚨).
⚠️ATR Zone = danger zone = potential trend reversal trap = don’t get greedy.
🛠️Execution Plan (aka How to Rob the Market Clean)
📈 Entry Plan
"The vault’s about to open..."
💥 Breakout above Moving Average (3400) = BUY confirmation.
☑️ Set Buy Stop Orders just above MA.
☑️ OR plan a Pullback Buy Limit on recent swing low/high in 15–30M TF.
🛎️ SET ALERTS like a real thief waiting for the back door to open!
🛑 Stop Loss Strategy
"Don’t be a hero – be a survivor."
📍 SL suggestion: 2845.00 (2H swing low)
💡 Customize SL based on lot size & risk appetite.
🚨 Only set SL after breakout confirmation (don’t let false alarms shake you).
🎯 Profit Target / Exit Strategy
⛏️ Dig for gold at 2970.00, but
🏃♂️Escape before the trap springs.
🧲 Scalpers: Stick to LONGS only!
💼 Big accounts: hit hard.
🧠 Small robbers: join swing crew and trail the stop — protect the loot 💰
📊 Trend & Fundamentals Summary
⚖️ Current Trend: Neutral → Bullish Bias
🔍 Influenced by:
Macro Data
Euro Sentiment Shift
COT Positioning
Central Bank Whispers
Intermarket Forces
Geopolitical Sparks 🔥
🧠 Full breakdown in the fundamental zone (liinkk 🔗 Klik).
🚨 News Warning Alert
📰 Avoid entries near major news releases.
🎯 If in trade, manage with trailing SL to lock profits & limit damage.
🔥💖 Support the Mission
Hit that BOOST 💥 button — fuel our next big heist.
Let’s show the market we rob, we don't beg!
💪 Be loyal to the crew. Trade smart. Escape rich. 🐱👤📈
🔐 Disclaimer:
This is for education & entertainment – not financial advice.
💡 Always DYOR & adjust risk per your capital.
🧠 Stay sharp. Stay rich. See you on the next score! 💼🚁💸

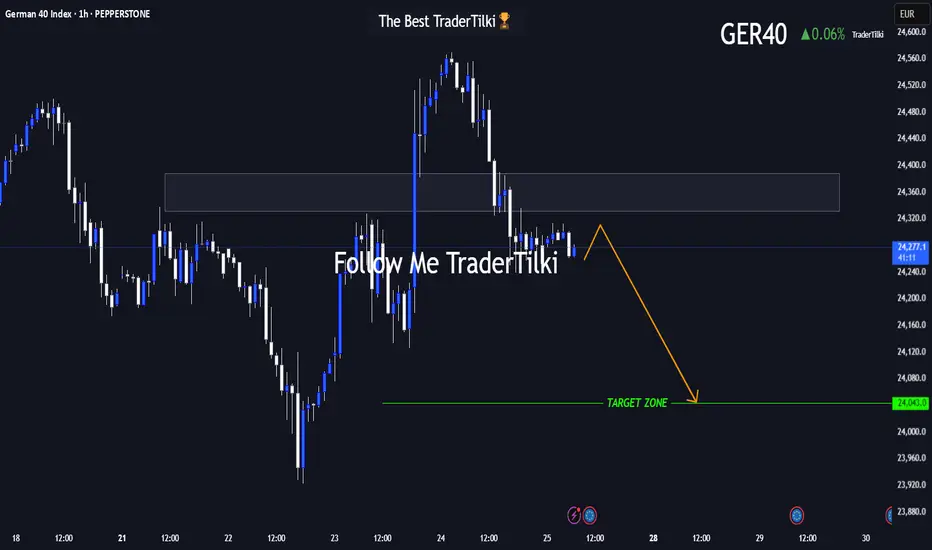
GER40 in Motion: This Setup Speaks Volumes 🌅 Good morning, my friends,
I’ve put together a fresh GER40 analysis just for you. Even if the 1-hour timeframe shows some upward momentum, I fully expect the price to reach my target level of **24,050**.
I'm holding firm until that level is hit.
Every single like from you is a massive source of motivation for me to keep sharing analysis. Huge thanks to everyone supporting with a tap!
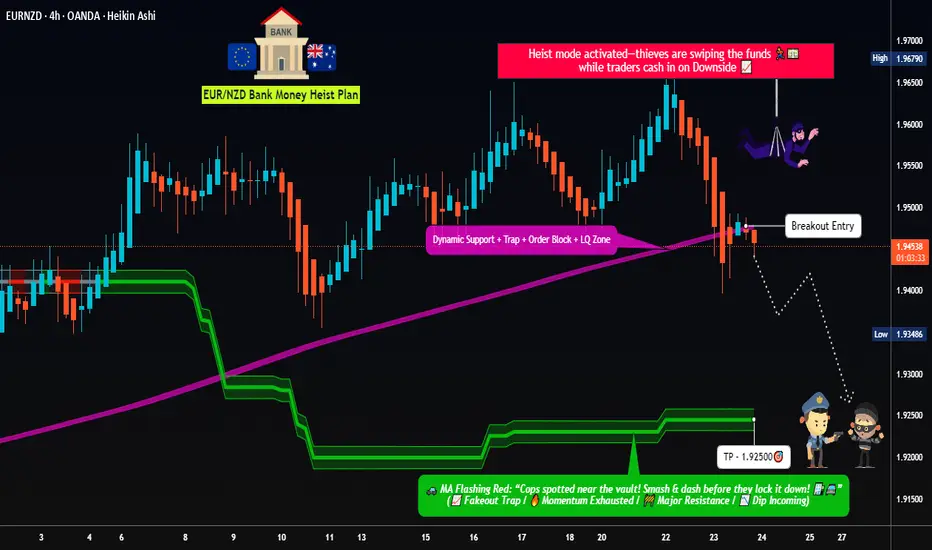
Dynamic Entry Alert – EUR/NZD Bearish Heist Execution!💣 EUR/NZD Robbery Blueprint: The Kiwi Vault Bearish Heist Plan 💰🕵️♂️
🌟Hi! Hola! Ola! Bonjour! Hallo! Marhaba!🌟
Dear Money Makers & Robbers, 🤑💰✈️
This ain't your usual trading tip — it’s a Thief Trading Masterstroke 🎯. We're gearing up for a high-stakes heist on the EUR/NZD forex market. Time to crack open the Kiwi vault and rob those bullish bandits blind! 😼💣
🧠 Strategic Mindset:
🔍 We're targeting the oversold consolidation zone. Bullish traders think they’re safe? Think again. This area is a trap — the perfect bait for our bearish ambush. Expect trend reversal vibes, layered with juicy liquidity grabs.
🕵️♂️ Entry Plan:
🎯 Sell Entry Trigger: Wait for a clean break below 1.94500.
💣 Setup:
Place Sell Stop Orders below the MA Support Breakout
Or... go stealth: Sell Limit Orders at nearest swing highs (15m or 30m timeframe)
Use DCA / Layering Method for multiple entries (scalp or swing tactics)
📌 Set your Alert 🚨 — no breakout, no entry. Patience pays.
🛑 Stop Loss Strategy (SL):
No premature moves! Don’t place that SL till we get the confirmed break.
🔥 SL Recommendation:
Just above 1.95700 (4H candle wick swing high)
Adjust based on lot size and number of layers
📍 Remember, the market’s a jungle — stay sharp or get sliced.
🎯 Take Profit (TP):
💵 Target Zone: 1.92500
(But hey, escape early if the vault starts shaking. Protect your gains like a pro.)
📊 Macro Intel – Why This Works:
This isn’t random — it's backed by our 🔥 combo of:
COT Reports
Sentiment Analysis
Quant/Algo Bias
Intermarket Correlation
Fundamental + Technical Confirmation
📌 You can dig deeper — but trust me, this setup’s been scouted like a pro job.
⚠️ Risk Protocols:
Avoid entries during high-impact news
Use Trailing SLs to lock in the loot
Adjust position size to suit your personal bankroll & risk appetite
🔥 Final Word from the Thief:
Smash that 💥Boost Button💥 if you're vibing with the heist plan!
Support the squad, stay profitable, and rob the market — legally, of course.
We don’t trade, we infiltrate.
We don’t predict, we execute.
📡 Stay tuned… More robbery blueprints coming soon!
🤑🐱👤🚨💸💪 #ThiefTrader #ForexHeist #EURNZDShortPlan
EURGBP near the current highest point of 2025.FX_IDC:EURGBP is slowly approaching a strong area of resistance, which is the current highest point of 2025. Let's dig in...
MARKETSCOM:EURGBP
Let us know what you think in the comments below.
Thank you.
75.2% of retail investor accounts lose money when trading CFDs with this provider. You should consider whether you understand how CFDs work and whether you can afford to take the high risk of losing your money. Past performance is not necessarily indicative of future results. The value of investments may fall as well as rise and the investor may not get back the amount initially invested. This content is not intended for nor applicable to residents of the UK. Cryptocurrency CFDs and spread bets are restricted in the UK for all retail clients.

EURUSD | Time For A Pullback?The week kicked off with strong impulsive moves to the upside, leaving no room for deeper correction. Then slowly from Wednesday, we started to see a decline in strength in the bullish run.
Now, with price edging toward the next swing low for a possible bearish change of character, is this a good way to ride the stream to the downside?
Keep your A-game on as we watch price unfold, and trade reactively to price movement.
Do not forget to guard your capitals with risk management.
Good luck traders. 👍
Follow me for more and more of these analyses.
See you on the next one. 🫡
SHORT ON EUR/NZDEZ Has given a nice CHOC to the downside with plenty of sell side liquidity to be collected.
I will be selling EZ to the next level of demand looking to catch 300-500 pips

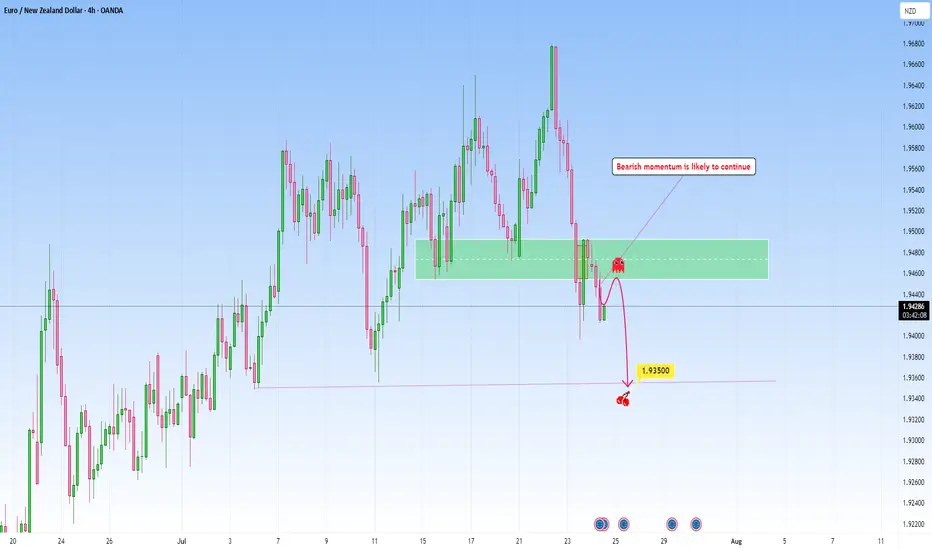
EURNZD Continuation setup following recent bearish momentumThe market has recently pushed down with momentum.
Price attempted a timid "echo bounce" back into the broken support but was rejected, confirming this area now serves as area for bearish re-entries.
From what I can tell, we're entering the next leg of what I call the “Gravity Spiral Phase”, where sellers take over after taking a clear zone. Each wave down is not just a move, but a continuation of momentum migration into new bearish move.
Target: 1.93500
This level marks the next gravity anchor, a zone where price memory may attempt to stabilize, but only temporarily.
EURJPY Q3 | D25 | W30 | Y25📊 EURJPY Q3 | D25 | W30 | Y25
Daily Forecast🔍📅
Here’s a short diagnosis of the current chart setup 🧠📈
Higher time frame order blocks have been identified — these are our patient points of interest 🎯🧭.
It’s crucial to wait for a confirmed break of structure 🧱✅ before forming a directional bias.
This keeps us disciplined and aligned with what price action is truly telling us.
📈 Risk Management Protocols
🔑 Core principles:
Max 1% risk per trade
Only execute at pre-identified levels
Use alerts, not emotion
Stick to your RR plan — minimum 1:2
🧠 You’re not paid for how many trades you take, you’re paid for how well you manage risk.
🧠 Weekly FRGNT Insight
"Trade what the market gives, not what your ego wants."
Stay mechanical. Stay focused. Let the probabilities work.
FRGNT
OANDA:EURJPY