EURNZD On The Rise! BUY!
My dear friends,
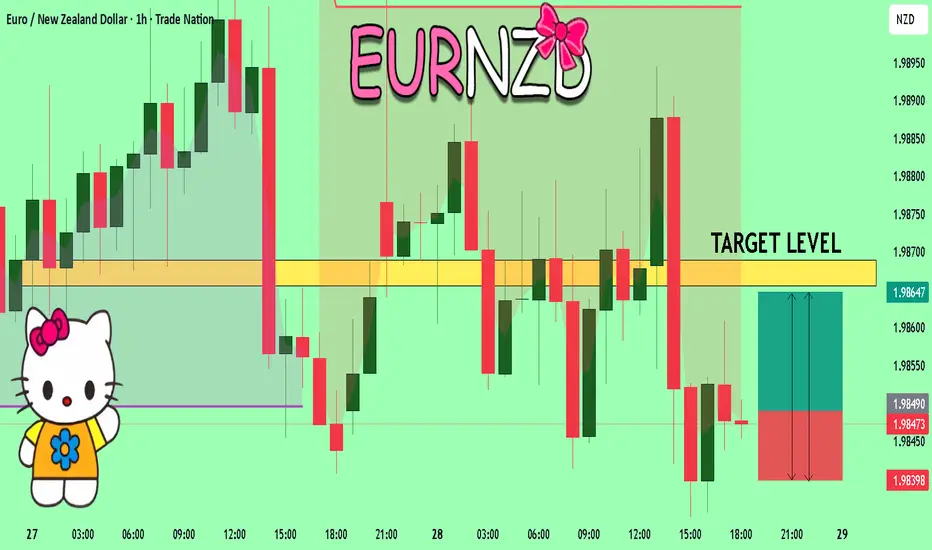
Please, find my technical outlook for EURNZD below:
The instrument tests an important psychological level 1.9849
Bias - Bullish
Technical Indicators: Supper Trend gives a precise Bullish signal, while Pivot Point HL predicts price changes and potential reversals in the market.
Target - 1.9865
Recommended Stop Loss - 1.9839
About Used Indicators:
Super-trend indicator is more useful in trending markets where there are clear uptrends and downtrends in price.
Disclosure: I am part of Trade Nation's Influencer program and receive a monthly fee for using their TradingView charts in my analysis.
———————————
WISH YOU ALL LUCK
EUR (Euro)
EUR/NZD BEARISH BIAS RIGHT NOW| SHORT
Hello, Friends!
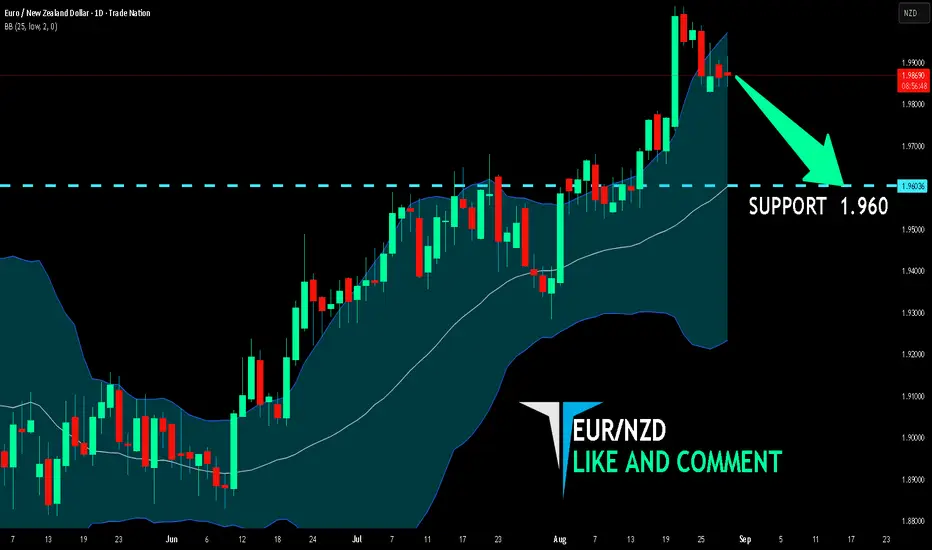
We are now examining the EUR/NZD pair and we can see that the pair is going up locally while also being in a uptrend on the 1W TF. But there is also a powerful signal from the BB upper band being nearby, indicating that the pair is overbought so we can go short from the resistance line above and a target at 1.960 level.
Disclosure: I am part of Trade Nation's Influencer program and receive a monthly fee for using their TradingView charts in my analysis.
✅LIKE AND COMMENT MY IDEAS✅
EUR/CHF SENDS CLEAR BEARISH SIGNALS|SHORT
Hello, Friends!
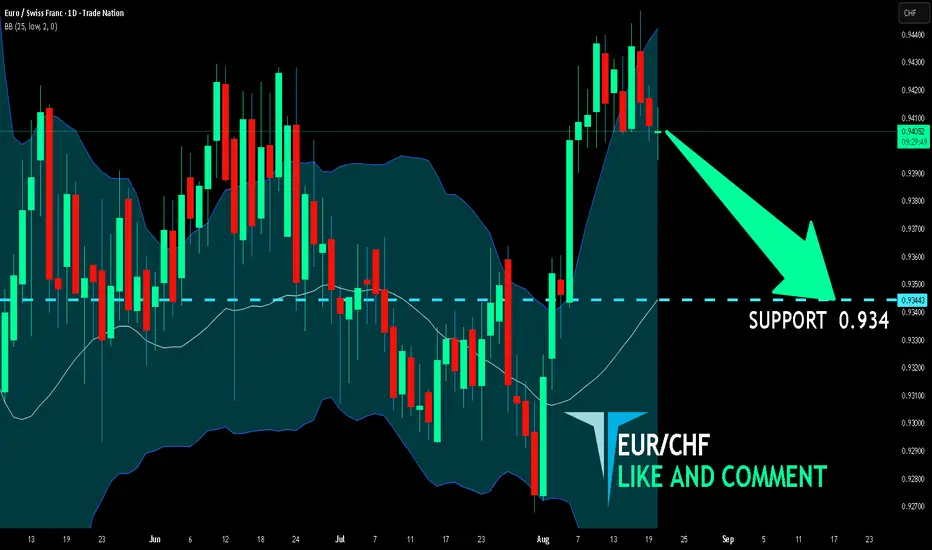
The BB upper band is nearby so EUR-CHF is in the overbought territory. Thus, despite the uptrend on the 1W timeframe I think that we will see a bearish reaction from the resistance line above and a move down towards the target at around 0.934.
Disclosure: I am part of Trade Nation's Influencer program and receive a monthly fee for using their TradingView charts in my analysis.
✅LIKE AND COMMENT MY IDEAS✅
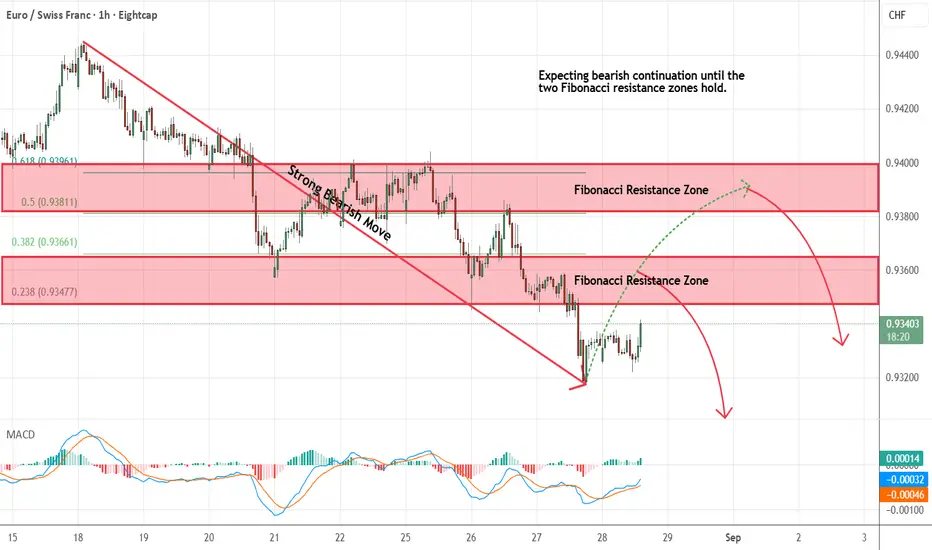
EURCHF - Short Term Sell IdeaH1 - Strong bearish move.
No opposite signs.
Currently it looks like a pullback is happening.
Expecting bearish continuation until the two Fibonacci resistance zones hold.
If you enjoy this idea, don’t forget to LIKE 👍, FOLLOW ✅, SHARE 🙌, and COMMENT ✍! Drop your thoughts and charts below to keep the discussion going. Your support helps keep this content free and reach more people! 🚀
--------------------------------------------------------------------------------------------------------------------
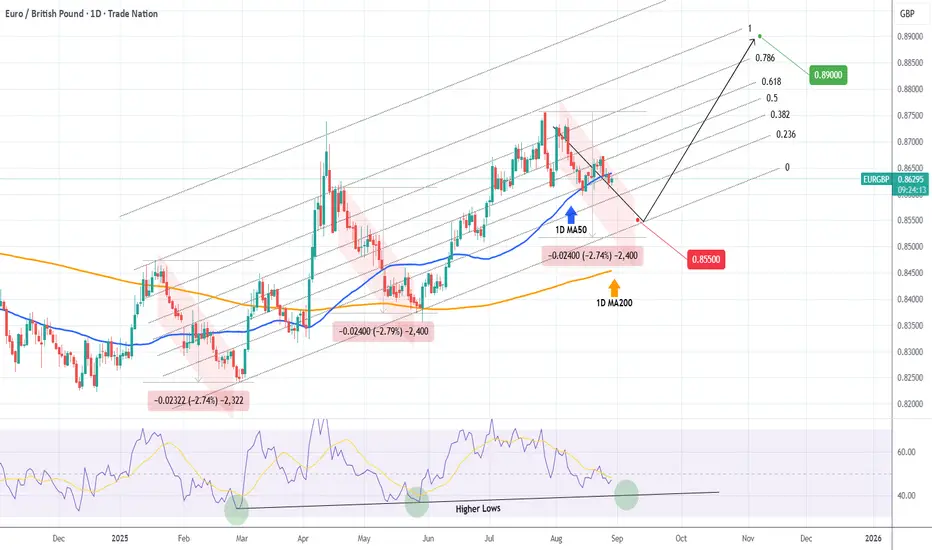
EURBGP Sell this Leg and buy at the bottom.Last time we took a look a the EURGBP pair (July 11, see chart below), we gave a buy signal inside the Channel Up, which quickly hit our 0.87400 Target:
This time the price has found itself on a decline, the latest Bearish Leg of the Channel Up. The previous two declined by -2.75% before bottoming and reversing. The 1D RSI Higher Lows can be an additional indicator as to where the Low can be priced.
We expect the pair to reach at least 0.85500 before starting the new Bullish Leg, which we believe will extend all the way near the top (1.0 Fibonacci) of the Channel Up. Our Target will be 0.8900.
-------------------------------------------------------------------------------
** Please LIKE 👍, FOLLOW ✅, SHARE 🙌 and COMMENT ✍ if you enjoy this idea! Also share your ideas and charts in the comments section below! This is best way to keep it relevant, support us, keep the content here free and allow the idea to reach as many people as possible. **
-------------------------------------------------------------------------------
Disclosure: I am part of Trade Nation's Influencer program and receive a monthly fee for using their TradingView charts in my analysis.
💸💸💸💸💸💸
👇 👇 👇 👇 👇 👇
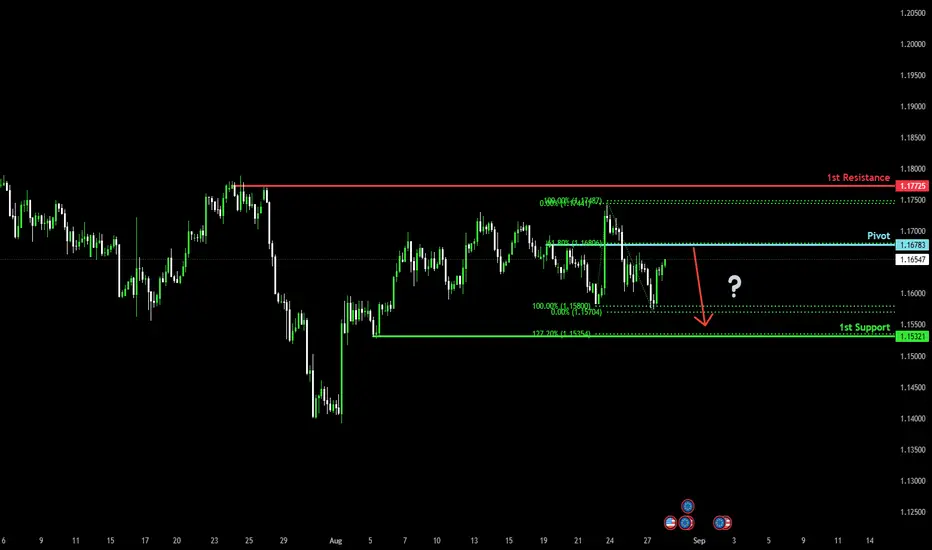
Bearish Reversal Ahead?The Fiber (EUR/USD) is rising towards the pivot, which aligns with the 61.8% Fibonacci retracement and could reverse to the 1st support which is a pullback support.
Pivot: 1.1678
1st Support: 1.1532
1st Resistance: 1.1772
Risk Warning:
Trading Forex and CFDs carries a high level of risk to your capital and you should only trade with money you can afford to lose. Trading Forex and CFDs may not be suitable for all investors, so please ensure that you fully understand the risks involved and seek independent advice if necessary.
Disclaimer:
The above opinions given constitute general market commentary, and do not constitute the opinion or advice of IC Markets or any form of personal or investment advice.
Any opinions, news, research, analyses, prices, other information, or links to third-party sites contained on this website are provided on an "as-is" basis, are intended only to be informative, is not an advice nor a recommendation, nor research, or a record of our trading prices, or an offer of, or solicitation for a transaction in any financial instrument and thus should not be treated as such. The information provided does not involve any specific investment objectives, financial situation and needs of any specific person who may receive it. Please be aware, that past performance is not a reliable indicator of future performance and/or results. Past Performance or Forward-looking scenarios based upon the reasonable beliefs of the third-party provider are not a guarantee of future performance. Actual results may differ materially from those anticipated in forward-looking or past performance statements. IC Markets makes no representation or warranty and assumes no liability as to the accuracy or completeness of the information provided, nor any loss arising from any investment based on a recommendation, forecast or any information supplied by any third-party.
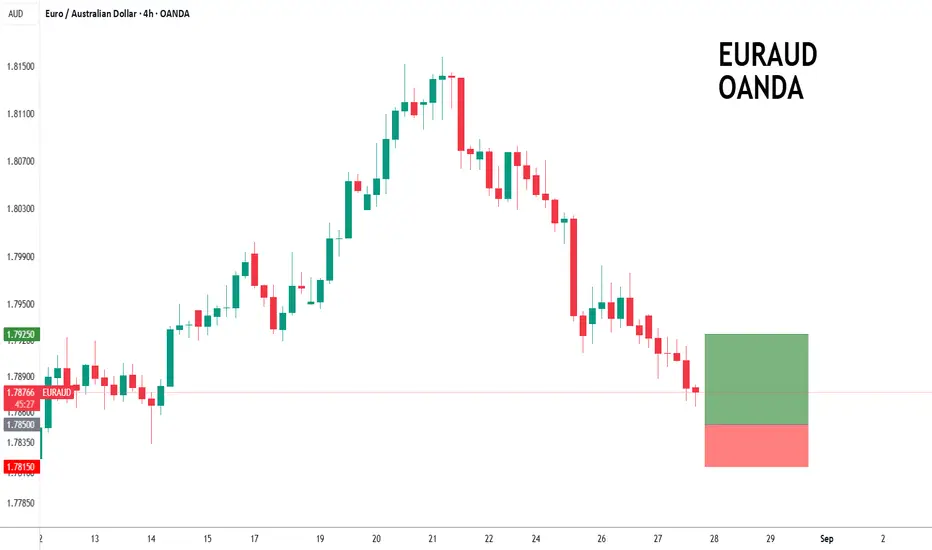
EURAUD to see a turnaround?EURAUD - 24h expiry
There is no clear indication that the upward move is coming to an end.
Although we remain bullish overall, a correction is possible with plenty of room to move lower without impacting the trend higher.
Risk/Reward would be poor to call a buy from current levels.
A move through 1.7900 will confirm the bullish momentum.
The measured move target is 1.7950.
We look to Buy at 1.7850 (stop at 1.7815)
Our profit targets will be 1.7925 and 1.7950
Resistance: 1.7900 / 1.7925 / 1.7950
Support: 1.7875 / 1.7850 / 1.7825
Risk Disclaimer
The trade ideas beyond this page are for informational purposes only and do not constitute investment advice or a solicitation to trade. This information is provided by Signal Centre, a third-party unaffiliated with OANDA, and is intended for general circulation only. OANDA does not guarantee the accuracy of this information and assumes no responsibilities for the information provided by the third party. The information does not take into account the specific investment objectives, financial situation, or particular needs of any particular person. You should take into account your specific investment objectives, financial situation, and particular needs before making a commitment to trade, including seeking, under a separate engagement, as you deem fit.
You accept that you assume all risks in independently viewing the contents and selecting a chosen strategy.
Where the research is distributed in Singapore to a person who is not an Accredited Investor, Expert Investor or an Institutional Investor, Oanda Asia Pacific Pte Ltd (“OAP“) accepts legal responsibility for the contents of the report to such persons only to the extent required by law. Singapore customers should contact OAP at 6579 8289 for matters arising from, or in connection with, the information/research distributed.
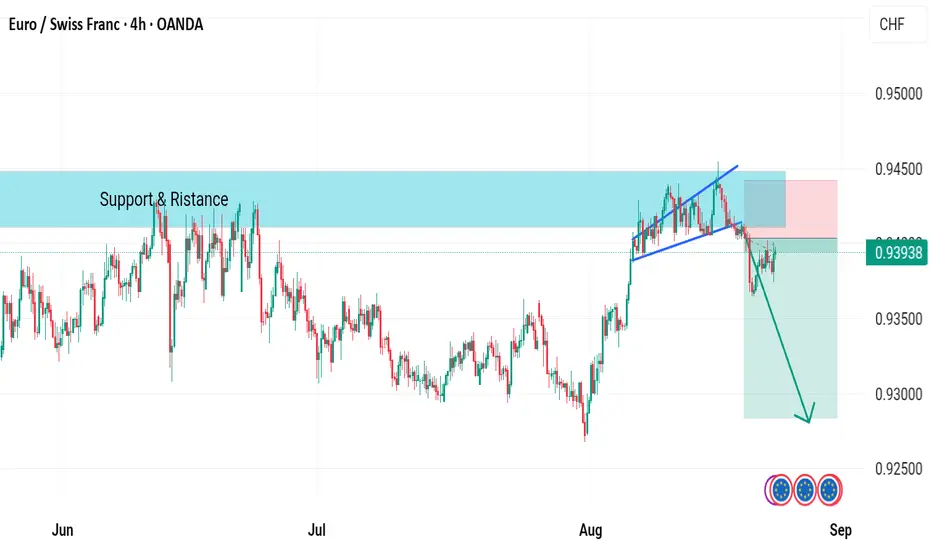
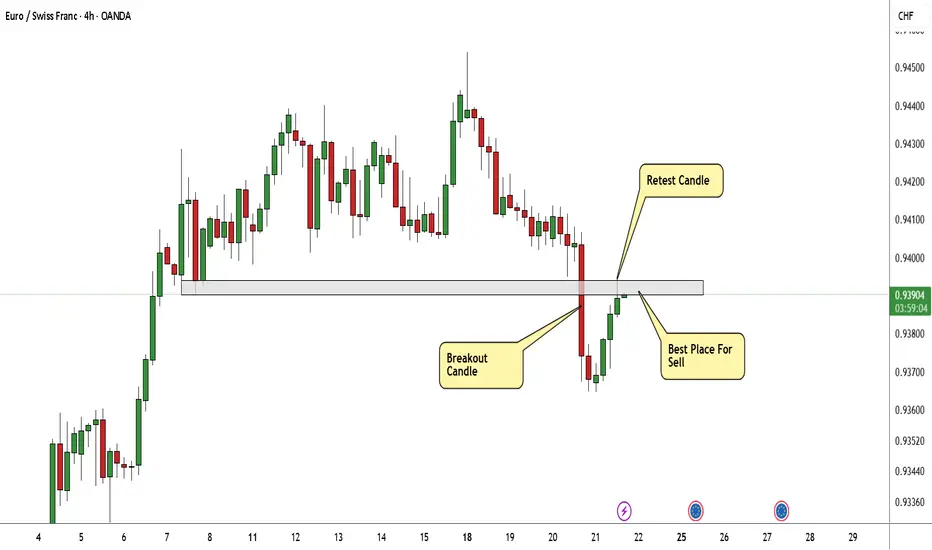
EUR/CHF Breakout Done , Let`s Sell To Get 100 Pips !Here is my 4H T.F EUR/CHF Chart and we have a very clear breakout and the price confirmed already by amazing bearish candle closed below my Support , So we can sell now and targeting from 50 to 100 pips .
Reasons :
1- Clear Breakout
2- Bearish P.A .
3- Clear Confirmation .
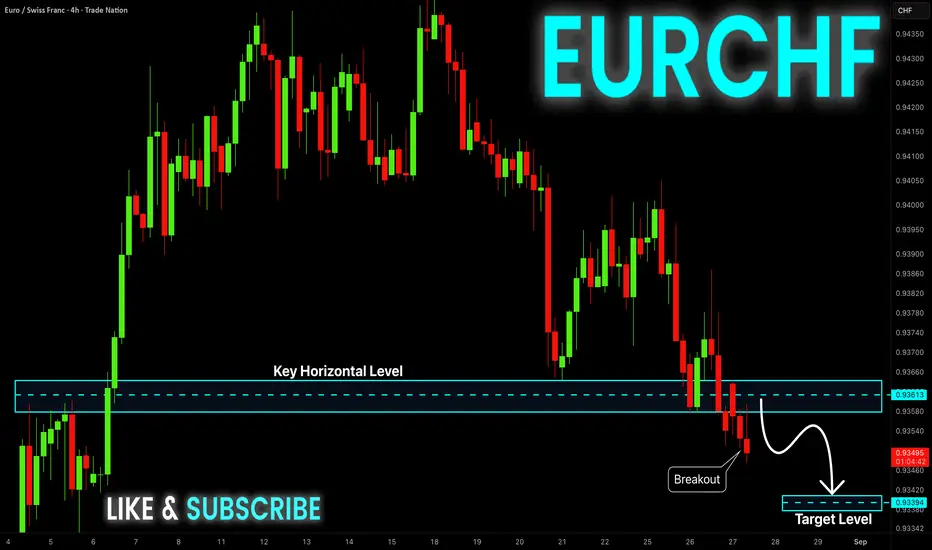
EUR-CHF Bearish Breakout! Buy!
Hello,Traders!
EUR-CHF made a bearish
Breakout of the key horizontal
Level of 0.9361 so we are
Bearish biased and we
Will be expecting a
Further bearish move down
Sell!
Comment and subscribe to help us grow!
Check out other forecasts below too!
Disclosure: I am part of Trade Nation's Influencer program and receive a monthly fee for using their TradingView charts in my analysis.
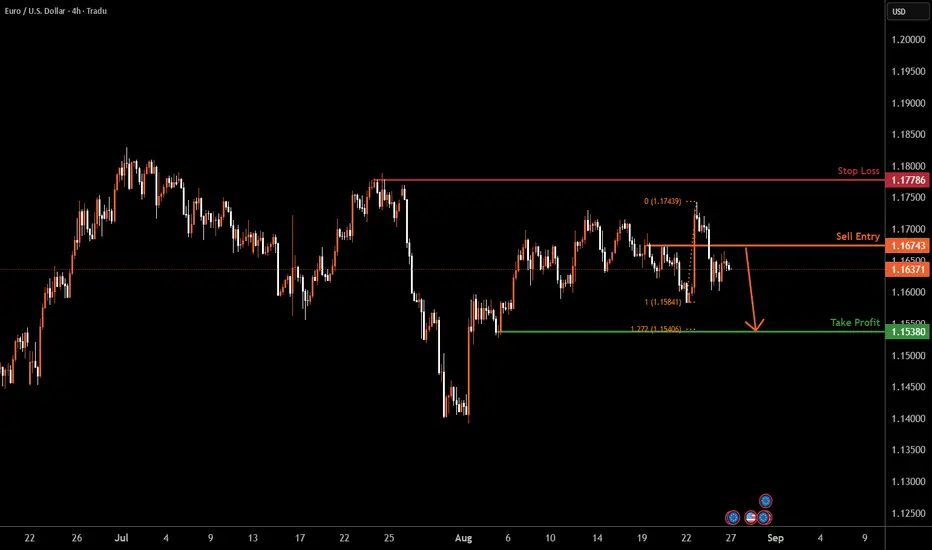
EURUSD H4 | Bearish reversalEUR/USD is rising towards the sell entry which is a pullback resistance and could drop from this level to the downside.
Sell entry is at 1.1674, which is a pullback resistance.
Stop loss is at 1.1778, which is a swing high resistance.
Take profit is at 1.1538, a pullback support that aligns with the 127.2% Fibonacci extension.
High Risk Investment Warning
Trading Forex/CFDs on margin carries a high level of risk and may not be suitable for all investors. Leverage can work against you.
Stratos Markets Limited (tradu.com ):
CFDs are complex instruments and come with a high risk of losing money rapidly due to leverage. 65% of retail investor accounts lose money when trading CFDs with this provider. You should consider whether you understand how CFDs work and whether you can afford to take the high risk of losing your money.
Stratos Europe Ltd (tradu.com ):
CFDs are complex instruments and come with a high risk of losing money rapidly due to leverage. 66% of retail investor accounts lose money when trading CFDs with this provider. You should consider whether you understand how CFDs work and whether you can afford to take the high risk of losing your money.
Stratos Global LLC (tradu.com ):
Losses can exceed deposits.
Please be advised that the information presented on TradingView is provided to Tradu (‘Company’, ‘we’) by a third-party provider (‘TFA Global Pte Ltd’). Please be reminded that you are solely responsible for the trading decisions on your account. There is a very high degree of risk involved in trading. Any information and/or content is intended entirely for research, educational and informational purposes only and does not constitute investment or consultation advice or investment strategy. The information is not tailored to the investment needs of any specific person and therefore does not involve a consideration of any of the investment objectives, financial situation or needs of any viewer that may receive it. Kindly also note that past performance is not a reliable indicator of future results. Actual results may differ materially from those anticipated in forward-looking or past performance statements. We assume no liability as to the accuracy or completeness of any of the information and/or content provided herein and the Company cannot be held responsible for any omission, mistake nor for any loss or damage including without limitation to any loss of profit which may arise from reliance on any information supplied by TFA Global Pte Ltd.
The speaker(s) is neither an employee, agent nor representative of Tradu and is therefore acting independently. The opinions given are their own, constitute general market commentary, and do not constitute the opinion or advice of Tradu or any form of personal or investment advice. Tradu neither endorses nor guarantees offerings of third-party speakers, nor is Tradu responsible for the content, veracity or opinions of third-party speakers, presenters or participants.
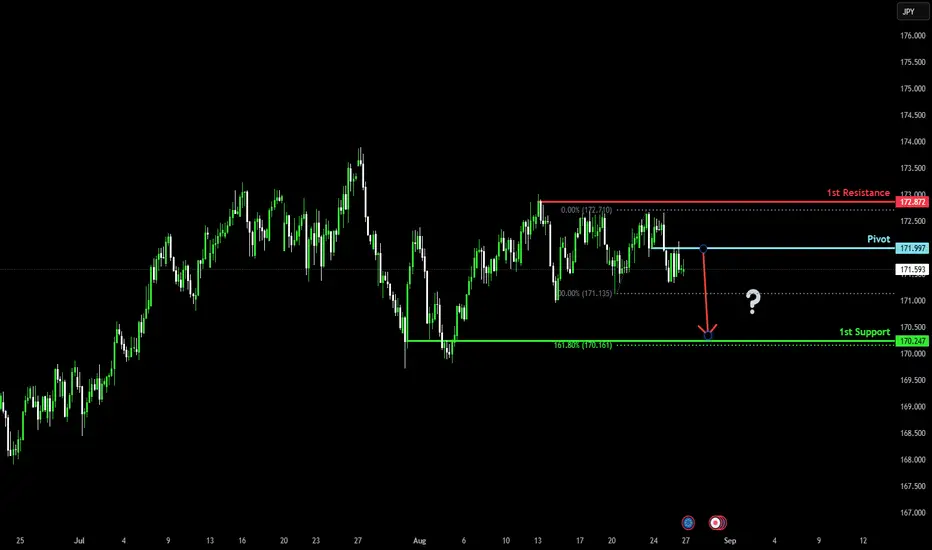
Bearish drop?EUR/JPY has rejected off the pivot which acts as a pullback resistance and could drop to the 1st support.
Pivot: 171.99
1st Support: 170.24
1st Reistance: 172.87
Risk Warning:
Trading Forex and CFDs carries a high level of risk to your capital and you should only trade with money you can afford to lose. Trading Forex and CFDs may not be suitable for all investors, so please ensure that you fully understand the risks involved and seek independent advice if necessary.
Disclaimer:
The above opinions given constitute general market commentary, and do not constitute the opinion or advice of IC Markets or any form of personal or investment advice.
Any opinions, news, research, analyses, prices, other information, or links to third-party sites contained on this website are provided on an "as-is" basis, are intended only to be informative, is not an advice nor a recommendation, nor research, or a record of our trading prices, or an offer of, or solicitation for a transaction in any financial instrument and thus should not be treated as such. The information provided does not involve any specific investment objectives, financial situation and needs of any specific person who may receive it. Please be aware, that past performance is not a reliable indicator of future performance and/or results. Past Performance or Forward-looking scenarios based upon the reasonable beliefs of the third-party provider are not a guarantee of future performance. Actual results may differ materially from those anticipated in forward-looking or past performance statements. IC Markets makes no representation or warranty and assumes no liability as to the accuracy or completeness of the information provided, nor any loss arising from any investment based on a recommendation, forecast or any information supplied by any third-party.
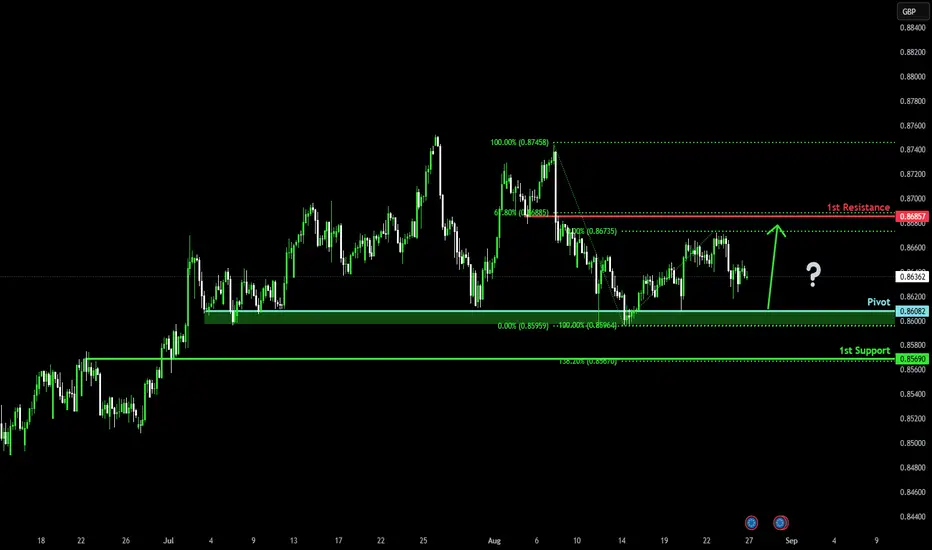
Falling towards major support?EUR/GBP is falling towards the pivot and could bounce to the 1st resistance which acts as a pullback resistance.
Pivot: 0.8608
1st Support: 0.8569
1st Resistance: 0.8658
Risk Warning:
Trading Forex and CFDs carries a high level of risk to your capital and you should only trade with money you can afford to lose. Trading Forex and CFDs may not be suitable for all investors, so please ensure that you fully understand the risks involved and seek independent advice if necessary.
Disclaimer:
The above opinions given constitute general market commentary, and do not constitute the opinion or advice of IC Markets or any form of personal or investment advice.
Any opinions, news, research, analyses, prices, other information, or links to third-party sites contained on this website are provided on an "as-is" basis, are intended only to be informative, is not an advice nor a recommendation, nor research, or a record of our trading prices, or an offer of, or solicitation for a transaction in any financial instrument and thus should not be treated as such. The information provided does not involve any specific investment objectives, financial situation and needs of any specific person who may receive it. Please be aware, that past performance is not a reliable indicator of future performance and/or results. Past Performance or Forward-looking scenarios based upon the reasonable beliefs of the third-party provider are not a guarantee of future performance. Actual results may differ materially from those anticipated in forward-looking or past performance statements. IC Markets makes no representation or warranty and assumes no liability as to the accuracy or completeness of the information provided, nor any loss arising from any investment based on a recommendation, forecast or any information supplied by any third-party.
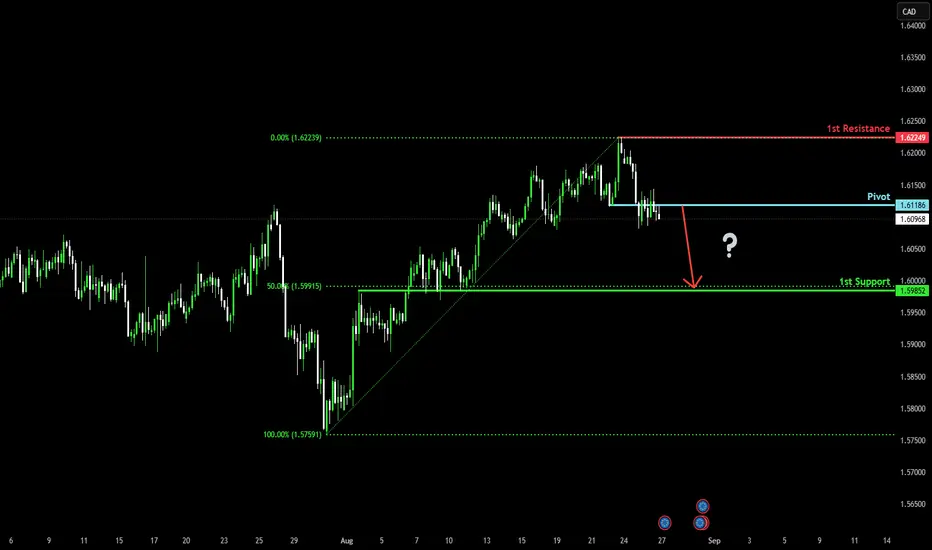
Bearish drop?EUR/CAD is reacting off the pivot which is a pullback resistance and could drop to the 50% Fibonacci support.
Pivot: 1.61186
1st Support: 1.59852
1st Resistance: 1.62249
Risk Warning:
Trading Forex and CFDs carries a high level of risk to your capital and you should only trade with money you can afford to lose. Trading Forex and CFDs may not be suitable for all investors, so please ensure that you fully understand the risks involved and seek independent advice if necessary.
Disclaimer:
The above opinions given constitute general market commentary, and do not constitute the opinion or advice of IC Markets or any form of personal or investment advice.
Any opinions, news, research, analyses, prices, other information, or links to third-party sites contained on this website are provided on an "as-is" basis, are intended only to be informative, is not an advice nor a recommendation, nor research, or a record of our trading prices, or an offer of, or solicitation for a transaction in any financial instrument and thus should not be treated as such. The information provided does not involve any specific investment objectives, financial situation and needs of any specific person who may receive it. Please be aware, that past performance is not a reliable indicator of future performance and/or results. Past Performance or Forward-looking scenarios based upon the reasonable beliefs of the third-party provider are not a guarantee of future performance. Actual results may differ materially from those anticipated in forward-looking or past performance statements. IC Markets makes no representation or warranty and assumes no liability as to the accuracy or completeness of the information provided, nor any loss arising from any investment based on a recommendation, forecast or any information supplied by any third-party.
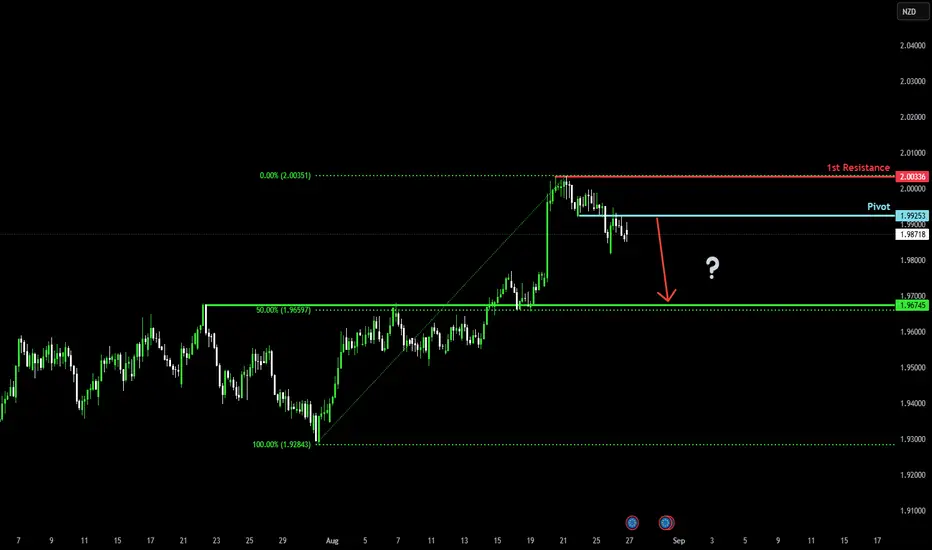
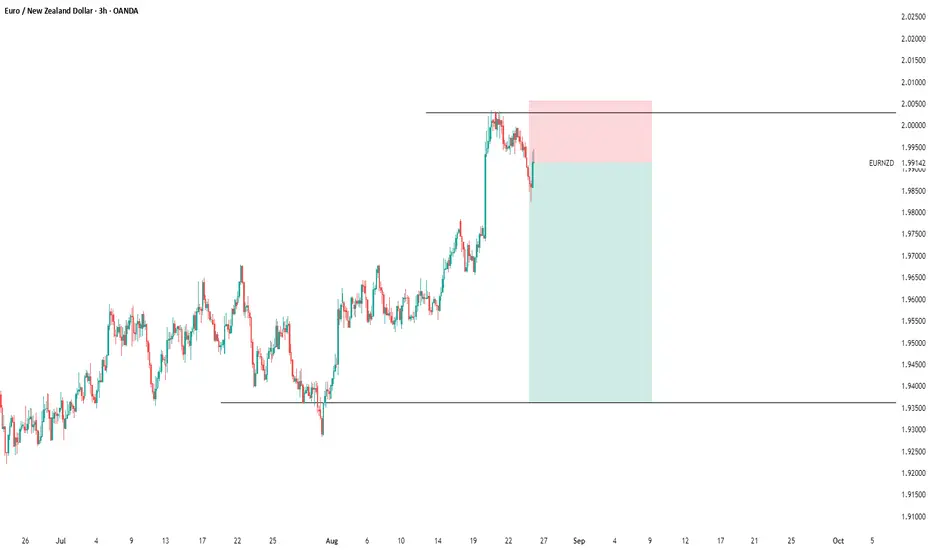
Potential bearish drop?EUR/NZD is reacting off the pivot and could drop to the 1st support which acts as an overlap support that aligns with the 50% Fibonacci retracement.
Pivot: 1.99253
1st Support: 1.96745
1st Resistance: 2.00336
Risk Warning:
Trading Forex and CFDs carries a high level of risk to your capital and you should only trade with money you can afford to lose. Trading Forex and CFDs may not be suitable for all investors, so please ensure that you fully understand the risks involved and seek independent advice if necessary.
Disclaimer:
The above opinions given constitute general market commentary, and do not constitute the opinion or advice of IC Markets or any form of personal or investment advice.
Any opinions, news, research, analyses, prices, other information, or links to third-party sites contained on this website are provided on an "as-is" basis, are intended only to be informative, is not an advice nor a recommendation, nor research, or a record of our trading prices, or an offer of, or solicitation for a transaction in any financial instrument and thus should not be treated as such. The information provided does not involve any specific investment objectives, financial situation and needs of any specific person who may receive it. Please be aware, that past performance is not a reliable indicator of future performance and/or results. Past Performance or Forward-looking scenarios based upon the reasonable beliefs of the third-party provider are not a guarantee of future performance. Actual results may differ materially from those anticipated in forward-looking or past performance statements. IC Markets makes no representation or warranty and assumes no liability as to the accuracy or completeness of the information provided, nor any loss arising from any investment based on a recommendation, forecast or any information supplied by any third-party.
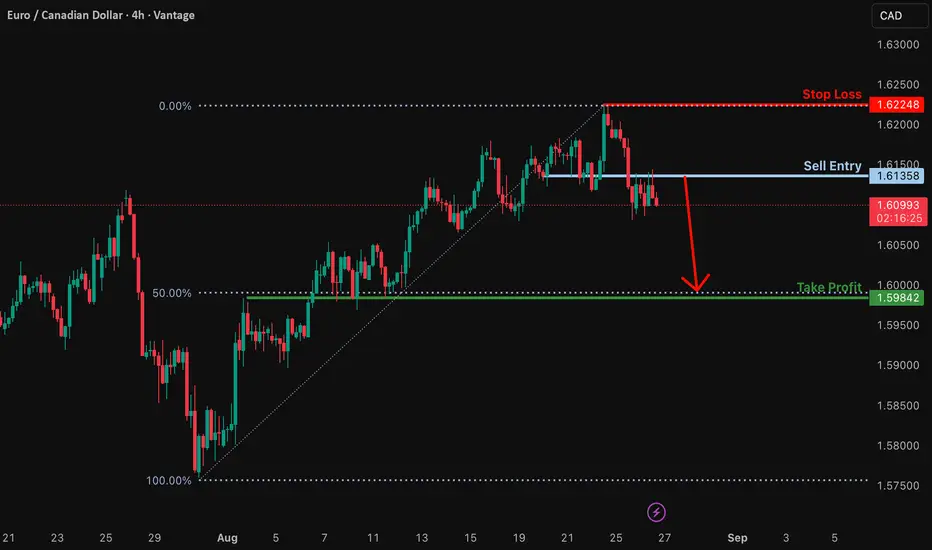
Potential bearish drop?EUR/CAD has rejected off the resistance level, which is a pullback resistance, and could drop from this level to our take profit.
Entry: 1.61358
Why we like it:
There is a pullback resistance.
Stop loss: 1.62248
Why we like it:
There is a swing high resistance.
Take profit: 1.59842
Why we like it:
There is an overlap support that aligns with the 50% Fibonacci retracement.
Enjoying your TradingView experience? Review us!
Please be advised that the information presented on TradingView is provided to Vantage (‘Vantage Global Limited’, ‘we’) by a third-party provider (‘Everest Fortune Group’). Please be reminded that you are solely responsible for the trading decisions on your account. There is a very high degree of risk involved in trading. Any information and/or content is intended entirely for research, educational and informational purposes only and does not constitute investment or consultation advice or investment strategy. The information is not tailored to the investment needs of any specific person and therefore does not involve a consideration of any of the investment objectives, financial situation or needs of any viewer that may receive it. Kindly also note that past performance is not a reliable indicator of future results. Actual results may differ materially from those anticipated in forward-looking or past performance statements. We assume no liability as to the accuracy or completeness of any of the information and/or content provided herein and the Company cannot be held responsible for any omission, mistake nor for any loss or damage including without limitation to any loss of profit which may arise from reliance on any information supplied by Everest Fortune Group.
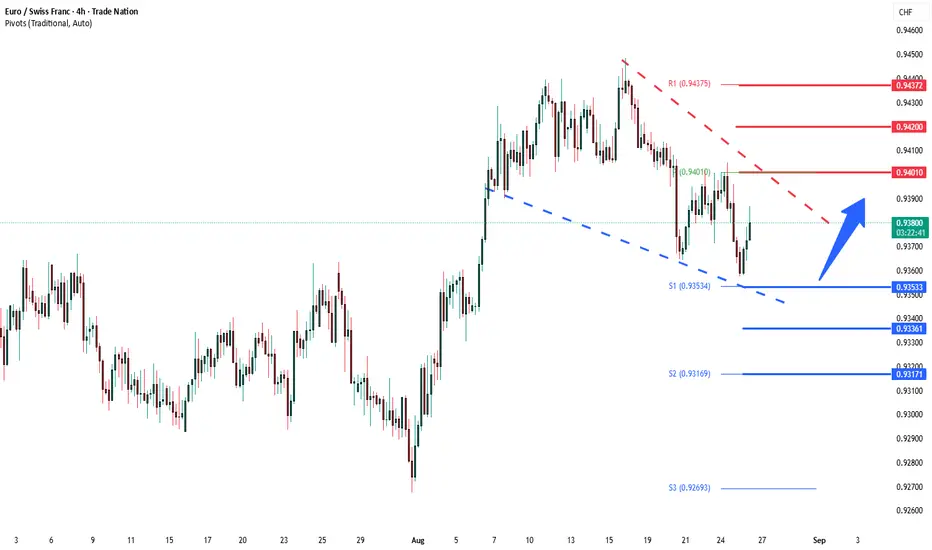
EURCHF Uptrend continuation resistance at 0.9400The EURCHF remains in a bullish trend, with recent price action showing signs of a corrective pullback within the broader uptrend.
Support Zone: 0.9350 – a key level from previous consolidation. Price is currently testing or approaching this level.
A bullish rebound from 0.9350 would confirm ongoing upside momentum, with potential targets at:
0.9400 – initial resistance
0.9420 – psychological and structural level
0.9440 – extended resistance on the longer-term chart
Bearish Scenario:
A confirmed break and daily close below 0.9350 would weaken the bullish outlook and suggest deeper downside risk toward:
0.9336 – minor support
0.9320 – stronger support and potential demand zone
Outlook:
Bullish bias remains intact while the EURCHF holds above 0.9350 A sustained break below this level could shift momentum to the downside in the short term.
This communication is for informational purposes only and should not be viewed as any form of recommendation as to a particular course of action or as investment advice. It is not intended as an offer or solicitation for the purchase or sale of any financial instrument or as an official confirmation of any transaction. Opinions, estimates and assumptions expressed herein are made as of the date of this communication and are subject to change without notice. This communication has been prepared based upon information, including market prices, data and other information, believed to be reliable; however, Trade Nation does not warrant its completeness or accuracy. All market prices and market data contained in or attached to this communication are indicative and subject to change without notice.
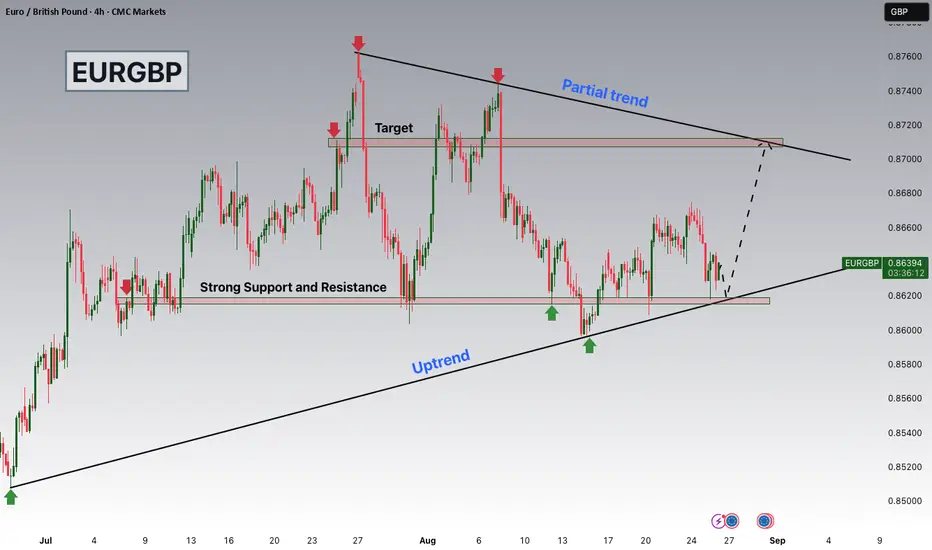
EURGBP Watching 0.86200 Support with 0.87100 in FocusIn today's session, EURGBP is trading within a broader uptrend, but price action is currently undergoing a correction phase. The pair is approaching the 0.86200 support zone, which aligns with the ascending trend structure that has been respected over recent weeks. This level has previously acted as both support and resistance, making it an area worth close attention.
Should price stabilize around 0.86200, the 0.87100 region becomes a logical area of interest. This zone is notable because it coincides with both a horizontal resistance level and the partial trend intersection, which often acts as a technical magnet for price.
Trade safe, Joe.
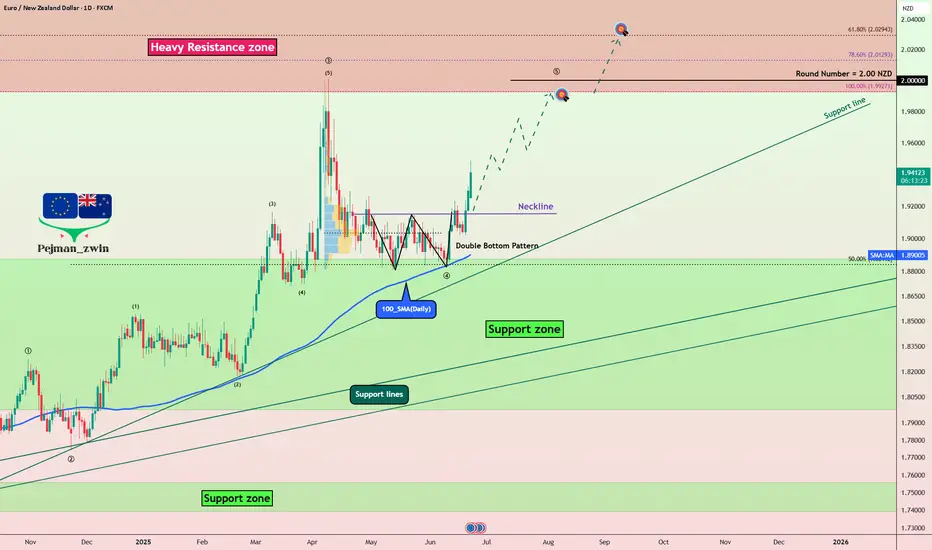
EURNZD Eyes 1.99 — Technical & Fundamental Bulls AlignedToday, I want to analyze EURNZD ( OANDA:EURNZD ) for you, which is in good shape both technically and fundamentally .
Please stay with me.
EURNZD is moving close to the Support zone(1.88750 NZD-1.7970 NZD) and 100_SMA(Daily) and has managed to form a Double Bottom Pattern .
From the perspective of Elliott Wave theory , EURNZD seems to have completed the main wave 4 , and we should wait for the main wave 5 . The main wave 5 could complete at the Heavy Resistance zone(2.120 NZD-1.9927 NZD) .
-----------------------------------
EURNZD – Fundamental Analysis:
The EURNZD pair currently reflects a divergence between two very different economic outlooks.
Eurozone (EUR):
The European Central Bank (ECB) has recently begun cutting interest rates to support slowing economic activity, especially in the industrial and manufacturing sectors. Despite this dovish shift, inflation remains relatively under control, and the euro has held up well against riskier currencies thanks to global uncertainty and safe-haven flows.
New Zealand (NZD):
New Zealand's economy is under pressure. The latest GDP figures confirmed a weak growth outlook, and signs of a technical recession are mounting. While the Reserve Bank of New Zealand (RBNZ) has maintained a relatively hawkish tone, it faces a dilemma: inflation is sticky, but domestic demand and housing remain fragile. The RBNZ may be forced to soften its stance sooner than expected.
Outlook:
This fundamental backdrop supports a bullish bias for EURNZD. The euro’s relative stability versus the increasingly vulnerable New Zealand dollar makes this pair attractive for long positions — especially if upcoming NZ data disappoints or global risk sentiment weakens further.
-----------------------------------
Based on the above explanation, I expect EURNZD to rise to at least 1.9917 NZD .
Note: Stop Loss(SL): 1.8779 NZD
Please respect each other's ideas and express them politely if you agree or disagree.
Euro/New Zealand Dollar Analyze (EURNZD), Daily time frame.
Be sure to follow the updated ideas.
Do not forget to put a Stop loss for your positions (For every position you want to open).
Please follow your strategy and updates; this is just my Idea, and I will gladly see your ideas in this post.
Please do not forget the ✅' like '✅ button 🙏😊 & Share it with your friends; thanks, and Trade safe.
eurnzd sell signal. Don't forget about stop-loss.
Write in the comments all your questions and instruments analysis of which you want to see.
Friends, push the like button, write a comment, and share with your mates - that would be the best THANK YOU.
P.S. I personally will open entry if the price will show it according to my strategy.
Always make your analysis before a trade
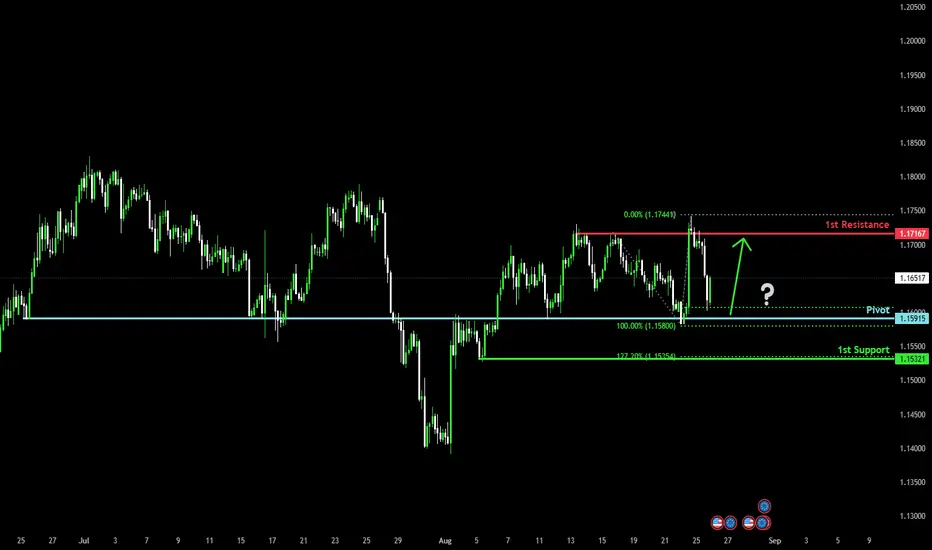
Bullish bounce for the Fiber?The price is falling towards the pivot, which acts as an overlap support and could bounce to the 1st resistance, which is a pullback resistance.
Pivot: 1.1591
1st Suport: 1.1532
1st Resistance: 1.1677
Risk Warning:
Trading Forex and CFDs carries a high level of risk to your capital and you should only trade with money you can afford to lose. Trading Forex and CFDs may not be suitable for all investors, so please ensure that you fully understand the risks involved and seek independent advice if necessary.
Disclaimer:
The above opinions given constitute general market commentary, and do not constitute the opinion or advice of IC Markets or any form of personal or investment advice.
Any opinions, news, research, analyses, prices, other information, or links to third-party sites contained on this website are provided on an "as-is" basis, are intended only to be informative, is not an advice nor a recommendation, nor research, or a record of our trading prices, or an offer of, or solicitation for a transaction in any financial instrument and thus should not be treated as such. The information provided does not involve any specific investment objectives, financial situation and needs of any specific person who may receive it. Please be aware, that past performance is not a reliable indicator of future performance and/or results. Past Performance or Forward-looking scenarios based upon the reasonable beliefs of the third-party provider are not a guarantee of future performance. Actual results may differ materially from those anticipated in forward-looking or past performance statements. IC Markets makes no representation or warranty and assumes no liability as to the accuracy or completeness of the information provided, nor any loss arising from any investment based on a recommendation, forecast or any information supplied by any third-party.
EURNZD Massive Long! BUY!
My dear followers,
This is my opinion on the EURNZD next move:
The asset is approaching an important pivot point 1.9922
Bias - Bullish
Safe Stop Loss - 1.9911
Technical Indicators: Supper Trend generates a clear short signal while Pivot Point HL is currently determining the overall Bearish trend of the market.
Goal - 1.9946
About Used Indicators:
For more efficient signals, super-trend is used in combination with other indicators like Pivot Points.
Disclosure: I am part of Trade Nation's Influencer program and receive a monthly fee for using their TradingView charts in my analysis.
———————————
WISH YOU ALL LUCK

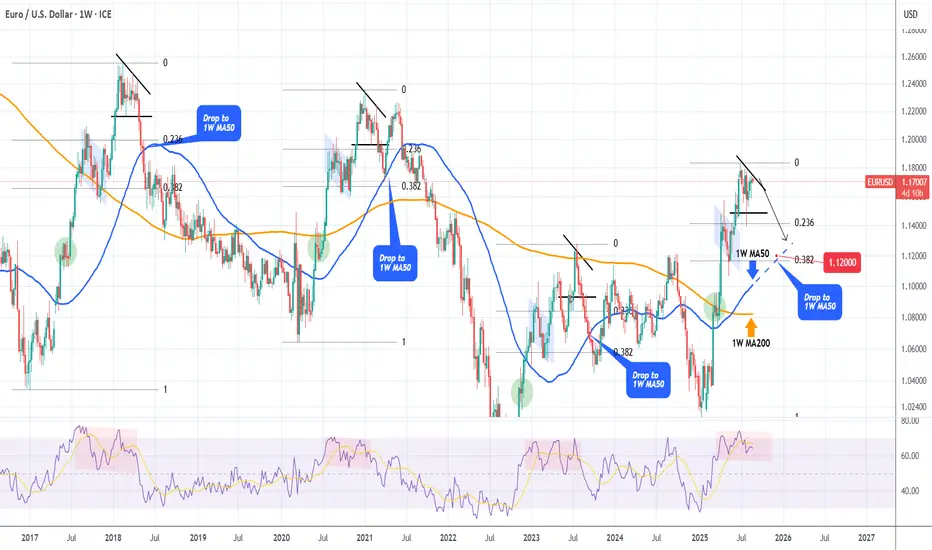
EURUSD Is it about to experience a big drop??The EURUSD pair has been consolidating under moderate pressure since the June 30 (weekly) High with its 1W RSI basically ranged since April 14.
We have seen this sequence of sideways 1W RSI trading after hitting the overbought (70.00) level another 3 times in the past 8 years. All of those times, the market priced a long-term Top there or shortly after.
In all instances, the first Target was the 1W MA50 (blue trend-line), with the price even going as low as the 0.382 Fibonacci retracement level.
If the Top this time was already priced in June, then we should be expecting a Target of at least 1.1200 on the medium-term, which would be a potential contact with the 1W MA50 and marginally above the 0.382 Fib.
-------------------------------------------------------------------------------
** Please LIKE 👍, FOLLOW ✅, SHARE 🙌 and COMMENT ✍ if you enjoy this idea! Also share your ideas and charts in the comments section below! This is best way to keep it relevant, support us, keep the content here free and allow the idea to reach as many people as possible. **
-------------------------------------------------------------------------------
Disclosure: I am part of Trade Nation's Influencer program and receive a monthly fee for using their TradingView charts in my analysis.
💸💸💸💸💸💸
👇 👇 👇 👇 👇 👇
EURCHF SELL SETUP SIGNAL Hello everyone, if we focus on the chart, we will see a possible head and shoulders formation, and we will also see a bullish flag indicating a decline. We also have a consolidation area at the top that was broken downwards to continue the decline, in addition to the German GDP (Sabe), which indicates a decline in the Eurozone, especially the selfish economy, the strongest economy in the Eurozone, which supports our analysis.