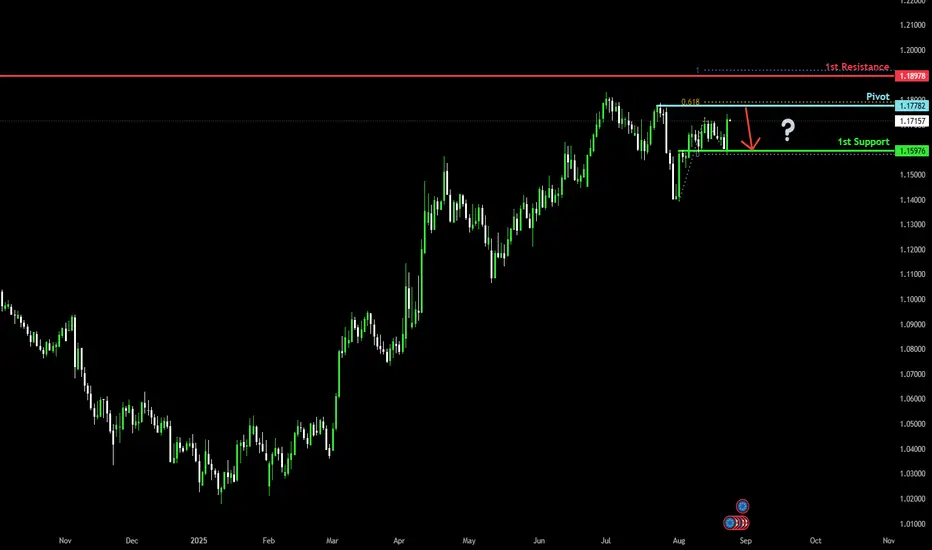
Bearish reversal off pullback resistance?The Fiber (EUR/USD) is rising towards the pivot, which acts as a pullback resistance and could reverse to the 1st support.
Pivot: 1.17782
1st Support: 1.1597
1st Resistance: 1.1897
Risk Warning:
Trading Forex and CFDs carries a high level of risk to your capital and you should only trade with money you can afford to lose. Trading Forex and CFDs may not be suitable for all investors, so please ensure that you fully understand the risks involved and seek independent advice if necessary.
Disclaimer:
The above opinions given constitute general market commentary, and do not constitute the opinion or advice of IC Markets or any form of personal or investment advice.
Any opinions, news, research, analyses, prices, other information, or links to third-party sites contained on this website are provided on an "as-is" basis, are intended only to be informative, is not an advice nor a recommendation, nor research, or a record of our trading prices, or an offer of, or solicitation for a transaction in any financial instrument and thus should not be treated as such. The information provided does not involve any specific investment objectives, financial situation and needs of any specific person who may receive it. Please be aware, that past performance is not a reliable indicator of future performance and/or results. Past Performance or Forward-looking scenarios based upon the reasonable beliefs of the third-party provider are not a guarantee of future performance. Actual results may differ materially from those anticipated in forward-looking or past performance statements. IC Markets makes no representation or warranty and assumes no liability as to the accuracy or completeness of the information provided, nor any loss arising from any investment based on a recommendation, forecast or any information supplied by any third-party.
EUR (Euro)
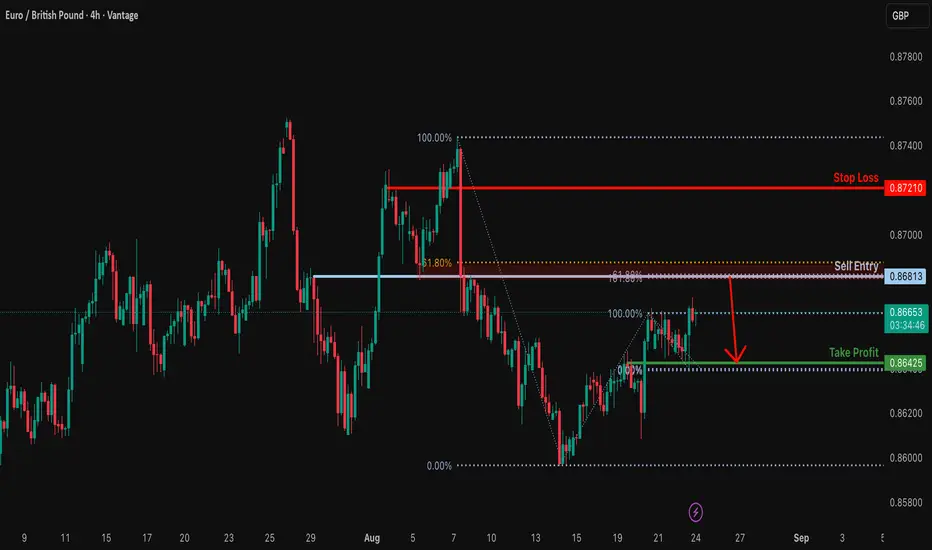
Rising towards Fibonacci confluence?EUR/GBP is rising towards the resistance level, which is an overlap resistance that lines up with the 161.8% Fibonacci extension, 61.8% Fibonacci projection and also slightly below the 61.8% Fibonacci retracement and could reverse from this level to our take profit.
Entry: 0.8681
Why we like it:
There is an overlap resistance that lines up with the 161.8% Fibonacci extension, 61.8% Fibonacci projection and slightly below the 61.8% Fibonacci retracement.
Stop loss: 0.8721
Why we like it:
There is a pullback resistance.
Take profit: 0.8642
Why we like it:
There is a pullback support level.
Enjoying your TradingView experience? Review us!
Please be advised that the information presented on TradingView is provided to Vantage (‘Vantage Global Limited’, ‘we’) by a third-party provider (‘Everest Fortune Group’). Please be reminded that you are solely responsible for the trading decisions on your account. There is a very high degree of risk involved in trading. Any information and/or content is intended entirely for research, educational and informational purposes only and does not constitute investment or consultation advice or investment strategy. The information is not tailored to the investment needs of any specific person and therefore does not involve a consideration of any of the investment objectives, financial situation or needs of any viewer that may receive it. Kindly also note that past performance is not a reliable indicator of future results. Actual results may differ materially from those anticipated in forward-looking or past performance statements. We assume no liability as to the accuracy or completeness of any of the information and/or content provided herein and the Company cannot be held responsible for any omission, mistake nor for any loss or damage including without limitation to any loss of profit which may arise from reliance on any information supplied by Everest Fortune Group.
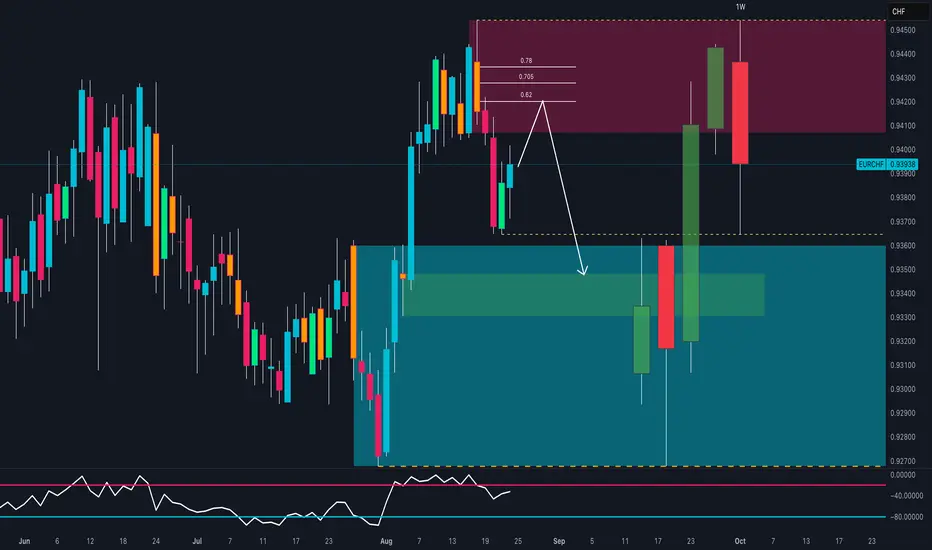
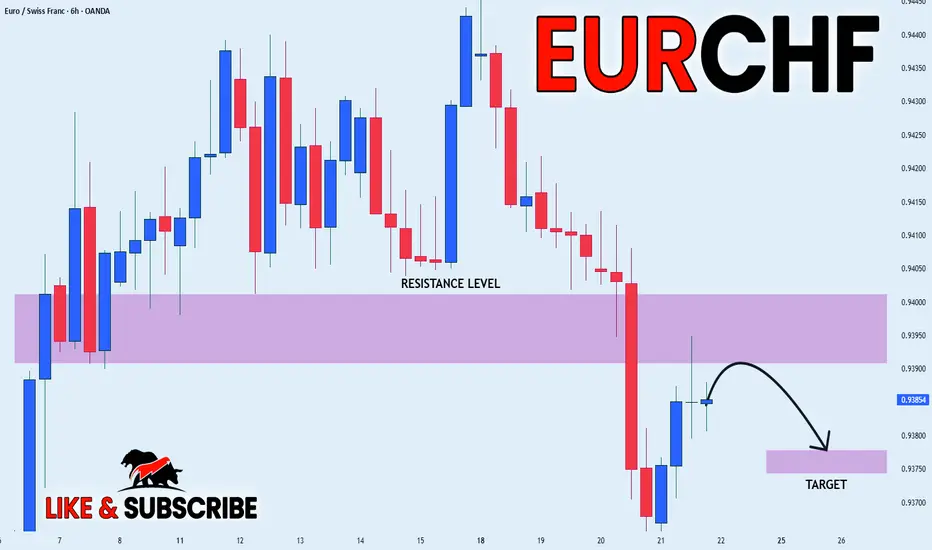
EUR/CHF: The Trap Is Set!EUR/CHF Full Analysis
1. Seasonality
EUR: Historically weak in August–September. The 20y and 15y datasets confirm a negative seasonal bias in September.
CHF: Stronger tendency in August–September, historically supported as a safe-haven currency, with September statistically positive.
👉 Seasonal bias: short EUR/CHF (weak EUR vs strong CHF).
2. Retail Sentiment
55% of retail traders are long EUR/CHF, while 45% are short.
👉 Slight long retail positioning = contrarian bearish signal.
3. COT Report (19 August 2025)
Euro: Non-commercial net long at 252k vs 133k short (+6.4k new longs, +3.1k new shorts). Still bullish momentum, but slowing down as commercials are selling.
CHF: Non-commercial net short (6k longs vs 33k shorts). Strong bearish imbalance, but commercials are long CHF (hedging), reinforcing CHF’s safe-haven status in case of risk-off correction.
👉 COT shows overweight Euro longs and heavy CHF shorts, raising risk of a future reversal in favor of CHF.
4. Technicals
Structure: Clear rejection from weekly supply zone 0.9435–0.9450 with a bearish engulfing.
Daily RSI cooling after strong impulse → room for further downside.
Possible pullback toward 0.9415–0.9425 (Fib 0.62–0.705) before continuation lower.
Technical targets: 0.9330–0.9315 (daily demand zone), extended to 0.9260.
Invalidation: Weekly close above 0.9450.
📌 Conclusion:
Seasonality, retail sentiment, and price action align for a bearish EUR/CHF bias. The COT highlights an overcrowded long Euro vs short CHF positioning, opening space for a structural rebound of the Swiss Franc. Technicals confirm: wait for a pullback to 0.9420 to short, targeting 0.9330/0.9260.
EURUSD Breakout and Potential RetraceHey Traders, in the coming week we are monitoring EURUSD for a buying opportunity around 1.17000 zone, EURUSD was trading in a downtrend and successfully managed to break it out. Currently is in a correction phase in which it is approaching the retrace area at 1.17000 support and resistance area.
Trade safe, Joe.

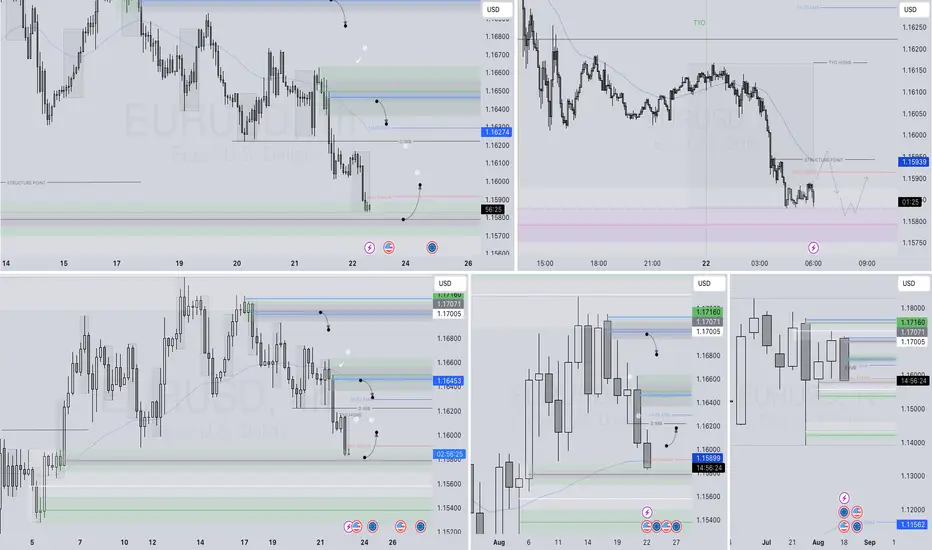
EURUSD – DAILY FORECAST Q3 | W34 | D22 | Y25📊 EURUSD – DAILY FORECAST
Q3 | W34 | D22 | Y25
Daily Forecast 🔍📅
Here’s a short diagnosis of the current chart setup 🧠📈
Higher time frame order blocks have been identified — these are our patient points of interest 🎯🧭.
It’s crucial to wait for a confirmed break of structure 🧱✅ before forming a directional bias.
This keeps us disciplined and aligned with what price action is truly telling us.
📈 Risk Management Protocols
🔑 Core principles:
Max 1% risk per trade
Only execute at pre-identified levels
Use alerts, not emotion
Stick to your RR plan — minimum 1:2
🧠 You’re not paid for how many trades you take, you’re paid for how well you manage risk.
🧠 Weekly FRGNT Insight
"Trade what the market gives, not what your ego wants."
Stay mechanical. Stay focused. Let the probabilities work.
FX:EURUSD
Where is EURUSD heading to ?EURUSD has significantly moved up since 1st August and is rejected at the trend line started from 01st Jul. It is decisively situated in a range as per the trend lines. Based on the current indicators, there are two diferent negative divergences indicated by both RSI and MACD. Strength of the current move is weak as per ADX indicator. But due to Trump and Putin meet planned on Friday and it can move in any direction based on outcome. So be prepared for the volatality accordingly and trade cautiously.

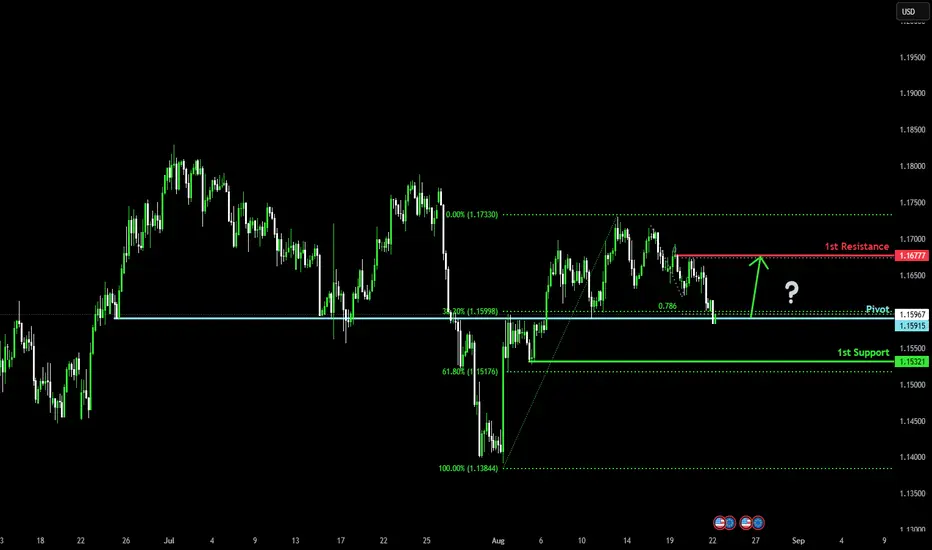
Bullish reversal?The Fiber (EUR/USD) is reacting off the pivot, which acts as an overlap support and could bounce to the 1st reistance.
Pivot: 1.1591
1st Support: 1.1532
1st Resistance: 1.1677
Risk Warning:
Trading Forex and CFDs carries a high level of risk to your capital and you should only trade with money you can afford to lose. Trading Forex and CFDs may not be suitable for all investors, so please ensure that you fully understand the risks involved and seek independent advice if necessary.
Disclaimer:
The above opinions given constitute general market commentary, and do not constitute the opinion or advice of IC Markets or any form of personal or investment advice.
Any opinions, news, research, analyses, prices, other information, or links to third-party sites contained on this website are provided on an "as-is" basis, are intended only to be informative, is not an advice nor a recommendation, nor research, or a record of our trading prices, or an offer of, or solicitation for a transaction in any financial instrument and thus should not be treated as such. The information provided does not involve any specific investment objectives, financial situation and needs of any specific person who may receive it. Please be aware, that past performance is not a reliable indicator of future performance and/or results. Past Performance or Forward-looking scenarios based upon the reasonable beliefs of the third-party provider are not a guarantee of future performance. Actual results may differ materially from those anticipated in forward-looking or past performance statements. IC Markets makes no representation or warranty and assumes no liability as to the accuracy or completeness of the information provided, nor any loss arising from any investment based on a recommendation, forecast or any information supplied by any third-party.
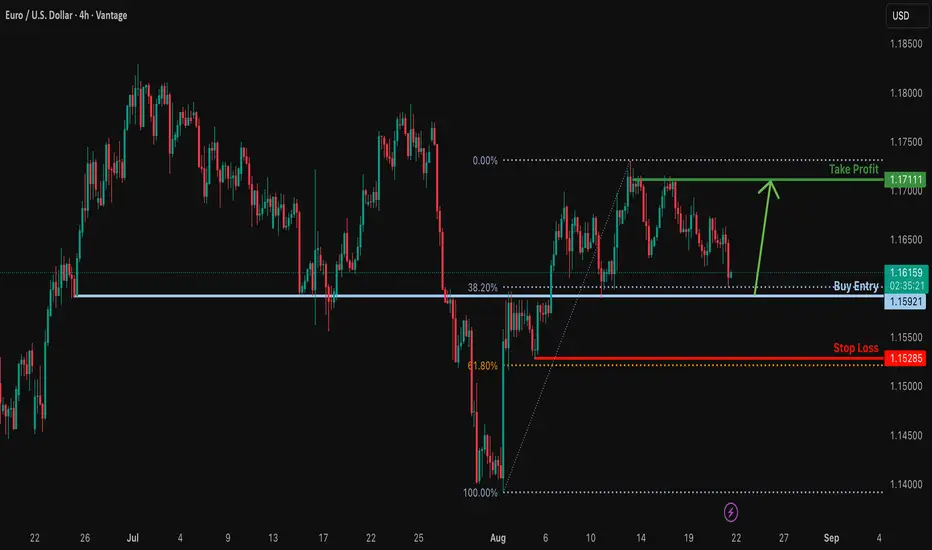
Could the Fiber bounce from here?The price is falling towards the support level, which is an overlap support that aligns with the 38.2% Fibonacci retracement and could bounce from this level to our take-profit.
Entry: 1.1592
Why we like it:
There is an overlap support level that lines up with the 38.2% Fibonacci retracement.
Stop loss: 1.1528
Why we like it:
There is a pullback support that aligns with the 61.8% Fibonacci retracement.
Take profit: 1.1711
Why we like it:
There is a multi-swing high resistance.
Enjoying your TradingView experience? Review us!
Please be advised that the information presented on TradingView is provided to Vantage (‘Vantage Global Limited’, ‘we’) by a third-party provider (‘Everest Fortune Group’). Please be reminded that you are solely responsible for the trading decisions on your account. There is a very high degree of risk involved in trading. Any information and/or content is intended entirely for research, educational and informational purposes only and does not constitute investment or consultation advice or investment strategy. The information is not tailored to the investment needs of any specific person and therefore does not involve a consideration of any of the investment objectives, financial situation or needs of any viewer that may receive it. Kindly also note that past performance is not a reliable indicator of future results. Actual results may differ materially from those anticipated in forward-looking or past performance statements. We assume no liability as to the accuracy or completeness of any of the information and/or content provided herein and the Company cannot be held responsible for any omission, mistake nor for any loss or damage including without limitation to any loss of profit which may arise from reliance on any information supplied by Everest Fortune Group.
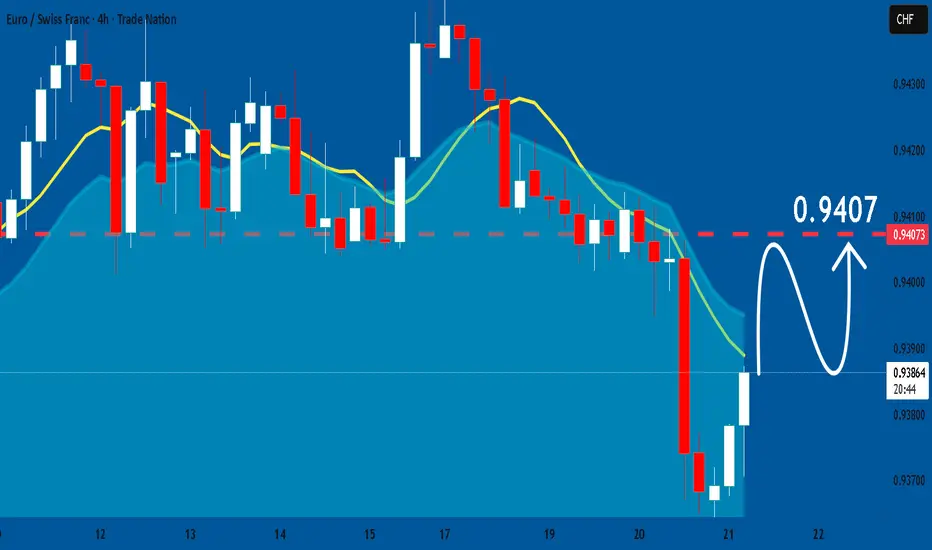
EUR_CHF LOCAL SHORT|
✅EUR_CHF made a retest of the
Strong horizontal resistance level of 0.9395
And as you can see the pair is already
Making a local pullback from
The level which sends a clear
Bearish signal to us therefore
We will be expecting a
Further bearish correction
SHORT🔥
✅Like and subscribe to never miss a new idea!✅
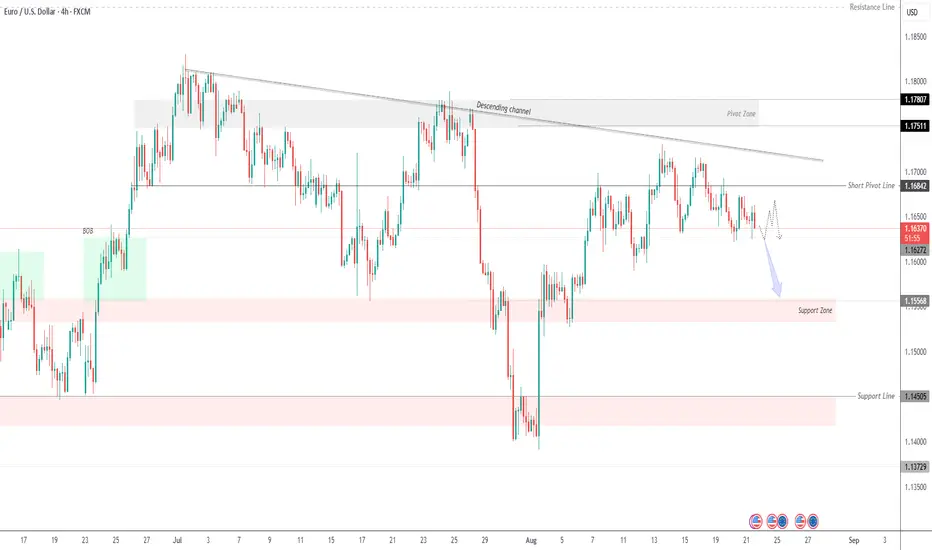
EURUSD Update | Descending Channel Keeps Pressure on EuroEURUSD – Technical Outlook
The pair continues to trade within a descending channel, showing persistent bearish pressure. Price is currently around 1.1638, sitting below the short pivot line at 1.1684.
Bearish Scenario
As long as price trades below 1.1684, momentum favors the downside.
A confirmed break below 1.1627 would strengthen bearish pressure, with the next target at the support zone near 1.1556.
A deeper decline could extend toward 1.1450 if the support zone gives way.
Bullish Scenario
A sustained move above 1.1684 would challenge the pivot zone at 1.1751 – 1.1780.
A breakout of the descending channel would then be needed to confirm a shift toward bullish momentum.
📍 Key Levels
Resistance: 1.1684 – 1.1751 – 1.1780
Support: 1.1627 – 1.1556 – 1.1450 – 1.1372
⚠️ Bias remains bearish while below 1.1684. Watch for volatility around Fed and ECB signals as fundamental drivers.
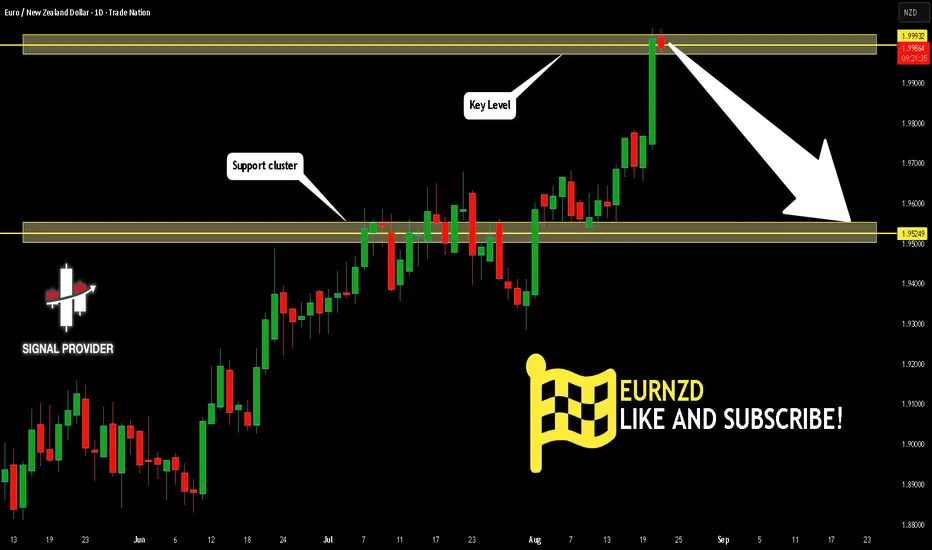
EURNZD Is Going Down! Short!
Please, check our technical outlook for EURNZD.
Time Frame: 1D
Current Trend: Bearish
Sentiment: Overbought (based on 7-period RSI)
Forecast: Bearish
The market is trading around a solid horizontal structure 1.999.
The above observations make me that the market will inevitably achieve 1.952 level.
P.S
Please, note that an oversold/overbought condition can last for a long time, and therefore being oversold/overbought doesn't mean a price rally will come soon, or at all.
Disclosure: I am part of Trade Nation's Influencer program and receive a monthly fee for using their TradingView charts in my analysis.
Like and subscribe and comment my ideas if you enjoy them!
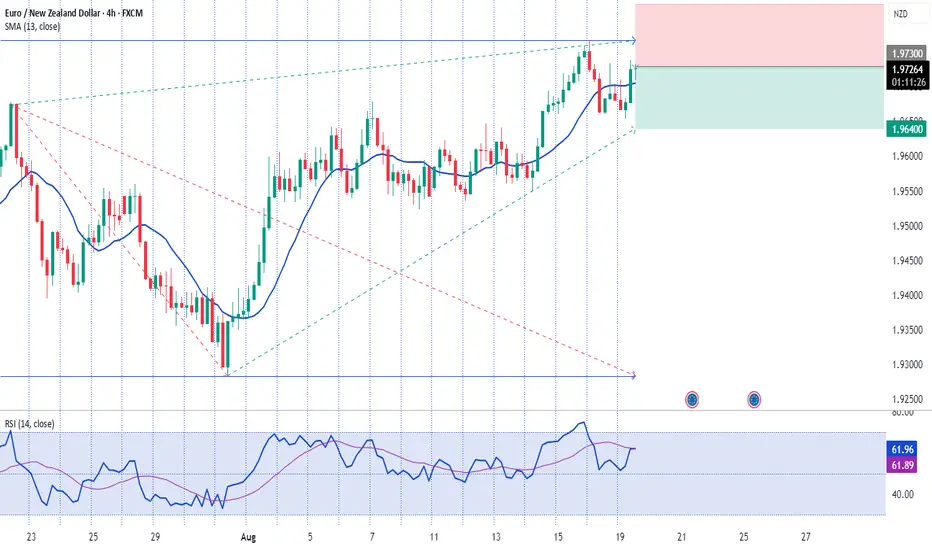
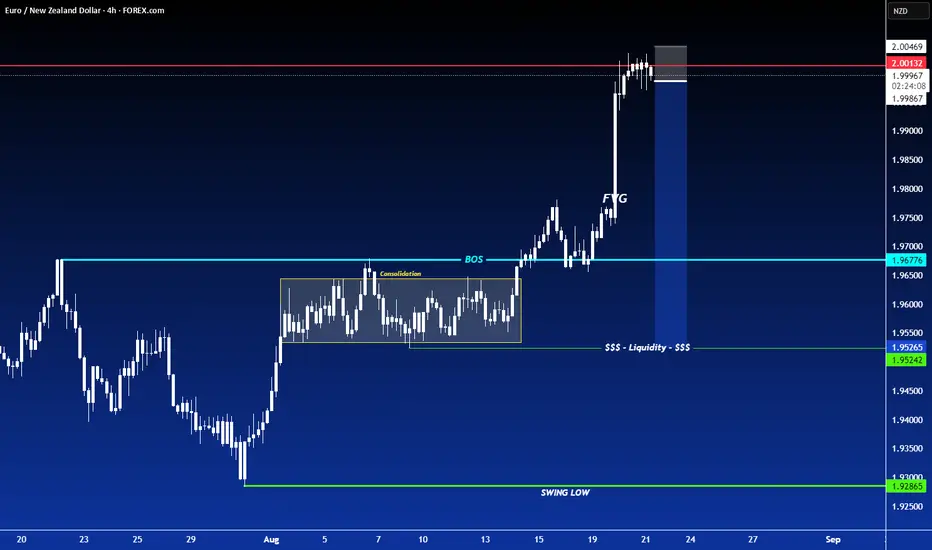
SHORT ON EUR/NZDEUR/NZD has taken out a previous swing high and has started to consolidate.
There is plenty of liquidity to be collected to the downside.
I will be selling EUR/NZD to the next demand level looking to catch 300-400 pips.
Quick Forex update. Waiting for the Powell speech.Let's have a quick technical look at the top FX pairs before the Jackson Hole Symposium. Let's dig in.
TVC:DXY
FX_IDC:AUDUSD
FX_IDC:NZDUSD
FX_IDC:USDJPY
FX_IDC:USDCAD
Let us know what you think in the comments below.
Thank you.
75.2% of retail investor accounts lose money when trading CFDs with this provider. You should consider whether you understand how CFDs work and whether you can afford to take the high risk of losing your money. Past performance is not necessarily indicative of future results. The value of investments may fall as well as rise and the investor may not get back the amount initially invested. This content is not intended for nor applicable to residents of the UK. Cryptocurrency CFDs and spread bets are restricted in the UK for all retail clients.

EURCHF: Bullish Forecast & Bullish Scenario
Our strategy, polished by years of trial and error has helped us identify what seems to be a great trading opportunity and we are here to share it with you as the time is ripe for us to buy EURCHF.
Disclosure: I am part of Trade Nation's Influencer program and receive a monthly fee for using their TradingView charts in my analysis.
❤️ Please, support our work with like & comment! ❤️
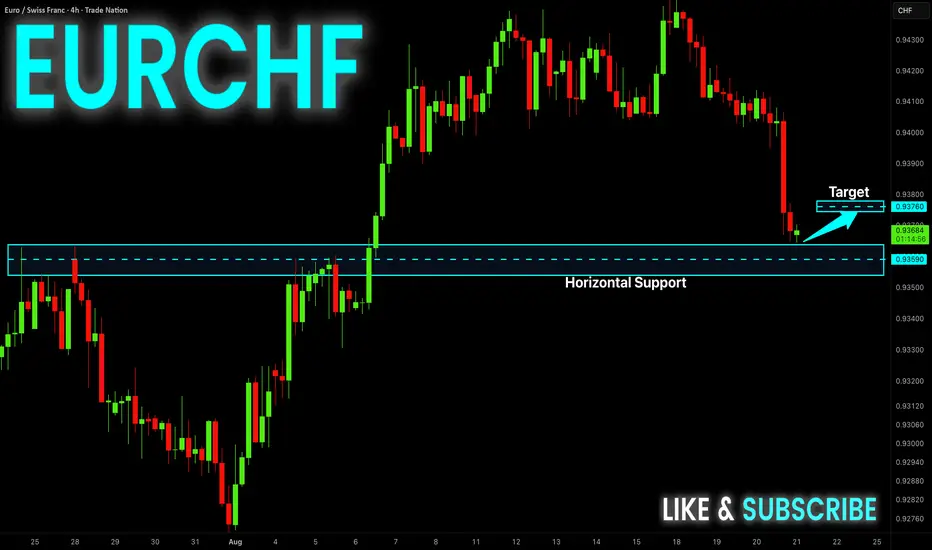
EUR-CHF Long From Support! Buy!
Hello,Traders!
EUR-CHF made a strong
Bearish correction and is
Locally oversold so as it is
About to retest the horizontal
Support of 0.9363
We will be expecting a
Local bullish rebound
Buy!
Comment and subscribe to help us grow!
Check out other forecasts below too!
Disclosure: I am part of Trade Nation's Influencer program and receive a monthly fee for using their TradingView charts in my analysis.
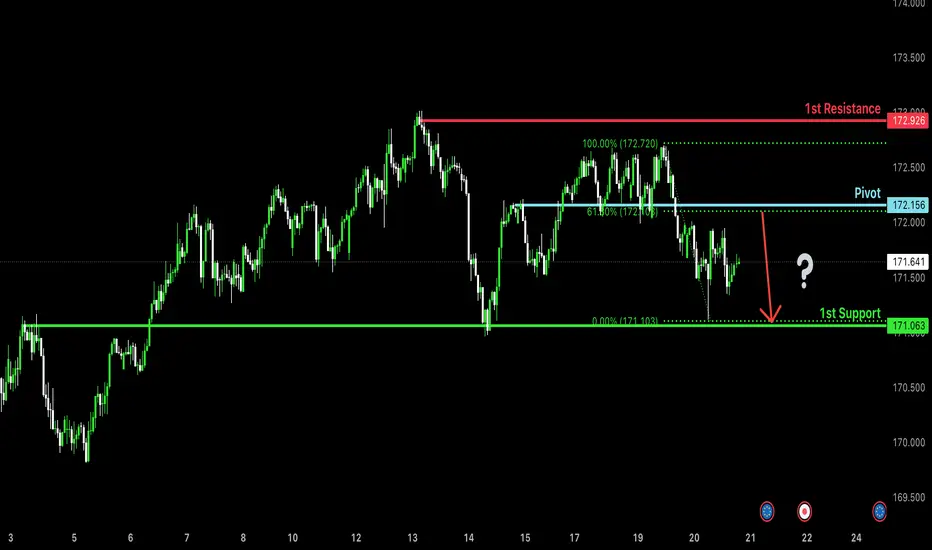
Bearish reversal off overlap resistance?EUR/JPY is rising towards the pivot, which is an overlap resistance, and could reverse to the 1st support, which acts as an overlap support.
Pivot: 172.15
1st Support: 171.06
1st Resistance: 172.92
Risk Warning:
Trading Forex and CFDs carries a high level of risk to your capital and you should only trade with money you can afford to lose. Trading Forex and CFDs may not be suitable for all investors, so please ensure that you fully understand the risks involved and seek independent advice if necessary.
Disclaimer:
The above opinions given constitute general market commentary, and do not constitute the opinion or advice of IC Markets or any form of personal or investment advice.
Any opinions, news, research, analyses, prices, other information, or links to third-party sites contained on this website are provided on an "as-is" basis, are intended only to be informative, is not an advice nor a recommendation, nor research, or a record of our trading prices, or an offer of, or solicitation for a transaction in any financial instrument and thus should not be treated as such. The information provided does not involve any specific investment objectives, financial situation and needs of any specific person who may receive it. Please be aware, that past performance is not a reliable indicator of future performance and/or results. Past Performance or Forward-looking scenarios based upon the reasonable beliefs of the third-party provider are not a guarantee of future performance. Actual results may differ materially from those anticipated in forward-looking or past performance statements. IC Markets makes no representation or warranty and assumes no liability as to the accuracy or completeness of the information provided, nor any loss arising from any investment based on a recommendation, forecast or any information supplied by any third-party.
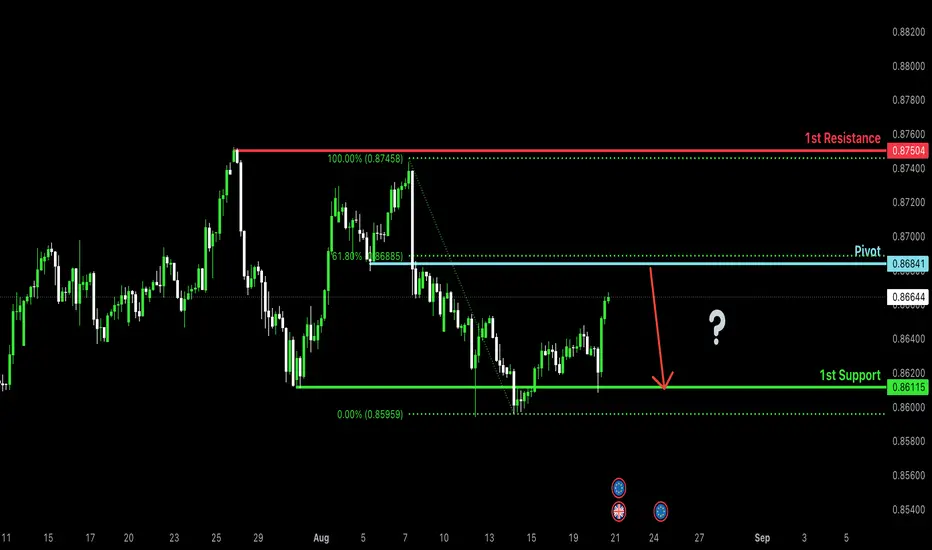
Bearish reversal off 61.8% Fibonacci resistance?EUR/GBP is rising towards the pivot, which acts as a pullback resistance that lines up with the 61.8% Fibonacci retracement and could reverse to the 1st support.
Pivot: 0.8684
1st Support: 0.8611
1st Resistance: 0.8750
Risk Warning:
Trading Forex and CFDs carries a high level of risk to your capital and you should only trade with money you can afford to lose. Trading Forex and CFDs may not be suitable for all investors, so please ensure that you fully understand the risks involved and seek independent advice if necessary.
Disclaimer:
The above opinions given constitute general market commentary, and do not constitute the opinion or advice of IC Markets or any form of personal or investment advice.
Any opinions, news, research, analyses, prices, other information, or links to third-party sites contained on this website are provided on an "as-is" basis, are intended only to be informative, is not an advice nor a recommendation, nor research, or a record of our trading prices, or an offer of, or solicitation for a transaction in any financial instrument and thus should not be treated as such. The information provided does not involve any specific investment objectives, financial situation and needs of any specific person who may receive it. Please be aware, that past performance is not a reliable indicator of future performance and/or results. Past Performance or Forward-looking scenarios based upon the reasonable beliefs of the third-party provider are not a guarantee of future performance. Actual results may differ materially from those anticipated in forward-looking or past performance statements. IC Markets makes no representation or warranty and assumes no liability as to the accuracy or completeness of the information provided, nor any loss arising from any investment based on a recommendation, forecast or any information supplied by any third-party.
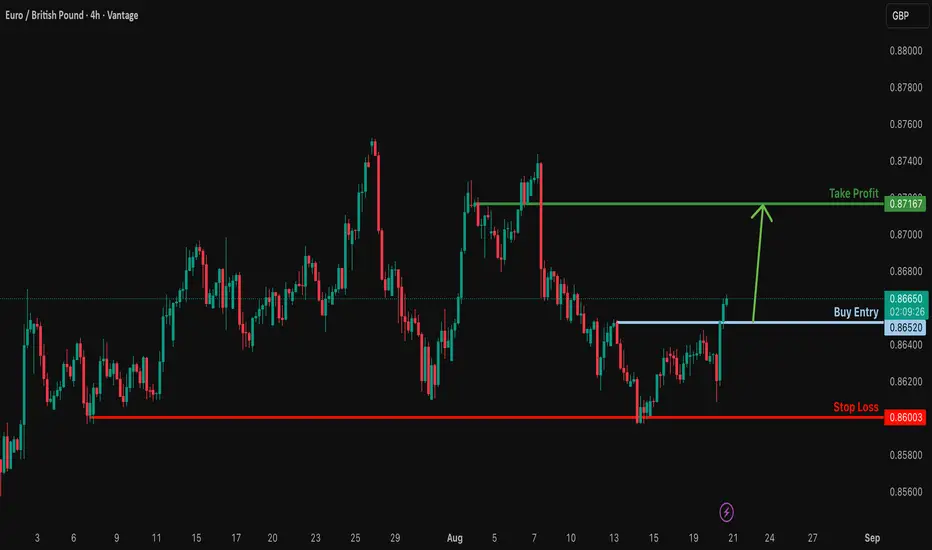
Bullish bounce off?EUR/GBP is falling towards the support level which is a pullback support and could bounce from this level to our take profit.
Entry: 0.8652
Why we like it:
There is a pullback support level.
Stop loss: 0.8600
Why we lilk eit:
There is a multi swing low support.
Take profit: 0.8716
Why we like it:
There is a pullback resistance level.
Enjoying your TradingView experience? Review us!
Please be advised that the information presented on TradingView is provided to Vantage (‘Vantage Global Limited’, ‘we’) by a third-party provider (‘Everest Fortune Group’). Please be reminded that you are solely responsible for the trading decisions on your account. There is a very high degree of risk involved in trading. Any information and/or content is intended entirely for research, educational and informational purposes only and does not constitute investment or consultation advice or investment strategy. The information is not tailored to the investment needs of any specific person and therefore does not involve a consideration of any of the investment objectives, financial situation or needs of any viewer that may receive it. Kindly also note that past performance is not a reliable indicator of future results. Actual results may differ materially from those anticipated in forward-looking or past performance statements. We assume no liability as to the accuracy or completeness of any of the information and/or content provided herein and the Company cannot be held responsible for any omission, mistake nor for any loss or damage including without limitation to any loss of profit which may arise from reliance on any information supplied by Everest Fortune Group.
EURUSD is Nearing 1.17500 Important Resistance!!!Hey traders, in tomorrow's trading session we are monitoring EURUSD for a selling opportunity around 1.17500 zone, EURUSD is trading in a downtrend and currently is in a correction phase in which it is approaching the trend at 1.17500 support and resistance area.
Trade safe, Joe.

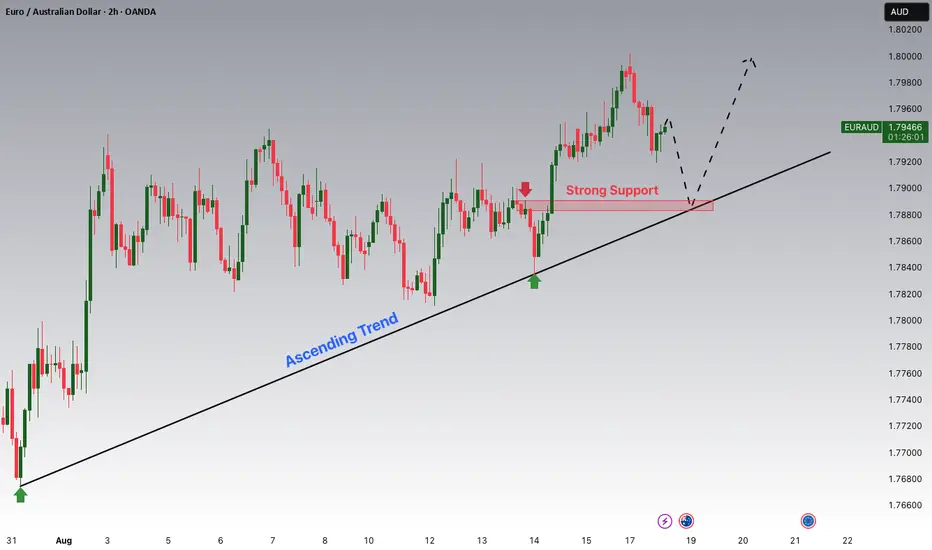
EURAUD is Nearing a Strong Support!!Hey Traders, in today's trading session we are monitoring EURAUD for a buying opportunity around 1.78900 zone, EURAUD is trading in an uptrend and currently is in a correction phase in which it is approaching the trend at 1.78900 support and resistance area.
Trade safe, Joe.
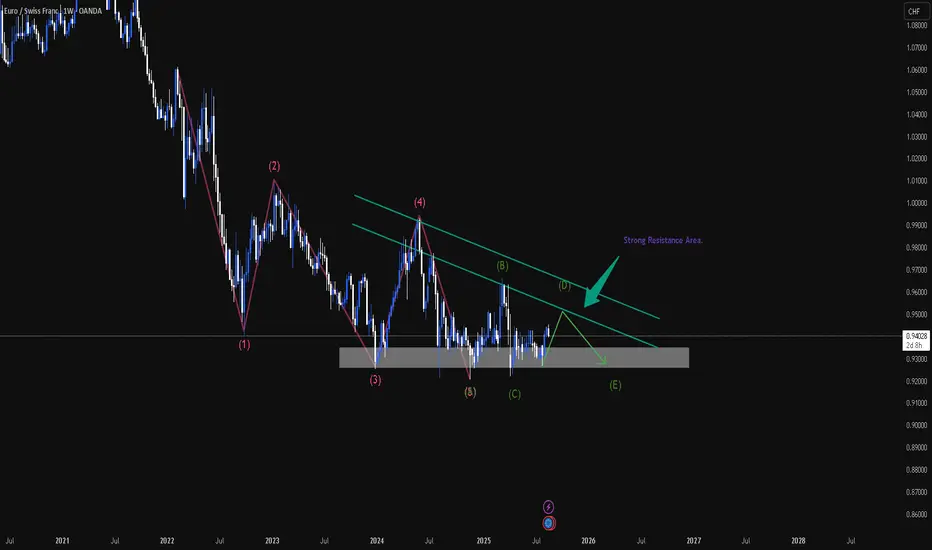
EURCHF - the little up & than down. Forming of Triangle.Right now, on market it is more predictable to be again bear movements!
The Elliot wave analysis shows as the price may go down again.
For them who is looking for entering sell, here we have two places for it.
First, it's when the price will touch resistance diagonal line. (Light-green colored).
The second place is after the price will enter that main resistance area.
Thx,
have a profitable day!
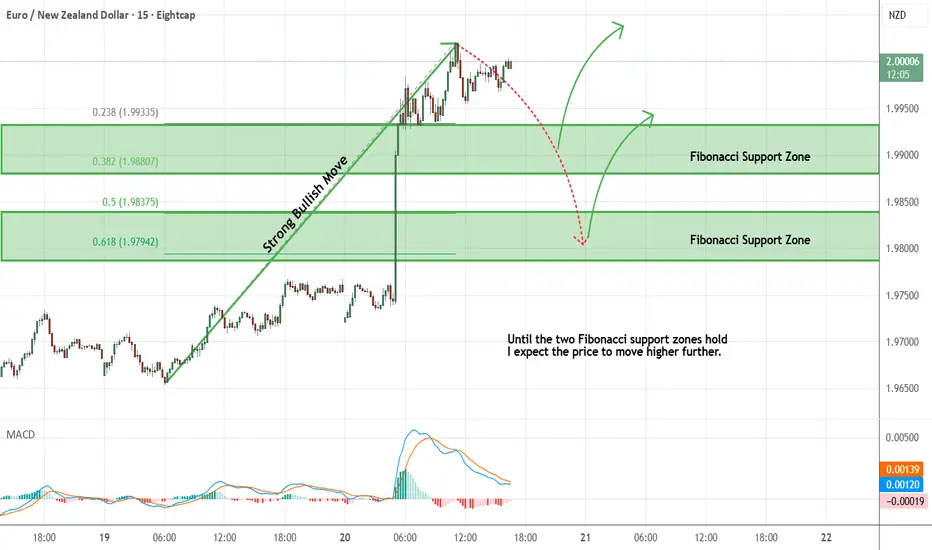
EURNZD - Expecting Bullish Continuation In The Short TermH1 - Strong bullish momentum.
No opposite signs.
Until the two Fibonacci support zones hold I expect the price to move higher further.
If you enjoy this idea, don’t forget to LIKE 👍, FOLLOW ✅, SHARE 🙌, and COMMENT ✍! Drop your thoughts and charts below to keep the discussion going. Your support helps keep this content free and reach more people! 🚀
--------------------------------------------------------------------------------------------------------------------