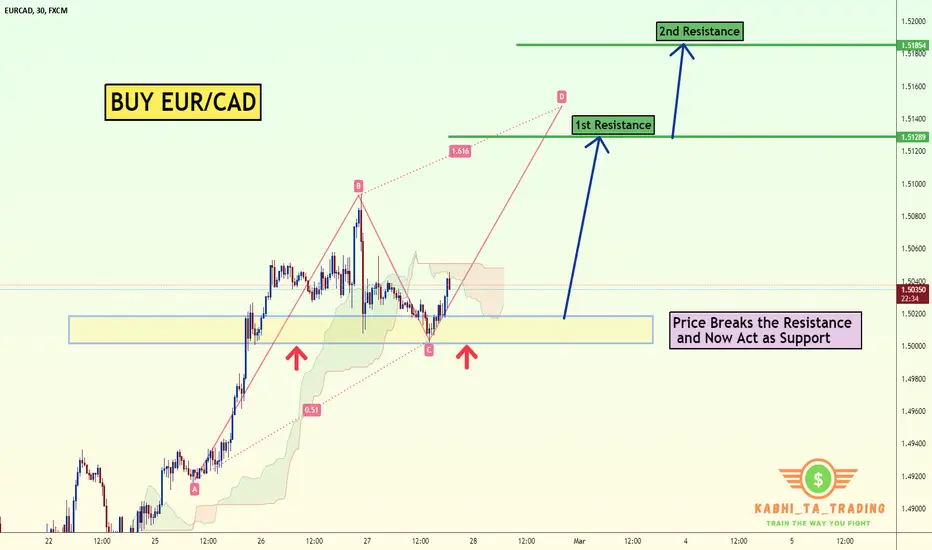
EUR/CAD Buy @ Support ZoneThe EUR/CAD pair on the M30 timeframe presents a Potential Buying Opportunity due to a recent Formation of a AB=CD Pattern. This suggests a shift in momentum towards the upside and a higher likelihood of further advances in the coming hours.
Possible Long Trade:
Entry: Consider Entering A Long Position around Trendline Of The Pattern.
Target Levels:
1st Resistance – 1.5128
2nd Resistance – 1.5185
🎁 Please hit the like button and
🎁 Leave a comment to support for My Post !
Your likes and comments are incredibly motivating and will encourage me to share more analysis with you.
Best Regards, KABHI_TA_TRADING
Thank you.
EUR (Euro)
EURNZD I More Rise and Short from Supply Welcome back! Let me know your thoughts in the comments!
** EURNZD Analysis - Listen to video!
We recommend that you keep this pair on your watchlist and enter when the entry criteria of your strategy is met.
Please support this idea with a LIKE and COMMENT if you find it useful and Click "Follow" on our profile if you'd like these trade ideas delivered straight to your email in the future.
Thanks for your continued support!Welcome back! Let me know your thoughts in the comments!

EURCAD - Nearing A Massive Resistance!Hello TradingView Family / Fellow Traders. This is Richard, also known as theSignalyst.
As per our last EURCAD analysis, it rejected our blue support zone and traded higher.
What's next?
📈EURCAD has been overall bullish, trading within the rising channel, however it is currently retesting the upper bound of the channel.
Moreover, the red zone is a strong resistance zone.
🏹 Thus, the highlighted red circle is a strong area to look for sell setups as it is the intersection of the resistance and upper blue trendline acting as a non-horizontal resistance.
📚 As per my trading style:
As #EURCAD approaches the red circle, I will be looking for bearish reversal setups (like a double top pattern, trendline break , and so on...)
📚 Always follow your trading plan regarding entry, risk management, and trade management.
Good luck!
All Strategies Are Good; If Managed Properly!
~Rich
Disclosure: I am part of Trade Nation's Influencer program and receive a monthly fee for using their TradingView charts in my analysis.
EURUSD 3-7 Mar 2025 W10 - Weekly Analysis- EU Rate - US NFP WeekThis is my Weekly analysis on EURUSD for 3-7 Mar 2025 W10 based on Smart Money Concept (SMC) which includes the following:
Market Sentiment
Weekly Chart Analysis
Daily Chart Analysis
4H Chart Analysis
Economic Events for the Week
Market Sentiment
The EUR/USD pair faces a slightly bearish bias this week, driven by key economic events, geopolitical risks, and trade uncertainties.
Key Events to Watch:
🔹 ECB Interest Rate Decision (March 6) – Markets expect a 25 bps rate cut to 2.50%. A dovish ECB could pressure the euro, while any hints of a pause may provide support.
🔹 U.S. Non-Farm Payrolls (March 7) – Forecast at +133K jobs, with unemployment steady at 4.0%. Weak data could weigh on the USD, while stronger payrolls and wage growth may boost it.
🔹 Trump’s Tariffs & Trade War Risks – New U.S. tariffs on Mexico, Canada, and China take effect March 4, with potential auto tariffs on Europe looming. These policies favor the dollar by driving risk-off sentiment.
🔹 Geopolitical Tensions – U.S.-Ukraine relations deteriorated after a public Oval Office clash between Trump and Zelenskiy. Further instability could impact investor confidence and increase safe-haven demand for the USD.
Trading Strategy:
✅ Bearish Scenario: A dovish ECB, strong U.S. NFP, and escalating trade risks could push EUR/USD down.
✅ Bullish Scenario: If the ECB signals a rate-cut pause and U.S. jobs data disappoint, EUR/USD may test 1.055–1.06 .
Overall, the fundamental backdrop leans in favor of the USD, but volatility is expected, especially around the ECB and NFP releases. Traders should stay alert to geopolitical developments and tariff announcements that may shift sentiment.
Weekly Chart Analysis
1️⃣
🔹Swing Bearish
🔹Internal Bearish (Pullback Phase)
🔹In Swing Discount
🔹Swing Continuation Phase (Pro Swing + Pro Internal)
2️⃣
🔹INT structure continuing bearish with iBOS following the Bearish Swing. (End of 2023 till end of 2024 was a pullback phase after the first bearish iBOS)
3️⃣
🔹After the bearish iBOS we expect a pullback, price tapped into Monthly Demand and the liquidity below Nov 2022 which is above the weekly demand formed with the initiation of the bearish iBOS pullback phase.
🔹Price made a bullish CHoCH which indicated that the liquidity was enough as per previous weeks analysis to initiate a pullback phase for the bearish iBOS.
🔹Price pulled back after the Bullish CHoCH to the Weekly Demand formed and showed reaction after volatile week.
🔹With the previous week Bearish close, weekly is consolidating between 1.05xx and 1.02xx
🔹Still the recent Bullish Fractal and Demand holding but failed to break the high (1.0533) so there is a probability to target the low 1.0285/10 and could extend to continue the Bearish INT Structure with iBOS.
Daily Chart Analysis
1️⃣
🔹Swing Bearish
🔹INT Bearish
🔹Swing Continuation Phase (Pro Swing + Pro Internal)
2️⃣
🔹Following the Bearish Swing BOS, INT Structure continuing bearish tapping the weekly demand zone.
3️⃣
🔹After the failure to close below the Weak INT Low, price continued bullish sweeping the liquidity above Dec 30 and mitigating a Daily supply zone within the INT Structure Premium Zone.
🔹With the mitigation of the Daily supply, price created a Bearish CHoCH signaling the end of the Pullback Phase of the INT structure and the start of the Bearish move targeting the Weak INT Low.
🔹Price failed for the 2nd time to close below the Weak INT Low after mitigating the Daily Demand formed from the failure to close below the Weak INT Low which triggered aggressive Bullish reaction and mitigating the Daily Supply Zone formed from the recent Bearish CHoCH.
🔹After Supply mitigation, price continued Bearish following the Bearish INT Structure continuation phase.
🔹With the Weekly is consolidating the Daily consolidation range showing that we are failing to continue Bullish and with the recent Bearish CHoCH we are back to the Bearish INT Structure continuation and we may target the Weak INT Low (At least 1.0285).
🔹Price could pullback to the recent Daily Supply before continuing down.
🔹Expectation is set to Bearish with cautious of the Liq. built above 1.05333 and the range we are in.
4H Chart Analysis
1️⃣
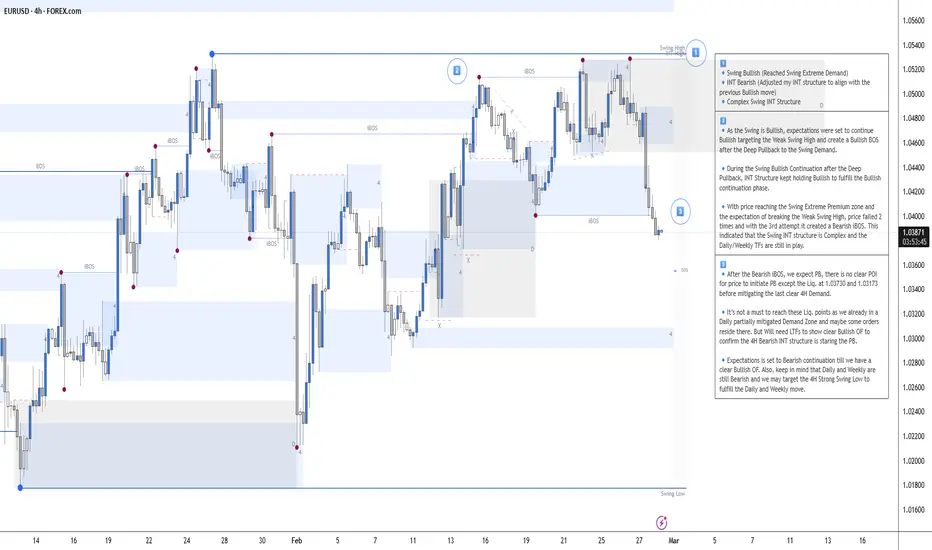
🔹Swing Bullish (Reached Swing Extreme Demand)
🔹INT Bearish (Adjusted my INT structure to align with the previous Bullish move)
🔹Complex Swing INT Structure
2️⃣
🔹As the Swing is Bullish, expectations were set to continue Bullish targeting the Weak Swing High and create a Bullish BOS after the Deep Pullback to the Swing Demand.
🔹During the Swing Bullish Continuation after the Deep Pullback, INT Structure kept holding Bullish to fulfill the Bullish continuation phase.
🔹With price reaching the Swing Extreme Premium zone and the expectation of breaking the Weak Swing High, price failed 2 times and with the 3rd attempt it created a Bearish iBOS. This indicated that the Swing INT structure is Complex and the Daily/Weekly TFs are still in play.
3️⃣
🔹After the Bearish iBOS, we expect PB, there is no clear POI for price to initiate PB except the Liq. at 1.03730 which was swept on Friday and 1.03173 before mitigating the last clear 4H Demand.
🔹With the recent Bearish iBOS, the PB could start at anytime. The Liq. swept from 1.0373 could provide that PB otherwise we will continue Bearish till the clear 4H Demand (Which I doubt that it could provide the continuation) but with LTF shifting Bullish, we can follow that.
Economic Events for the Week

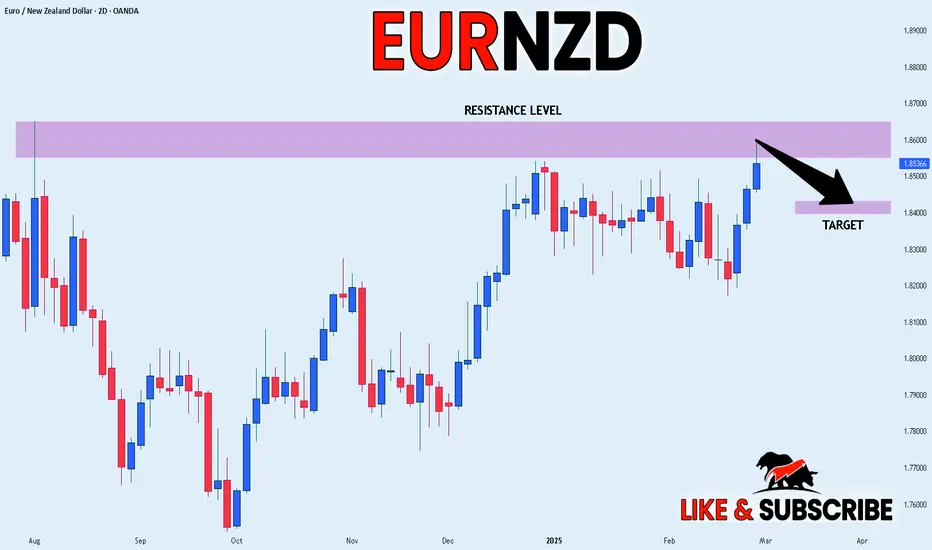
EUR_NZD SHORT FROM RESISTANCE|
✅EUR_NZD will soon retest a key resistance level of 1.8649
So I think that the pair will make a pullback
And go down to retest the demand level below
SHORT🔥
✅Like and subscribe to never miss a new idea!✅
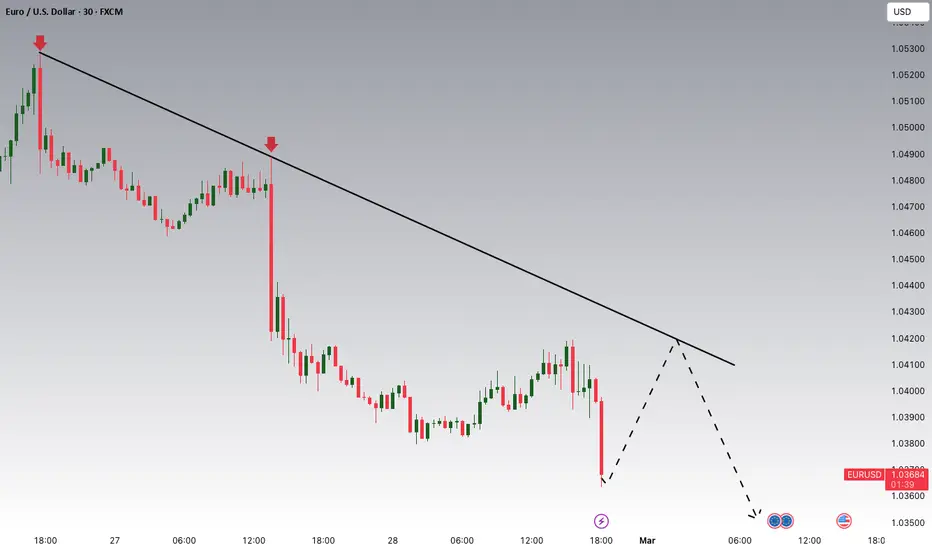
EURUSD Potential DownsidesHey Traders, in the coming week we are monitoring EURUSD for a selling opportunity around 1.04200 zone, EURUSD is trading in a downtrend and currently is in a correction phase in which it is approaching the trend at 1.04200 support and resistance area.
Trade safe, Joe.
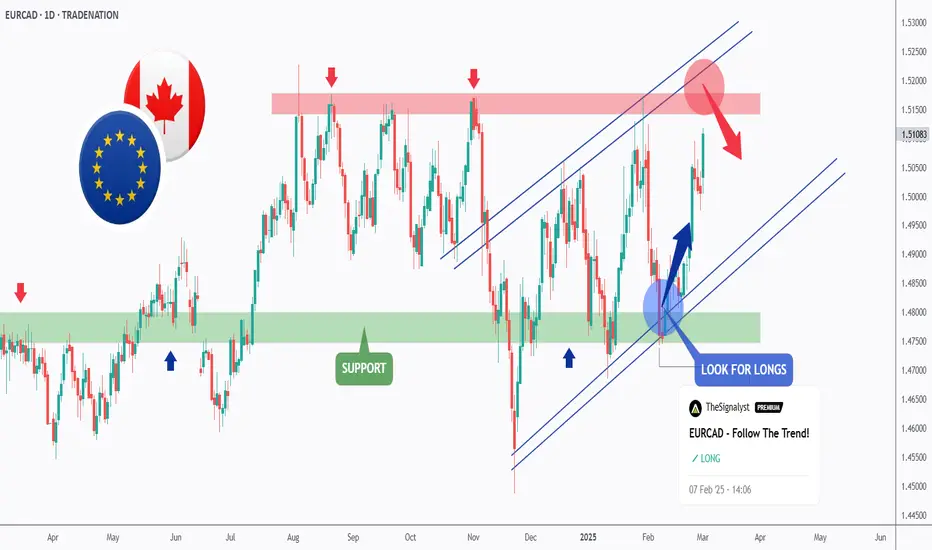
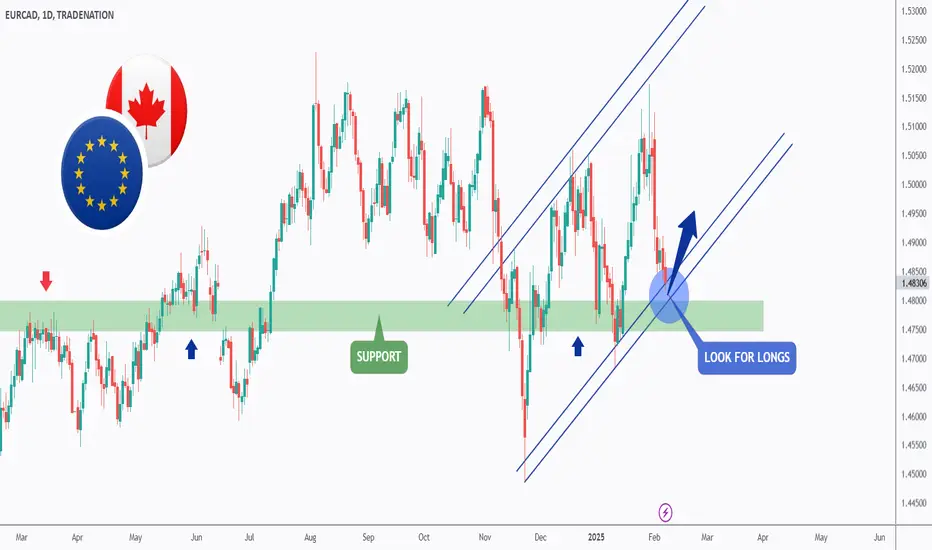
EURCAD - Follow The Trend!Hello TradingView Family / Fellow Traders. This is Richard, also known as theSignalyst.
📈EURCAD has been in a correction phase and it is currently approaching the lower bound of the blue channel.
Moreover, the green zone is a strong support zone.
🏹 Thus, the highlighted blue circle is a strong area to look for buy setups as it is the intersection of support and lower blue trendline acting as a non-horizontal support.
📚 As per my trading style:
As #EURCAD approaches the blue circle, I will be looking for bullish reversal setups (like a double bottom pattern, trendline break , and so on...)
📚 Always follow your trading plan regarding entry, risk management, and trade management.
Good luck!
All Strategies Are Good; If Managed Properly!
~Rich
Disclosure: I am part of Trade Nation's Influencer program and receive a monthly fee for using their TradingView charts in my analysis.
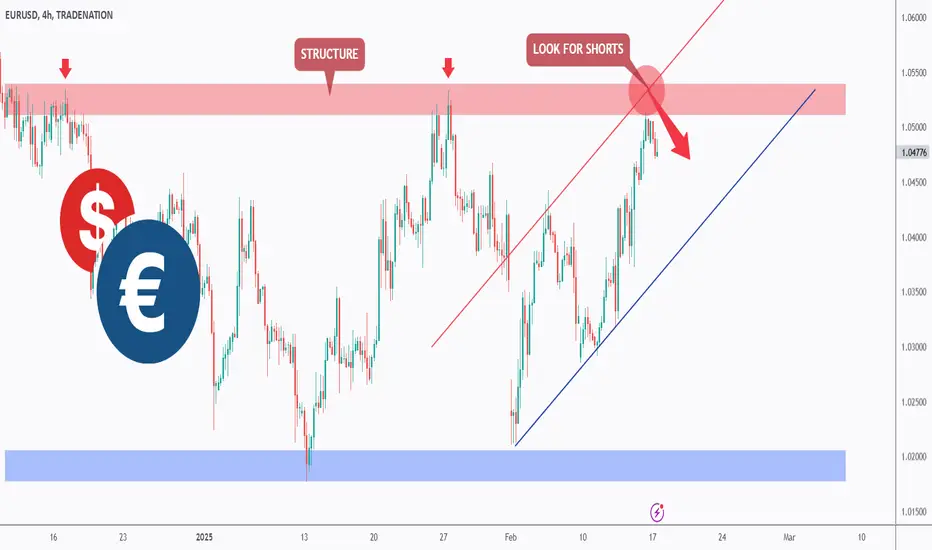
EURUSD - Bullish No More!Hello TradingView Family / Fellow Traders. This is Richard, also known as theSignalyst.
📈 EURUSD has been overall bullish, trading within the rising channel, however it is currently retesting the upper bound of the channel.
Moreover, the red zone is the upper bound of its weekly range.
🏹 Thus, the highlighted red circle is a strong area to look for sell setups as it is the intersection of the structure and upper red trendline acting as a non-horizontal resistance.
📚 As per my trading style:
As #EURUSD approaches the red circle, I will be looking for bearish reversal setups (like a double top pattern, trendline break , and so on...)
📚 Always follow your trading plan regarding entry, risk management, and trade management.
Good luck!
All Strategies Are Good; If Managed Properly!
~Rich
Disclosure: I am part of Trade Nation's Influencer program and receive a monthly fee for using their TradingView charts in my analysis.
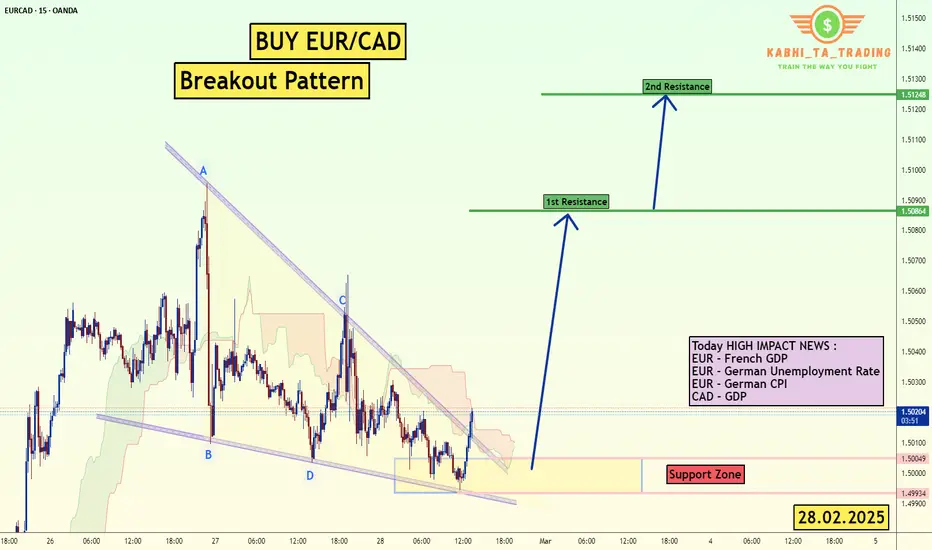
Buy EUR/CAD High Impact NewsThe EUR/CAD pair on the M15 timeframe presents a Potential Buying Opportunity due to a recent Formation of a Breakout Pattern. This suggests a shift in momentum towards the upside and a higher likelihood of further advances in the coming hours.
Possible Long Trade:
Entry: Consider Entering A Long Position around Trendline Of The Pattern.
Target Levels:
1st Resistance – 1.5086
2nd Resistance – 1.5124
🎁 Please hit the like button and
🎁 Leave a comment to support for My Post !
Your likes and comments are incredibly motivating and will encourage me to share more analysis with you.
Best Regards, KABHI_TA_TRADING
Thank you.
EURUSD 28 Feb 2025 W9 -Intraday Analysis- US PCE Day! EOM FlowsThis is my Intraday analysis on FOREXCOM:EURUSD for 28 Feb 2025 W9 based on Smart Money Concept (SMC) which includes the following:
Market Sentiment
4H Chart Analysis
15m Chart Analysis
Market Sentiment
Heavy economic news:
EU : German Prelim CPI m/m
US : the most awaited report Core PCE Price Index m/m - Personal Spending m/m - Chicago PMI
The market sentiment detailed as following:
Trump's Tariff Announcements:
President Trump's announcements regarding new and increased tariffs significantly impacted market sentiment. Uncertainty surrounding trade relations with various countries, including the European Union, Mexico, and Canada, created volatility.
These tariff announcements created fears of trade wars, which negatively impacted investor confidence.
Economic Data:
Reports of declining new home sales in the U.S. and concerns about overall economic health contributed to market unease.
Also, the release of various economic data points, and the anticipation of the PCE inflation data release, influenced market movement.
NVIDIA's Performance and AI Competition:
While NVIDIA beat earnings estimates, concerns about increased competition from Chinese AI companies, particularly DeepSeek, led to a significant drop in its stock price, impacting the broader tech sector.
Geopolitical Uncertainty:
Geopolitical factors, such as the removal of Chevron's oil license in Venezuela, contributed to fluctuations in commodity prices, particularly oil.
Bank of Japan governor Ueda's statements regarding the uncertainty of US policies also added to uncertainty.
Additional Factors:
Geopolitical Resolution: A sudden de-escalation in a prior crisis (e.g., eased tensions in a conflict zone) might have reduced safe-haven demand for gold, though this was secondary to dollar strength.
Technical Factors: End-of-month rebalancing or options expirations could have amplified downward moves.
The interplay of a hawkish Fed, a resilient dollar, and risk aversion triggered broad-based declines. The overarching theme was a recalibration of investor expectations around tighter monetary policy and its implications for global growth and asset valuations.
4H Chart Analysis
1️⃣
🔹Swing Bullish (Reached Swing Extreme Demand)
🔹INT Bearish (Adjusted my INT structure to align with the previous Bullish move)
🔹Complex Swing INT Structure
2️⃣
🔹As the Swing is Bullish, expectations were set to continue Bullish targeting the Weak Swing High and create a Bullish BOS after the Deep Pullback to the Swing Demand.
🔹During the Swing Bullish Continuation after the Deep Pullback, INT Structure kept holding Bullish to fulfill the Bullish continuation phase.
🔹With price reaching the Swing Extreme Premium zone and the expectation of breaking the Weak Swing High, price failed 2 times and with the 3rd attempt it created a Bearish iBOS. This indicated that the Swing INT structure is Complex and the Daily/Weekly TFs are still in play.
3️⃣
🔹After the Bearish iBOS, we expect PB, there is no clear POI for price to initiate PB except the Liq. at 1.03730 and 1.03173 before mitigating the last clear 4H Demand.
🔹It’s not a must to reach these Liq. points as we already in a Daily partially mitigated Demand Zone and maybe some orders reside there. But Will need LTFs to show clear Bullish OF to confirm the 4H Bearish INT structure is staring the PB.
🔹Expectations is set to Bearish continuation till we have a clear Bullish OF. Also, keep in mind that Daily and Weekly are still Bearish and we may target the 4H Strong Swing Low to fulfill the Daily and Weekly move.
15m Chart Analysis
1️⃣
🔹Swing Bearish
🔹INT Bearish
🔹Swing Pullback
2️⃣
🔹Swing structure turned Bearish with confirmed BOS. And after BOS we expect PB phase to start.
🔹We didn’t mitigate any HP POI/Liq. to initiate the Swing PB phase.
🔹Will need a clear INT Structure shift to Bullish with momentum in order to play the PB phase otherwise price will continue Bearish till the sweep of Liq. on the 4H TF at 1.03730 and 1.03173 before tapping the clear 4H Demand.
3️⃣
🔹Expectations is set to continue Bearish with cautious from the Swing PB phase that can start at any time.
🔹Also keep in mind the End of Month Flows and PCE report today.
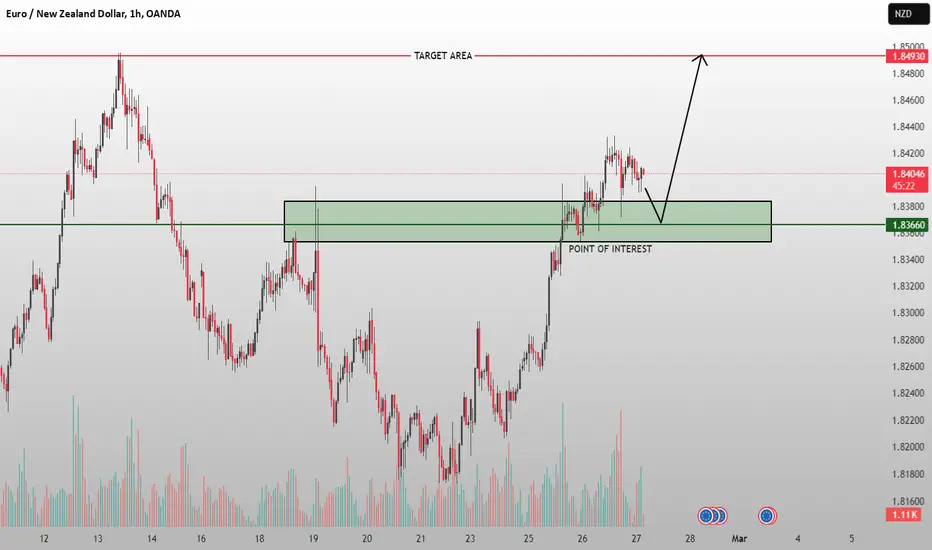
EUR/NZD Analysis: Bullish Continuation After Retracement?🔹EUR/NZD 1H Technical Analysis
▪️Market Structure & Trend:
The market is in a bullish structure, forming higher highs and higher lows. The recent price action suggests a potential pullback before continuing the uptrend.
▪️Key Levels
- Support (Point of Interest - POI): 1.83660
- Resistance (Target Area): 1.84930
- Current Price: 1.84052
▪️Price Action & Expected Movement:
- The price has reached a short-term resistance zone and is showing signs of consolidation.
- A retracement to the POI (1.83660) is likely before further upside movement.
- If buyers step in at this demand zone, a bullish continuation toward the 1.84930 target is expected.
▪️Trade Considerations
- Bullish Scenario: Look for confirmation of support at the 1.83660 zone before entering a long position.
- Bearish Scenario: A break below the POI could indicate further downside, invalidating the bullish bias.
▪️Conclusion:
The market remains bullish, but a short-term pullback to the 1.83660 support zone could offer an optimal buy opportunity for a move toward 1.84930. Traders should watch for bullish confirmation signals at the POI before entering a trade.
😊Don't Forget To Hit The Like Button & Share Your Thoughts In Comments.
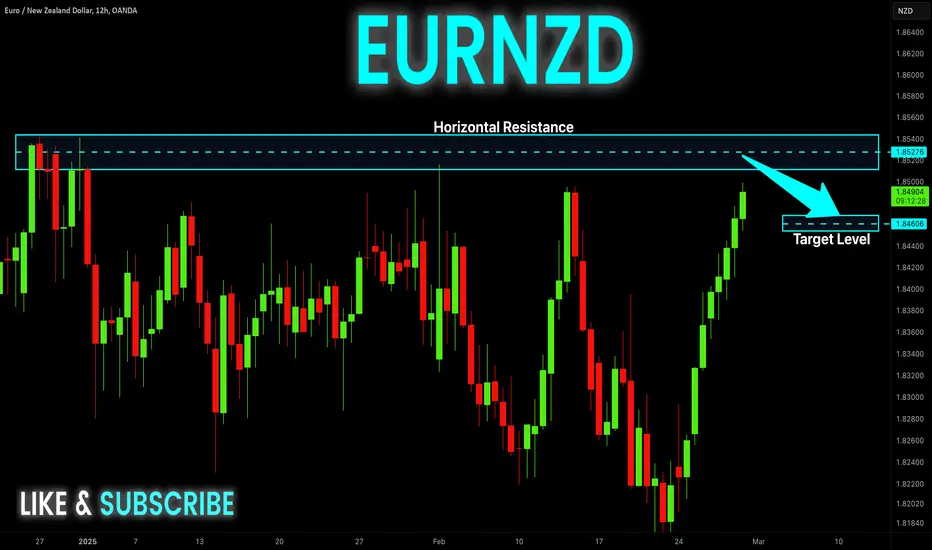
EUR-NZD Short From Resistance! Sell!
Hello,Traders!
EUR-NZD keeps going up
Just as I predicted but will
Soon hit a horizontal resistance
Of 1.8544 from where we will
Be expecting a local bearish
Correction and a move down
Sell!
Comment and subscribe to help us grow!
Check out other forecasts below too!
Bullish bounce off 61.8% Fibonacci support?The Fiber (EUR/USD) is falling towards the pivot and could bounce to the 1st resistance.
Pivot: 1.0373
1st Support: 1.0325
1st Resistance: 1.0464
Risk Warning:
Trading Forex and CFDs carries a high level of risk to your capital and you should only trade with money you can afford to lose. Trading Forex and CFDs may not be suitable for all investors, so please ensure that you fully understand the risks involved and seek independent advice if necessary.
Disclaimer:
The above opinions given constitute general market commentary, and do not constitute the opinion or advice of IC Markets or any form of personal or investment advice.
Any opinions, news, research, analyses, prices, other information, or links to third-party sites contained on this website are provided on an "as-is" basis, are intended only to be informative, is not an advice nor a recommendation, nor research, or a record of our trading prices, or an offer of, or solicitation for a transaction in any financial instrument and thus should not be treated as such. The information provided does not involve any specific investment objectives, financial situation and needs of any specific person who may receive it. Please be aware, that past performance is not a reliable indicator of future performance and/or results. Past Performance or Forward-looking scenarios based upon the reasonable beliefs of the third-party provider are not a guarantee of future performance. Actual results may differ materially from those anticipated in forward-looking or past performance statements. IC Markets makes no representation or warranty and assumes no liability as to the accuracy or completeness of the information provided, nor any loss arising from any investment based on a recommendation, forecast or any information supplied by any third-party.

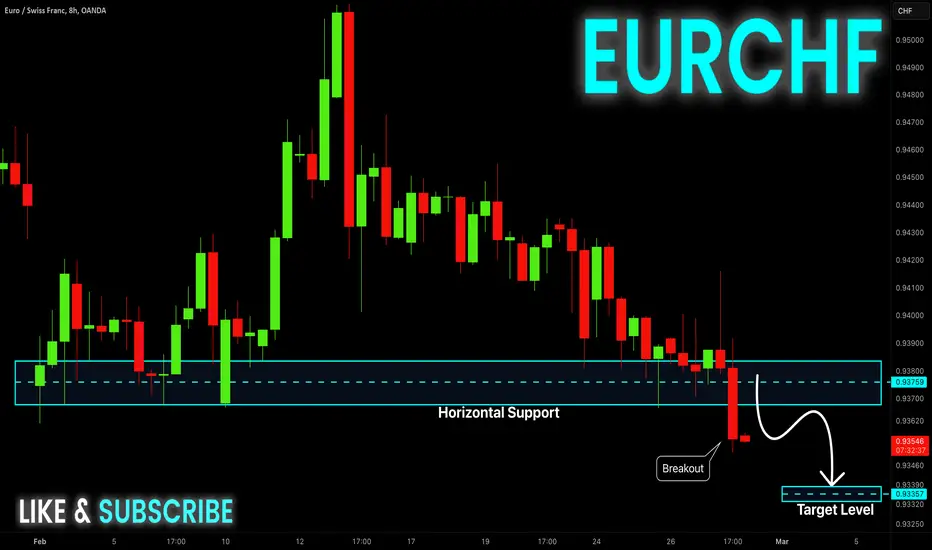
EUR-CHF Bearish Breakout! Sell!
Hello,Traders!
EUR-CHF is going down
And the pair made a bearish
Breakout of the key horizontal
Level of 0.9370 and the
Breakout is confirmed so we
Are bearish biased and we
Will be expecting a further
Bearish move down
Sell!
Comment and subscribe to help us grow!
Check out other forecasts below too!
Bullish bounce off 61.8% Fibonacci support?EUR/USD is falling towards the support level which is a pullback support that aligns with the 61.8% Fibonacci retracement and could bounce from this level to our take profit.
Entry: 1.0376
Why we like it:
There is a pullback support level that aligns with the 61.8% Fibonacci retracement.
Stop loss: 1.0327
Why we like it:
There is an overlap support level that is slightly below the 76.4% Fibonacci retracement.
Take profit: 1.0458
Why we like it:
There is an overlap resistance level.
Enjoying your TradingView experience? Review us!
Please be advised that the information presented on TradingView is provided to Vantage (‘Vantage Global Limited’, ‘we’) by a third-party provider (‘Everest Fortune Group’). Please be reminded that you are solely responsible for the trading decisions on your account. There is a very high degree of risk involved in trading. Any information and/or content is intended entirely for research, educational and informational purposes only and does not constitute investment or consultation advice or investment strategy. The information is not tailored to the investment needs of any specific person and therefore does not involve a consideration of any of the investment objectives, financial situation or needs of any viewer that may receive it. Kindly also note that past performance is not a reliable indicator of future results. Actual results may differ materially from those anticipated in forward-looking or past performance statements. We assume no liability as to the accuracy or completeness of any of the information and/or content provided herein and the Company cannot be held responsible for any omission, mistake nor for any loss or damage including without limitation to any loss of profit which may arise from reliance on any information supplied by Everest Fortune Group.

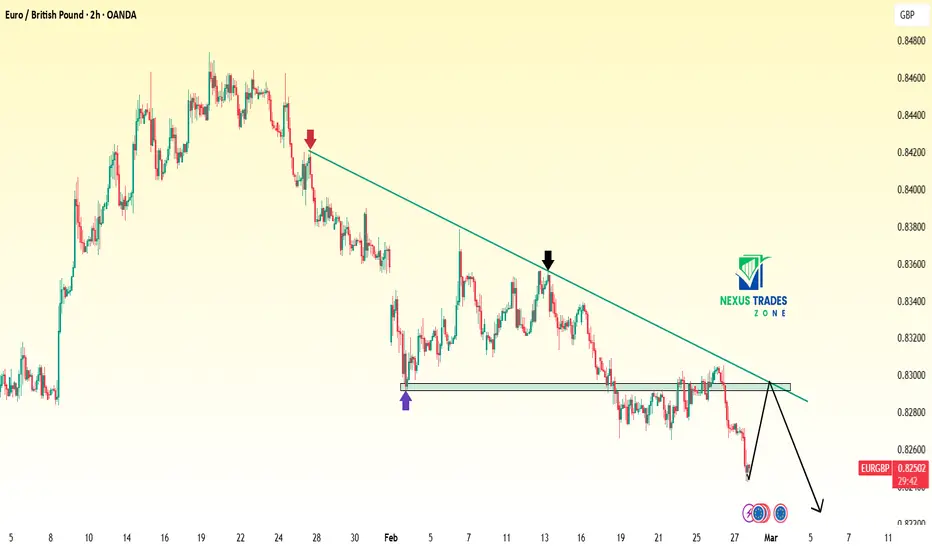
EUR/GBP Bearish Retest – Downtrend Continuation Below 0.8300Chart Analysis & Trade Setup:
The EUR/GBP 2-hour chart highlights a strong downtrend with a descending trendline acting as resistance. The price recently tested a key horizontal resistance zone near 0.8300, rejecting it for a potential continuation lower.
Technical Breakdown:
📉 Descending Trendline: The price has respected the trendline resistance, marked by two key rejection points (black and red arrows).
📊 Support Turned Resistance: The previous support near 0.8300 has now flipped into resistance after a breakdown.
🔄 Bearish Retest Formation: Price is expected to retest 0.8300 before continuing the downtrend.
📌 Bearish Outlook: If the price holds below 0.8300, we can expect further downside toward new lows.
Trade Plan:
✅ Entry: Consider a short position near 0.8290 - 0.8300 on bearish confirmation.
🎯 Target 1: 0.8220 (Previous low).
🎯 Target 2: 0.8180 (Next key support zone).
🛑 Stop Loss: Above 0.8325, to protect against an invalidation of the bearish setup.
Conclusion:
EUR/GBP remains in a clear downtrend, with a bearish rejection at 0.8300 acting as a key trigger for further downside. Traders should watch for a clean retest before entering short positions.
📊 Bearish Retest in Play – EUR/GBP Targets Lower Levels! 🚀