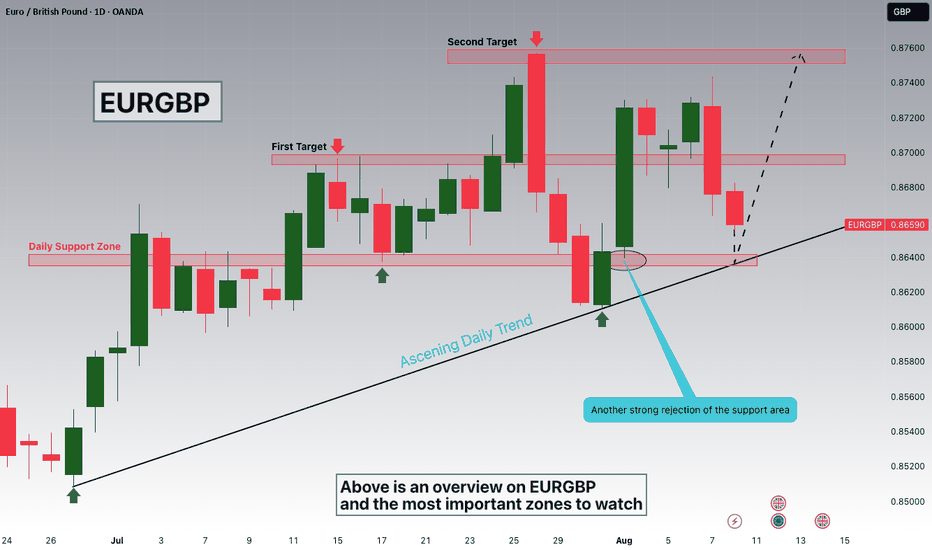
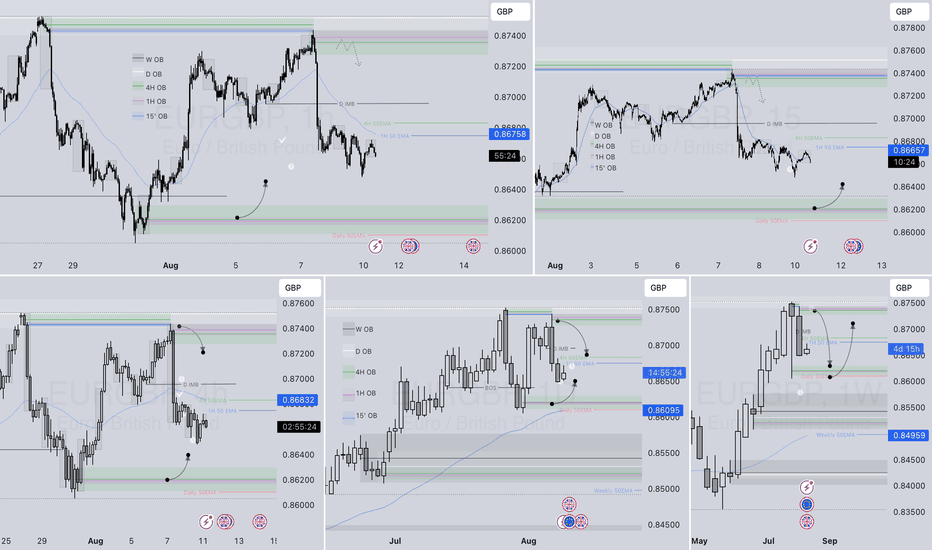
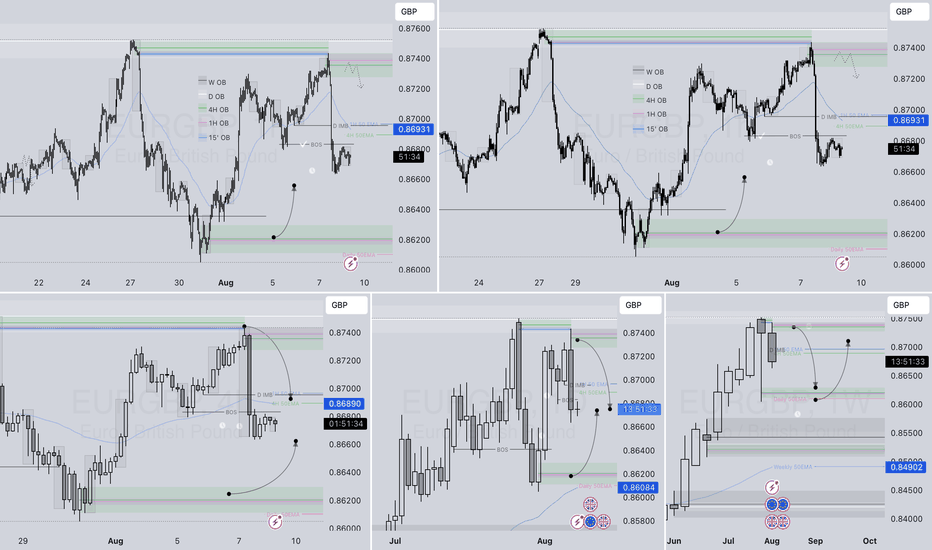
EURGBP is Nearing the Daily Trend!!!Hey Traders, in the coming week we are monitoring EURBBP for a buying opportunity around 0.86400 zone, EURGBP is trading in an uptrend and currently is in a correction phase in which it is approaching the trend at 0.86400 support and resistance area.
Trade safe, Joe.
EUR (Euro)
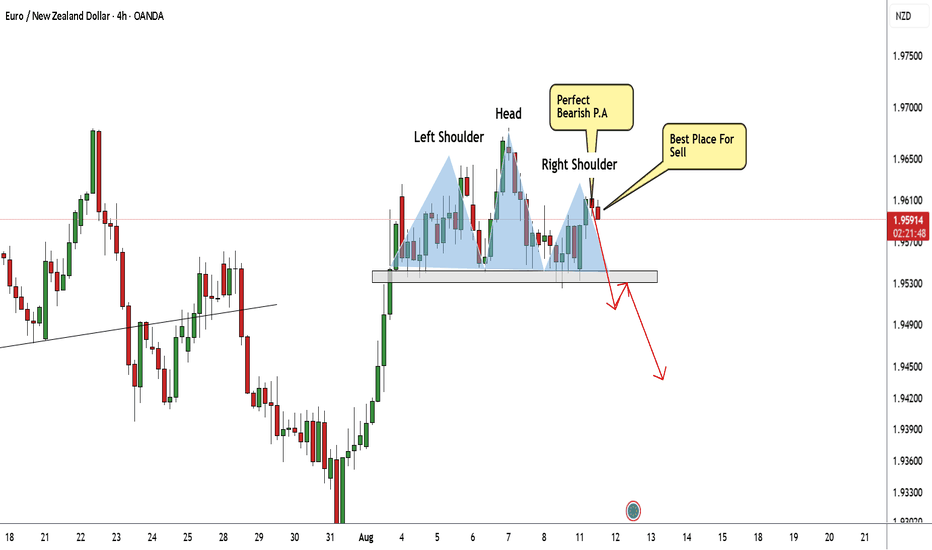
EUR/NZD Creating H&S Pattern , Short Setup Valid Now !Here is my 4H Chart On EUR/NZD , The price creating a very clear reversal pattern ( head and shoulders pattern ) and the price made a very good bearish price action now from good res area so we can enter a sell trade now and targeting the neckline for this pattern and if we have a clear 4H Closure Below My Neckline we can add another entry But as i mentioned we need to see a clear closure below the neckline so the pattern still not confirmed and we can sell after we have a clear closure below our neckline and targeting from 100 : 150 pips , if we have not a closure below the neckline then we can`t add the second sell entry .
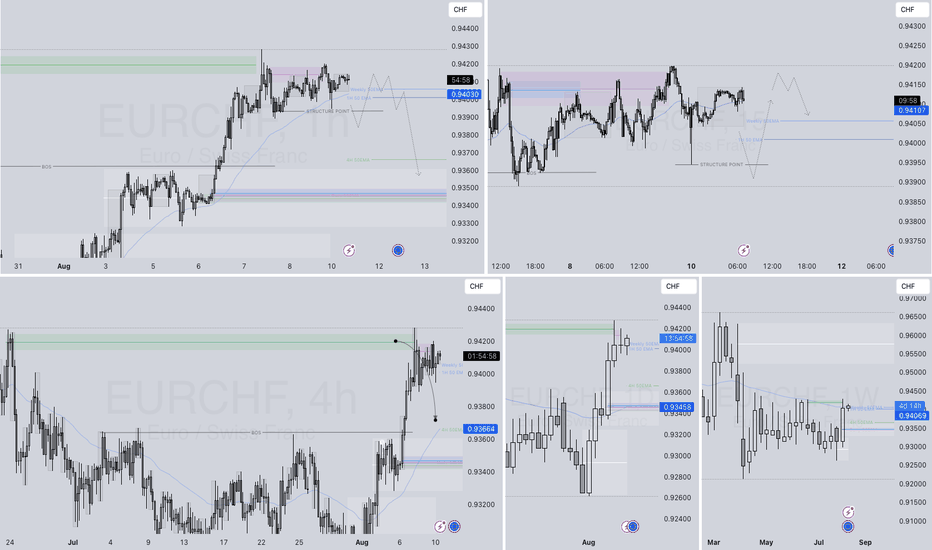
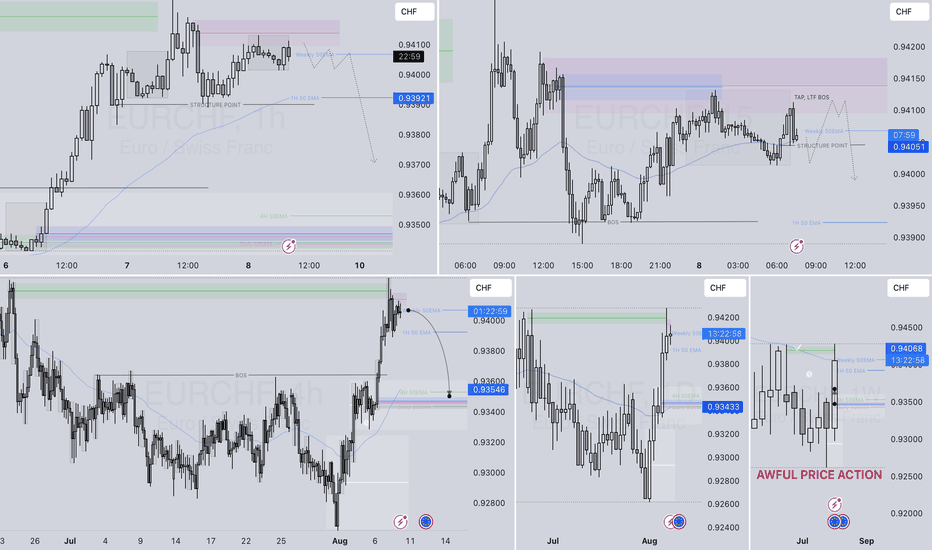
EURCHF – DAILY FORECAST Q3 | W33 | D11 | Y25📊 EURCHF – DAILY FORECAST
Q3 | W33 | D11 | Y25
Daily Forecast 🔍📅
Here’s a short diagnosis of the current chart setup 🧠📈
Higher time frame order blocks have been identified — these are our patient points of interest 🎯🧭.
It’s crucial to wait for a confirmed break of structure 🧱✅ before forming a directional bias.
This keeps us disciplined and aligned with what price action is truly telling us.
📈 Risk Management Protocols
🔑 Core principles:
Max 1% risk per trade
Only execute at pre-identified levels
Use alerts, not emotion
Stick to your RR plan — minimum 1:2
🧠 You’re not paid for how many trades you take, you’re paid for how well you manage risk.
🧠 Weekly FRGNT Insight
"Trade what the market gives, not what your ego wants."
Stay mechanical. Stay focused. Let the probabilities work.
OANDA:EURCHF
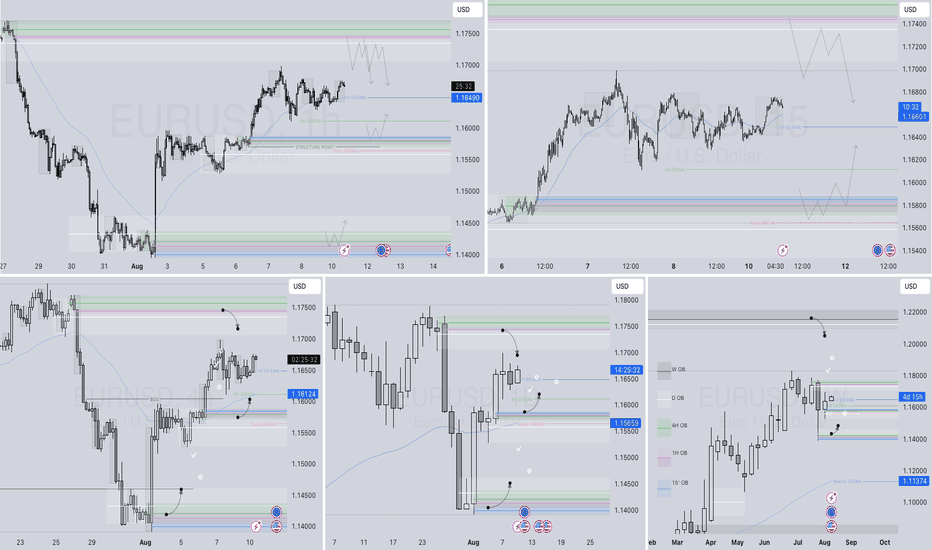
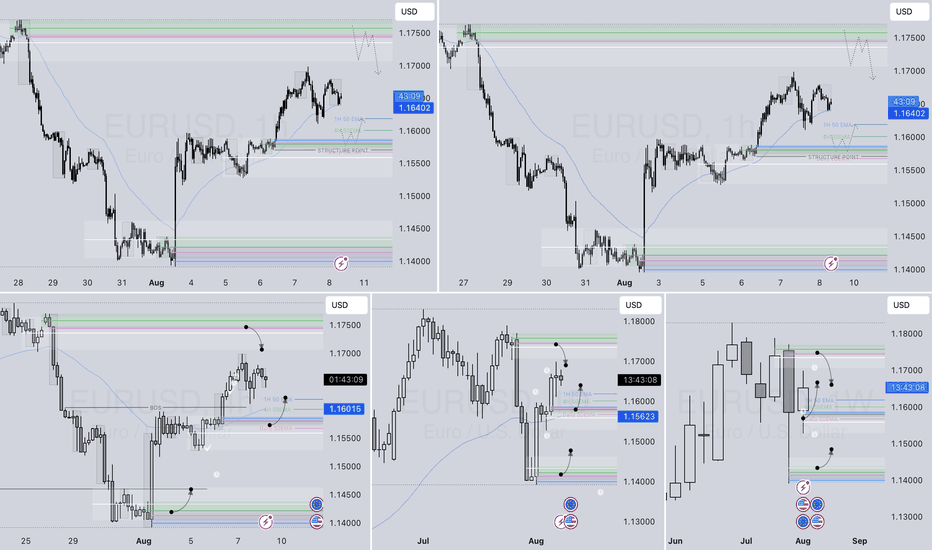
EURUSD – DAILY FORECAST Q3 | W33 | D11 | Y25
📊 EURUSD – DAILY FORECAST
Q3 | W33 | D11 | Y25
Daily Forecast 🔍📅
Here’s a short diagnosis of the current chart setup 🧠📈
Higher time frame order blocks have been identified — these are our patient points of interest 🎯🧭.
It’s crucial to wait for a confirmed break of structure 🧱✅ before forming a directional bias.
This keeps us disciplined and aligned with what price action is truly telling us.
📈 Risk Management Protocols
🔑 Core principles:
Max 1% risk per trade
Only execute at pre-identified levels
Use alerts, not emotion
Stick to your RR plan — minimum 1:2
🧠 You’re not paid for how many trades you take, you’re paid for how well you manage risk.
🧠 Weekly FRGNT Insight
"Trade what the market gives, not what your ego wants."
Stay mechanical. Stay focused. Let the probabilities work.
FX:EURUSD
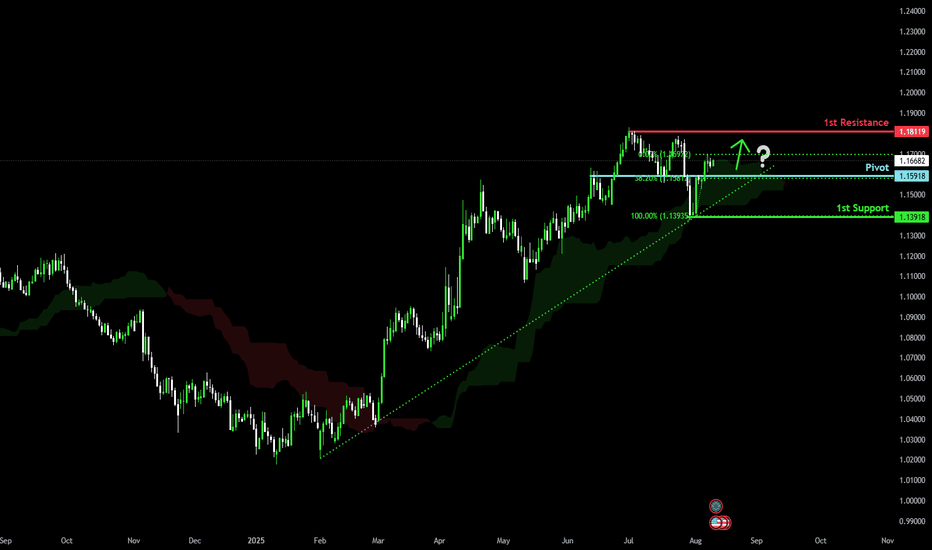
Bullish rise?The Fiber (EUR/USD) is falling towards the pivot and could bounce to the 1st resistance.
Pivot: 1.1591
1st Support: 1.1391
1st Resistance: 1.1811
Risk Warning:
Trading Forex and CFDs carries a high level of risk to your capital and you should only trade with money you can afford to lose. Trading Forex and CFDs may not be suitable for all investors, so please ensure that you fully understand the risks involved and seek independent advice if necessary.
Disclaimer:
The above opinions given constitute general market commentary, and do not constitute the opinion or advice of IC Markets or any form of personal or investment advice.
Any opinions, news, research, analyses, prices, other information, or links to third-party sites contained on this website are provided on an "as-is" basis, are intended only to be informative, is not an advice nor a recommendation, nor research, or a record of our trading prices, or an offer of, or solicitation for a transaction in any financial instrument and thus should not be treated as such. The information provided does not involve any specific investment objectives, financial situation and needs of any specific person who may receive it. Please be aware, that past performance is not a reliable indicator of future performance and/or results. Past Performance or Forward-looking scenarios based upon the reasonable beliefs of the third-party provider are not a guarantee of future performance. Actual results may differ materially from those anticipated in forward-looking or past performance statements. IC Markets makes no representation or warranty and assumes no liability as to the accuracy or completeness of the information provided, nor any loss arising from any investment based on a recommendation, forecast or any information supplied by any third-party.
EURGBP – DAILY FORECAST Q3 | W33 | D11 | Y25📊 EURGBP – DAILY FORECAST
Q3 | W33 | D11 | Y25
Daily Forecast 🔍📅
Here’s a short diagnosis of the current chart setup 🧠📈
Higher time frame order blocks have been identified — these are our patient points of interest 🎯🧭.
It’s crucial to wait for a confirmed break of structure 🧱✅ before forming a directional bias.
This keeps us disciplined and aligned with what price action is truly telling us.
📈 Risk Management Protocols
🔑 Core principles:
Max 1% risk per trade
Only execute at pre-identified levels
Use alerts, not emotion
Stick to your RR plan — minimum 1:2
🧠 You’re not paid for how many trades you take, you’re paid for how well you manage risk.
🧠 Weekly FRGNT Insight
"Trade what the market gives, not what your ego wants."
Stay mechanical. Stay focused. Let the probabilities work.
FX:EURGBP
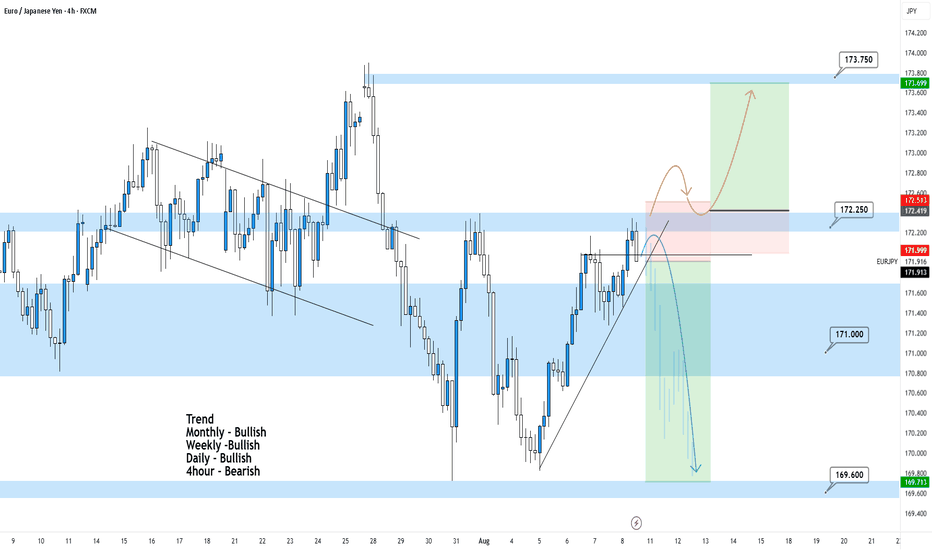
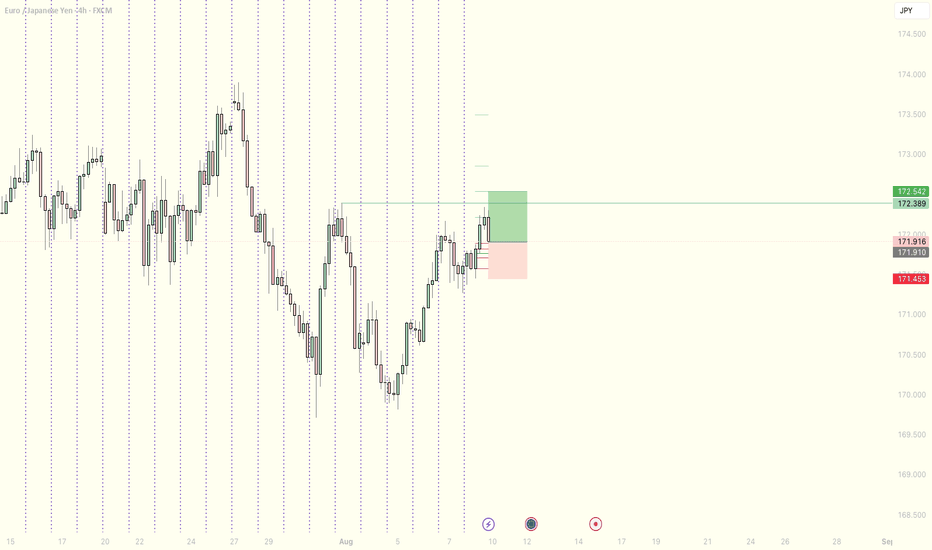
EURJPY 4Hour TF - August 10th, 2025🟦 EURJPY 4H Analysis
📅 August 10, 2025
Top-Down Trend Bias:
• Monthly – Bullish
• Weekly – Bullish
• Daily – Bullish
• 4H – Bearish
EURJPY is approaching the 172.25 resistance zone after a strong bullish correction. While higher timeframes remain bullish, the 4H structure is still technically in a retracement phase, making this a critical reaction level.
🔍 Key Zone: 172.50
This area marks prior structure and could serve as either a breakout base for further upside or a strong rejection point for sellers.
✅ Scenario A: Bullish Breakout (Orange Path)
1.If price breaks and closes above 172.50
2.Expect continuation toward 173.75 resistance zone
This would align with the overall bullish HTF bias
⚠️ Scenario B: Bearish Rejection (Blue Path)
1.If price rejects from 172.250
2.Look for bearish confirmation (rejection wicks, engulfing, LTF BOS)
Target 1: 171.00
Target 2: 169.60 support
This would maintain the short term 4H bearish structure while still sitting inside a bullish macro trend.
🧠 Final Notes
• 172.250 is the key decision point, watch for clear confirmation
• HTFs favor upside, but short term traders may find better R:R on a rejection
• Always trade the reaction, not the assumption
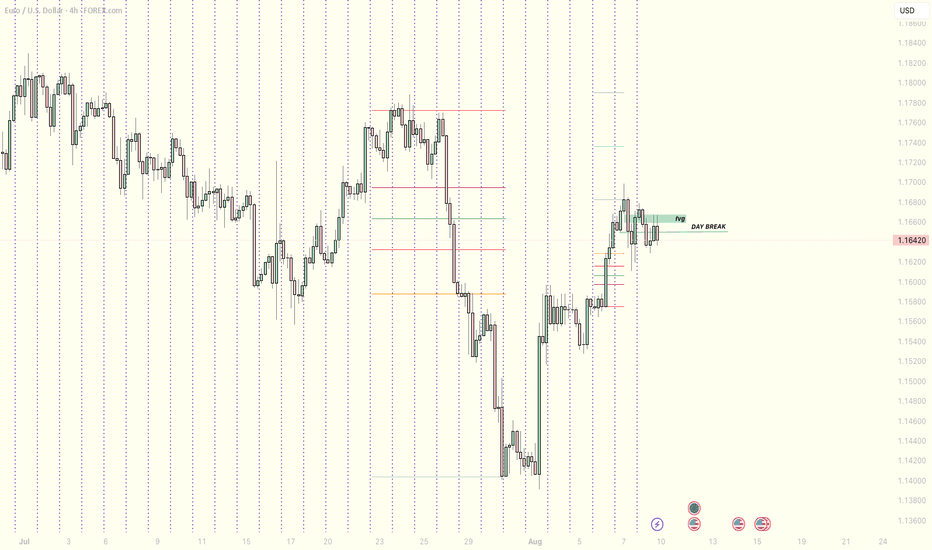
EURUSDMy Bias: cautiously bearish unless reclaimed.
Context: Price broke the daily structure (“day break”), retraced into a fair value gap and reacted.
Plan: I’ll wait for a clean LTF break of structure and displacement from that FVG before taking shorts on a pullback into fresh imbalance. If the FVG is reclaimed and we close back above it, I will reassess the bias. Be patient until next week’s session opens. NFA.
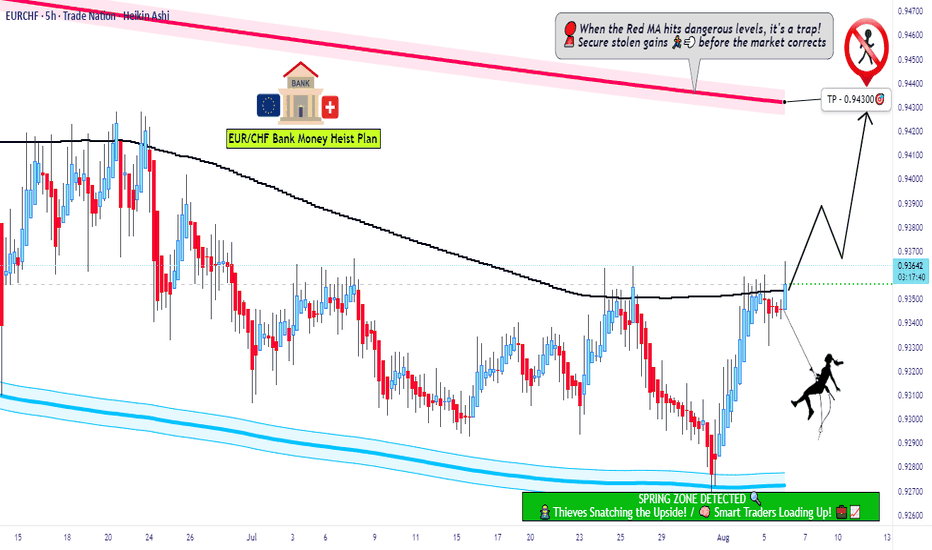
EUR/CHF Bullish Vault Raid – The Franc Robbery Begins!💣EUR/CHF Bullish Heist: Thief's Franc Escape Plan 🚨💰
🚨Asset: EUR/CHF "Euro-Franc" Forex Market
📈Plan: Bullish
🎯Entry: Any price level (No breakout entry nonsense – we're stealthy robbers)
🛑Stop Loss: 0.93200
🏆Target: 0.94300
👑Thief's Statement:
Hey Money Muggers & Market Marauders! 🥷💰
Today, we strike the Euro-Franc vault with a clean bullish heist plan. No noise, no breakout bait — just silent limit orders stacked like layers on a cake 🍰.
🎭We ain’t chasing price… we let price chase us! Smart thieves wait. Pullbacks? That’s our entry door 🧨🚪.
🔑Gameplan:
📦 Entry:
🕵️♂️Layer up your Buy Limit orders near recent pullbacks or swing lows.
⏳Wait on the 15M or 30M timeframe for the cleanest setups.
📉No breakout entries – thieves don’t chase, we trap.
🛡️Stop Loss (SL):
🧱Set at 0.93200 — hidden just below the thief's last cover zone.
🎲Risk based on your position size & how many orders you layer.
🎯Keep it tactical. One mistake and the vault closes!
🏁Target (TP):
💎0.94300 is the escape tunnel.
💨Exit fast if heat rises before the target hits. Smart thieves know when to run!
👊Scalpers’ Note:
🪝Only ride long waves — don’t swim against the current.
💣Use trailing SL to secure the loot as price climbs.
👑Big pockets? Dive in. Small pockets? Swing with precision.
🧠Why We Rob Here:
EUR/CHF fundamentals align with the bulls. We're riding sentiment, intermarket flow, and positioning from big money. COT, macro signals, and FX momentum all say: Thieves, it's go time! 🚨
📢News Alert:
❌ Avoid entries during high-impact news – it ain’t worth jail time (or stop hunts).
🎯Use a trailing SL to protect gains if caught mid-heist during volatility.
🔥Like the Plan? Hit that Boost Button 💥
Join the Thief Squad and let’s rob the FX banks together 💵💎
Catch you in the next heist drop 🐱👤🚀
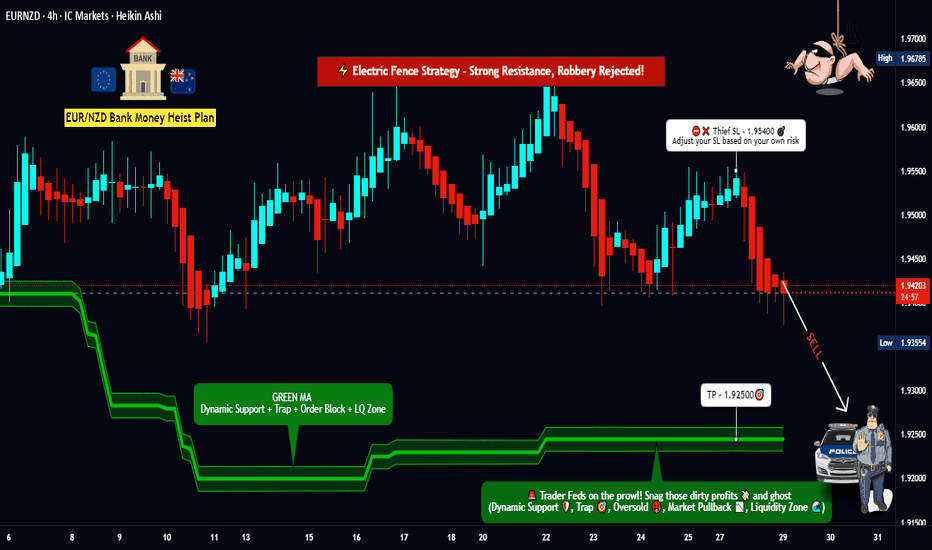
Dynamic Entry Alert – EUR/NZD Bearish Heist Execution!💣 EUR/NZD Robbery Blueprint: The Kiwi Vault Bearish Heist Plan 💰🕵️♂️
🌟Hi! Hola! Ola! Bonjour! Hallo! Marhaba!🌟
Dear Money Makers & Robbers, 🤑💰✈️
This ain't your usual trading tip — it’s a Thief Trading Masterstroke 🎯. We're gearing up for a high-stakes heist on the EUR/NZD forex market. Time to crack open the Kiwi vault and rob those bullish bandits blind! 😼💣
🧠 Strategic Mindset:
🔍 We're targeting the oversold consolidation zone. Bullish traders think they’re safe? Think again. This area is a trap — the perfect bait for our bearish ambush. Expect trend reversal vibes, layered with juicy liquidity grabs.
🕵️♂️ Entry Plan:
🎯 Sell Entry: The vault is wide open! Swipe the Bearish loot at any price - the heist is on!.
💣 Setup:
Sell Limit Orders at nearest swing highs (15m or 30m timeframe)
Use DCA / Layering Method for multiple entries (scalp or swing tactics)
📌 Set your Alert 🚨 — no breakout, no entry. Patience pays.
🛑 Stop Loss Strategy (SL):
No premature moves! Don’t place that SL till we get the confirmed break.
🔥 SL Recommendation:
Just above 1.95400 (4H candle wick swing high)
Adjust based on lot size and number of layers
📍 Remember, the market’s a jungle — stay sharp or get sliced.
🎯 Take Profit (TP):
💵 Target Zone: 1.92500
(But hey, escape early if the vault starts shaking. Protect your gains like a pro.)
📊 Macro Intel – Why This Works:
This isn’t random — it's backed by our 🔥 combo of:
COT Reports
Sentiment Analysis
Quant/Algo Bias
Intermarket Correlation
Fundamental + Technical Confirmation
📌 You can dig deeper — but trust me, this setup’s been scouted like a pro job.
⚠️ Risk Protocols:
Avoid entries during high-impact news
Use Trailing SLs to lock in the loot
Adjust position size to suit your personal bankroll & risk appetite
🔥 Final Word from the Thief:
Smash that 💥Boost Button💥 if you're vibing with the heist plan!
Support the squad, stay profitable, and rob the market — legally, of course.
We don’t trade, we infiltrate.
We don’t predict, we execute.
📡 Stay tuned… More robbery blueprints coming soon!
🤑🐱👤🚨💸💪 #ThiefTrader #ForexHeist #EURNZDShortPlan
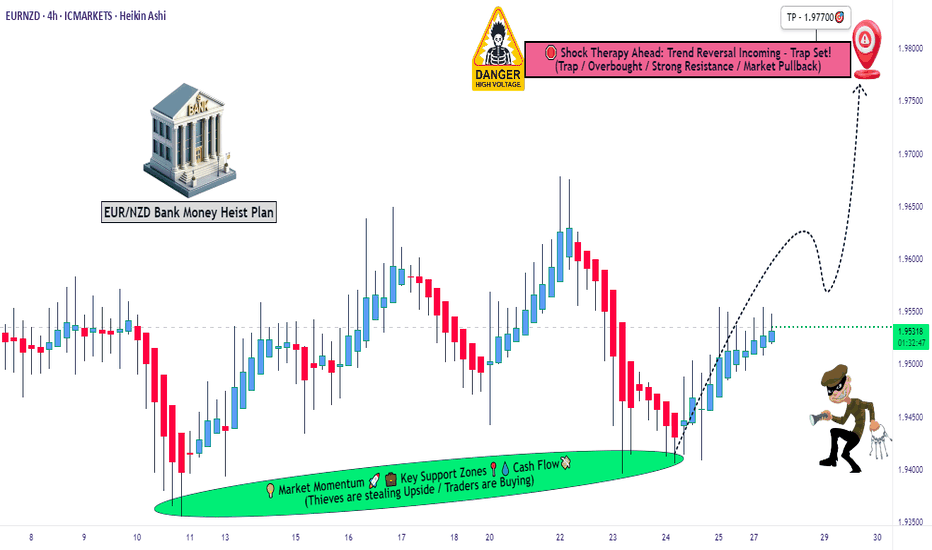
Euro vs Kiwi Bull Raid: High Reward Target Strategy🏴☠️EUR/NZD Heist Plan: "Robbing the Kiwi Vault with Thief Trading Style" 💰🔥
🌍 Hi! Hola! Ola! Bonjour! Hallo! Marhaba! 🌍
Dear Money Makers, Chart Bandits & Market Strategists! 🤑💸✈️
Here’s the EUR/NZD (Euro vs Kiwi) blueprint crafted using the signature 🔥Thief Trading Style🔥 — a blend of bold technicals, insightful fundamentals, and pure tactical precision. We’re setting our sights on a potential bullish breakout — targeting the high-security resistance zone where big money hides.
💡The Robbery Plan (Thief Entry Setup):
🟢 Entry Point:
"The vault is wide open — time to extract the bullish loot!"
⚔️ Entry can be taken at market price, but the smarter thieves use a layered Buy Limit strategy at pullback zones (near swing lows/highs on the 15-30 min TF) to snipe the best entries with reduced exposure.
🔁 Scaling in = DCA-style Thief Method: split entries for efficiency, just like robbing in waves.
🔻 Stop Loss Plan (Escape Route):
🔒 Place SL below the recent swing low using 3H timeframe (1.94000 for scalpers/day traders).
🛡️ Adjust based on risk appetite, lot size, and number of entries in play.
🎯 Take Profit Target:
🏁 Exit the heist near 1.97700, where strong resistance awaits. That’s the Danger Zone — the edge of our mission.
🔍EUR/NZD Outlook Snapshot:
This pair is flashing bullish vibes due to:
🏛️ Macro & Fundamental tailwinds
📊 COT positioning & Sentiment readings
🔗 Intermarket influences
📈 Price structure & liquidity zones
For more depth: dive into external analysis tools, COT reports, and sentiment dashboards to fine-tune your view. The direction is clear — the bulls are assembling.
⚠️ Trading Alerts & Risk Management Reminders:
🚨 News releases = volatility mines.
Before entering, make sure to:
Avoid new positions near red-flag economic events
Protect your open trades with trailing SLs or partial exits
Stay alert — the market shifts fast, adapt faster
💬 Final Word from the Vault Boss:
📢 Smashing likes = boosting the crew. 💥
Support the Thief Trading Style by hitting the BOOST button and keep the robbery crew rolling strong 💪💸
We're here to outsmart the market — one clean chart raid at a time.
Stay tuned for the next master plan. Until then, rob smart, rob safe. 🧠🔐💥
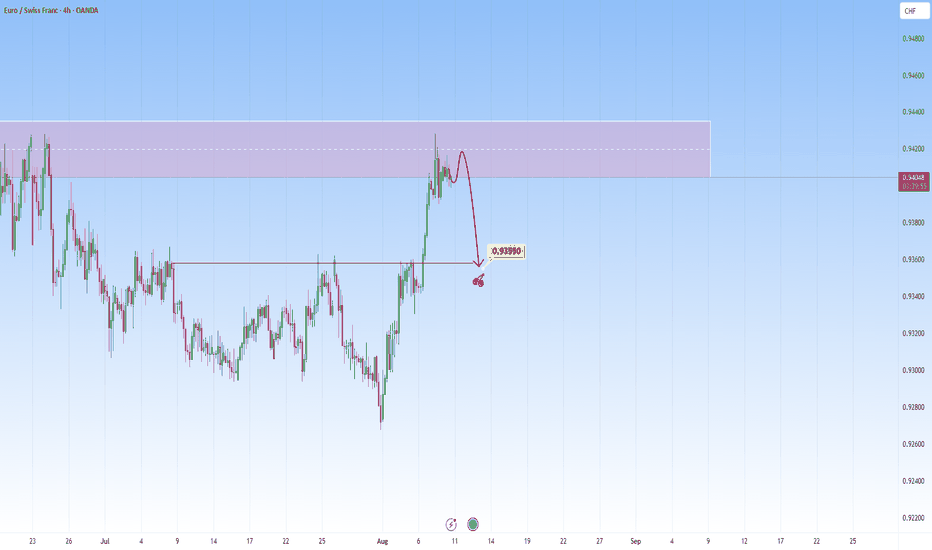
EURCHF: Likely pullback at resistanceI am watching for a reversal EURCHF, expecting a rejection with a target at around 0.93550.
This area is where it can become a decision point: either price bounces, or it breaks above and the move can start to go higher.
I'll be watching for confirmation: not just in candlestick structure, but also in volume behavior.
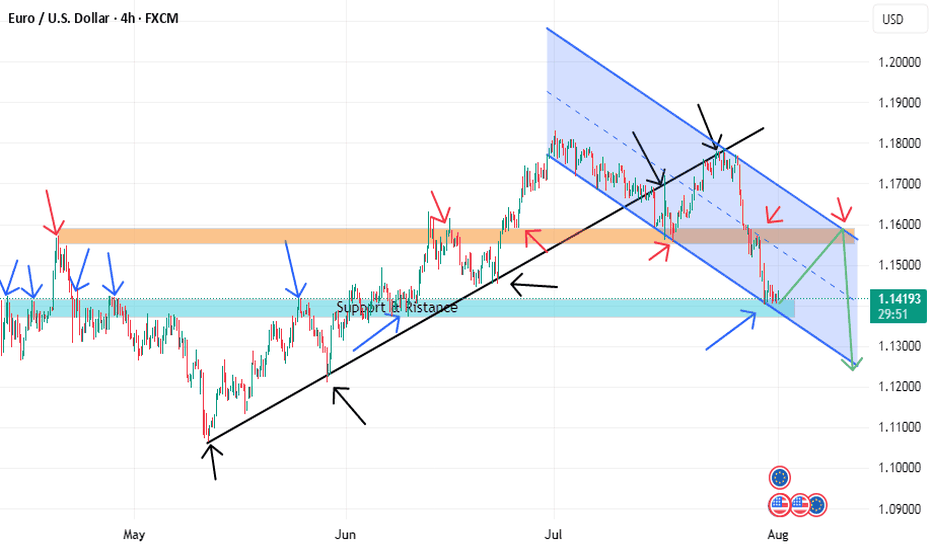
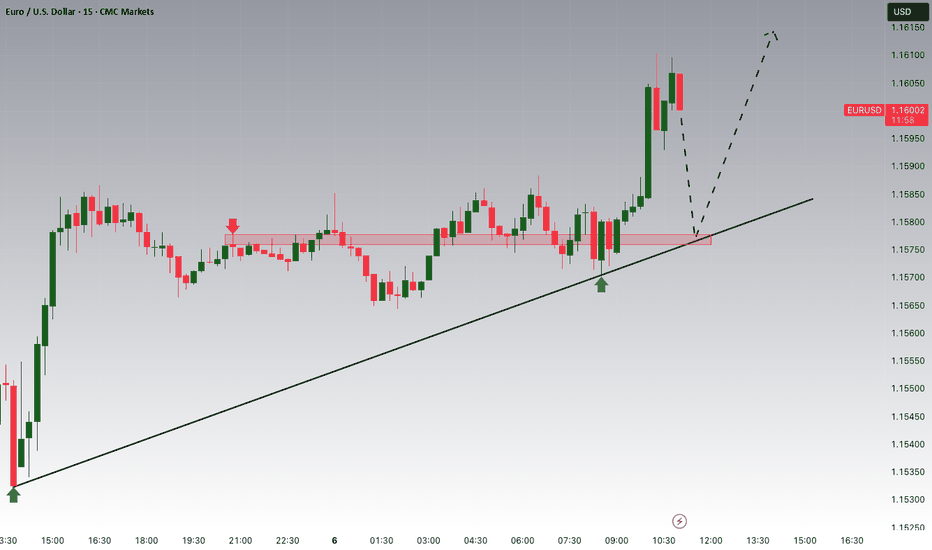
EURUSD BUYING CORRECTION AND SHORTThe price is now at a strong support level and if it can be a double bottom it will retest the descending channel line and reach the orange resistance, but in the general direction the price prefers to fall due to breaking the black uptrend line. We also have a more beautiful scenario, which is if it can break the strong support we will go with the downward trend.
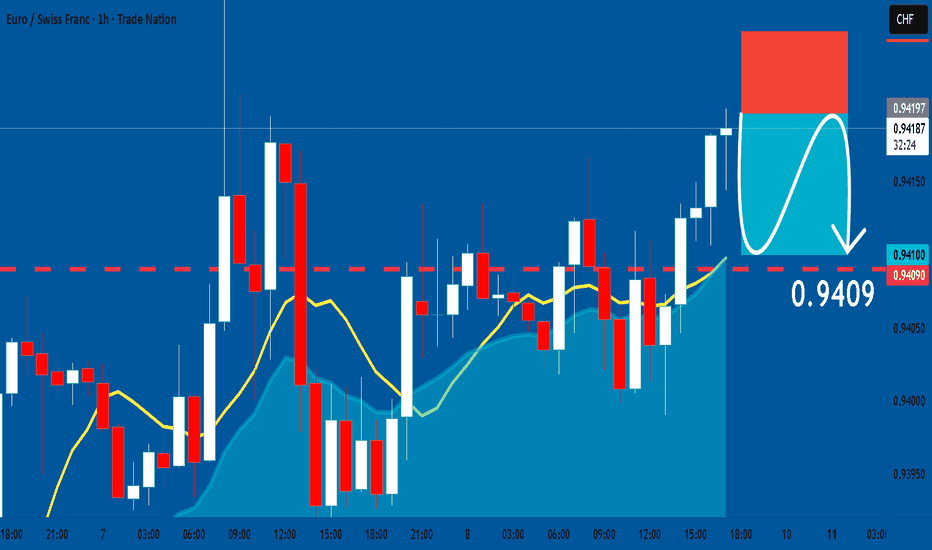
EURCHF: Bearish Continuation & Short Signal
EURCHF
- Classic bearish pattern
- Our team expects retracement
SUGGESTED TRADE:
Swing Trade
Sell EURCHF
Entry - 0.9419
Stop - 0.9425
Take - 0.9409
Our Risk - 1%
Start protection of your profits from lower levels
Disclosure: I am part of Trade Nation's Influencer program and receive a monthly fee for using their TradingView charts in my analysis.
❤️ Please, support our work with like & comment! ❤️
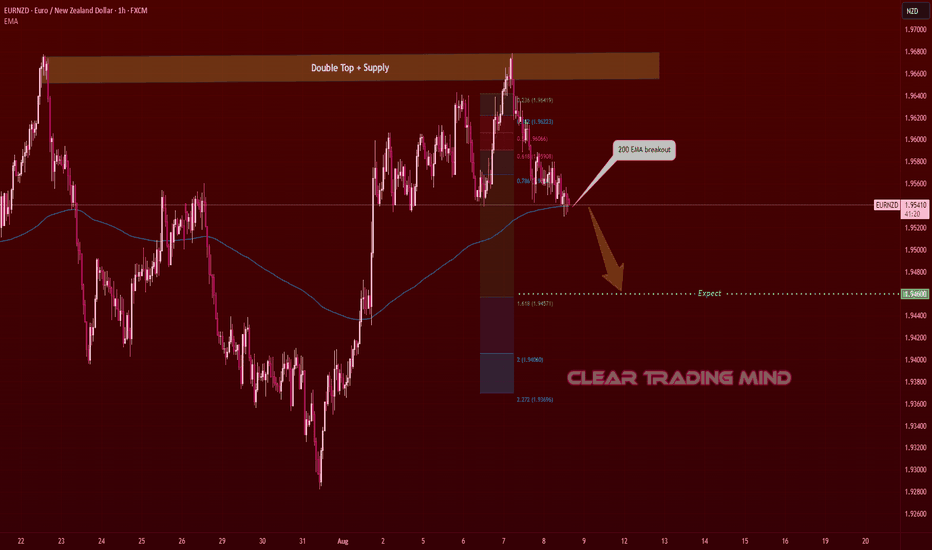
EURNZD – Double Top + 200 EMA Break… Is the Fall Coming?I think this pair has more chance to go down because a clear Double Top pattern has been formed exactly at a supply zone. After that, price has broken below the 200 EMA, showing weakness in the recent bullish move.
From here, I’m looking at the possibility of a bearish continuation. My expectation is for price to drop towards the 1.94600 area, which aligns with the Fibonacci extension target.
This is just my personal view based on the pattern and 200 EMA break — let’s see how the market reacts in the coming sessions.
EURCHF – DAILY FORECAST Q3 | W32 | D8 | Y25📊 EURCHF – DAILY FORECAST
Q3 | W32 | D8 | Y25
Daily Forecast 🔍📅
Here’s a short diagnosis of the current chart setup 🧠📈
Higher time frame order blocks have been identified — these are our patient points of interest 🎯🧭.
It’s crucial to wait for a confirmed break of structure 🧱✅ before forming a directional bias.
This keeps us disciplined and aligned with what price action is truly telling us.
📈 Risk Management Protocols
🔑 Core principles:
Max 1% risk per trade
Only execute at pre-identified levels
Use alerts, not emotion
Stick to your RR plan — minimum 1:2
🧠 You’re not paid for how many trades you take, you’re paid for how well you manage risk.
🧠 Weekly FRGNT Insight
"Trade what the market gives, not what your ego wants."
Stay mechanical. Stay focused. Let the probabilities work.
FX:EURCHF
EURUSD – DAILY FORECAST Q3 | W32 | D8 | Y25📊 EURUSD – DAILY FORECAST
Q3 | W32 | D8 | Y25
Daily Forecast 🔍📅
Here’s a short diagnosis of the current chart setup 🧠📈
Higher time frame order blocks have been identified — these are our patient points of interest 🎯🧭.
It’s crucial to wait for a confirmed break of structure 🧱✅ before forming a directional bias.
This keeps us disciplined and aligned with what price action is truly telling us.
📈 Risk Management Protocols
🔑 Core principles:
Max 1% risk per trade
Only execute at pre-identified levels
Use alerts, not emotion
Stick to your RR plan — minimum 1:2
🧠 You’re not paid for how many trades you take, you’re paid for how well you manage risk.
🧠 Weekly FRGNT Insight
"Trade what the market gives, not what your ego wants."
Stay mechanical. Stay focused. Let the probabilities work.
FX:EURUSD
EURGBP – DAILY FORECAST Q3 | W32 | D8 | Y25📊 EURGBP – DAILY FORECAST
Q3 | W32 | D8 | Y25
Daily Forecast 🔍📅
Here’s a short diagnosis of the current chart setup 🧠📈
Higher time frame order blocks have been identified — these are our patient points of interest 🎯🧭.
It’s crucial to wait for a confirmed break of structure 🧱✅ before forming a directional bias.
This keeps us disciplined and aligned with what price action is truly telling us.
📈 Risk Management Protocols
🔑 Core principles:
Max 1% risk per trade
Only execute at pre-identified levels
Use alerts, not emotion
Stick to your RR plan — minimum 1:2
🧠 You’re not paid for how many trades you take, you’re paid for how well you manage risk.
🧠 Weekly FRGNT Insight
"Trade what the market gives, not what your ego wants."
Stay mechanical. Stay focused. Let the probabilities work.
FX:EURGBP
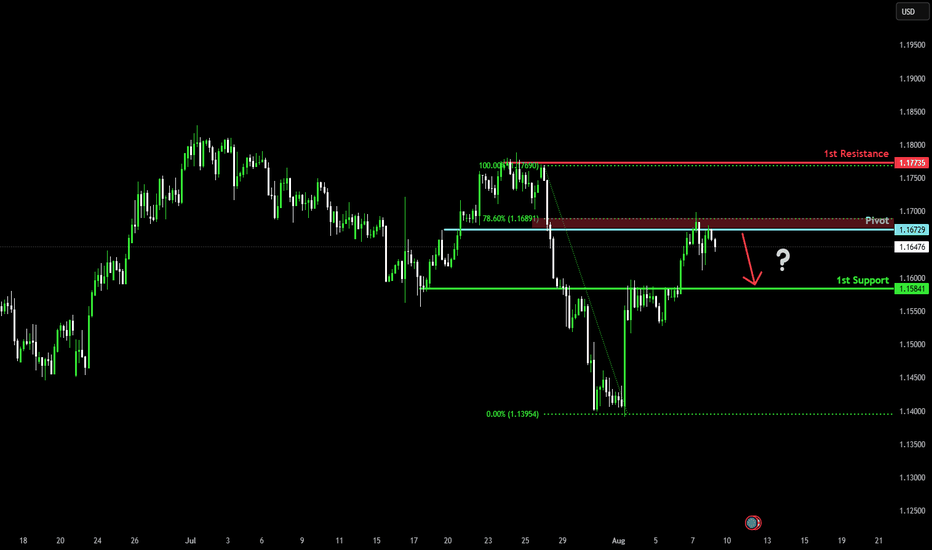
Potential bearish drop?The Fiber (EUR/USD) has rejected off the pivot which acts as a pullback resistance that is slightly below the 78.6% Fibonacci retracement and could drop to the 1st support.
Pivot: 1.1672
1st Support: 1.1584
1st Resistance: 1.1773
Risk Warning:
Trading Forex and CFDs carries a high level of risk to your capital and you should only trade with money you can afford to lose. Trading Forex and CFDs may not be suitable for all investors, so please ensure that you fully understand the risks involved and seek independent advice if necessary.
Disclaimer:
The above opinions given constitute general market commentary, and do not constitute the opinion or advice of IC Markets or any form of personal or investment advice.
Any opinions, news, research, analyses, prices, other information, or links to third-party sites contained on this website are provided on an "as-is" basis, are intended only to be informative, is not an advice nor a recommendation, nor research, or a record of our trading prices, or an offer of, or solicitation for a transaction in any financial instrument and thus should not be treated as such. The information provided does not involve any specific investment objectives, financial situation and needs of any specific person who may receive it. Please be aware, that past performance is not a reliable indicator of future performance and/or results. Past Performance or Forward-looking scenarios based upon the reasonable beliefs of the third-party provider are not a guarantee of future performance. Actual results may differ materially from those anticipated in forward-looking or past performance statements. IC Markets makes no representation or warranty and assumes no liability as to the accuracy or completeness of the information provided, nor any loss arising from any investment based on a recommendation, forecast or any information supplied by any third-party.
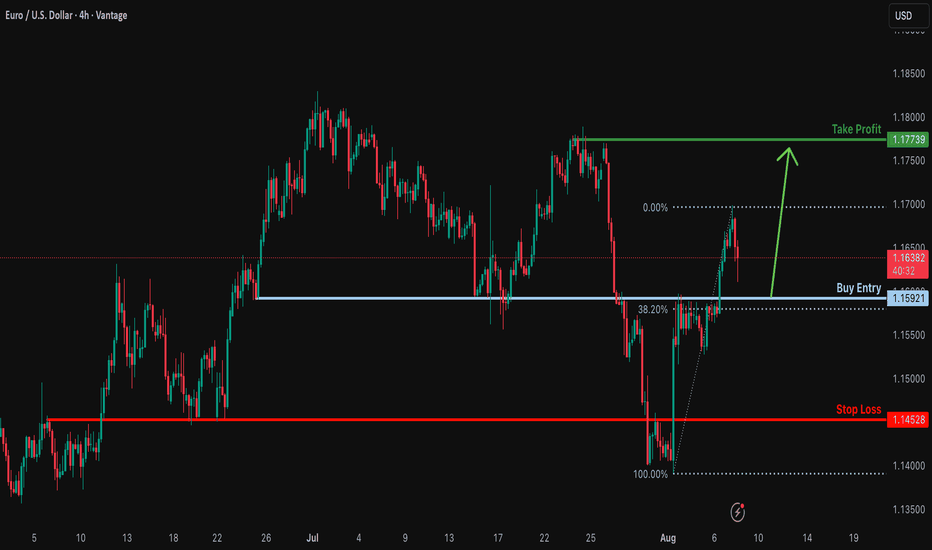
Bullish bounce off overlap support?EUR/USD is falling towards the support level which is an overlap support that aligns with the 38.2% Fibonacci retracement and could bounce from this level to our take profit.
Entry: 1.1592
Why we like it:
There is an overlap support level that lines up with the 38.2% Fibonacci retracement.
Stop loss: 1.1452
Why we like it:
There is a pullback support level that aligns with the 50% Fibonacci retracement.
Take profit: 1.1773
Why we llike it:
There is a swing high resistance.
Enjoying your TradingView experience? Review us!
Please be advised that the information presented on TradingView is provided to Vantage (‘Vantage Global Limited’, ‘we’) by a third-party provider (‘Everest Fortune Group’). Please be reminded that you are solely responsible for the trading decisions on your account. There is a very high degree of risk involved in trading. Any information and/or content is intended entirely for research, educational and informational purposes only and does not constitute investment or consultation advice or investment strategy. The information is not tailored to the investment needs of any specific person and therefore does not involve a consideration of any of the investment objectives, financial situation or needs of any viewer that may receive it. Kindly also note that past performance is not a reliable indicator of future results. Actual results may differ materially from those anticipated in forward-looking or past performance statements. We assume no liability as to the accuracy or completeness of any of the information and/or content provided herein and the Company cannot be held responsible for any omission, mistake nor for any loss or damage including without limitation to any loss of profit which may arise from reliance on any information supplied by Everest Fortune Group.
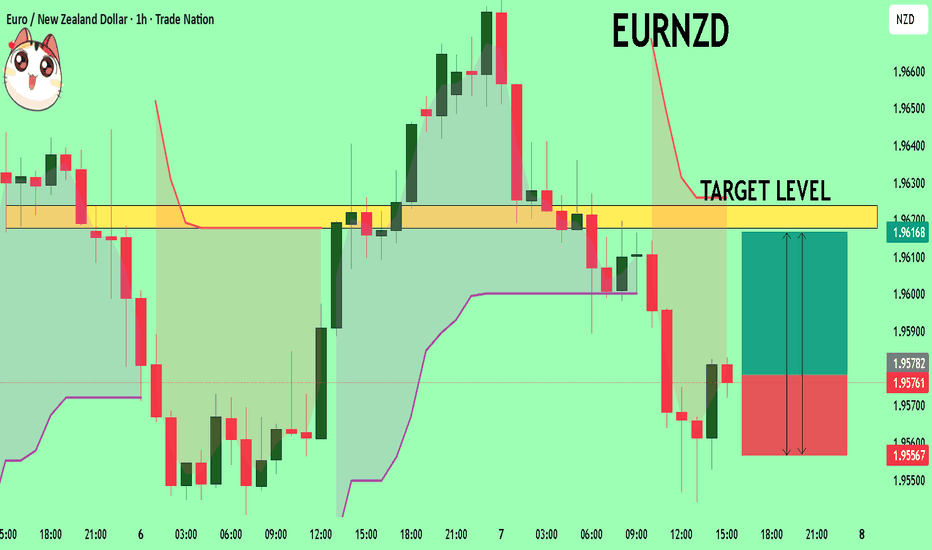
EURNZD On The Rise! BUY!
My dear followers,
I analysed this chart on EURNZD and concluded the following:
The market is trading on 1.9578 pivot level.
Bias - Bullish
Technical Indicators: Both Super Trend & Pivot HL indicate a highly probable Bullish continuation.
Target - 1.9617
Safe Stop Loss - 1.9556
About Used Indicators:
A super-trend indicator is plotted on either above or below the closing price to signal a buy or sell. The indicator changes color, based on whether or not you should be buying. If the super-trend indicator moves below the closing price, the indicator turns green, and it signals an entry point or points to buy.
Disclosure: I am part of Trade Nation's Influencer program and receive a monthly fee for using their TradingView charts in my analysis.
———————————
WISH YOU ALL LUCK
