EURCHF: Short Signal Explained
EURCHF
- Classic bearish formation
- Our team expects fall
SUGGESTED TRADE:
Swing Trade
Sell EURCHF
Entry Level - 0.9350
Sl - 0.9361
Tp - 0.9328
Our Risk - 1%
Start protection of your profits from lower levels
Disclosure: I am part of Trade Nation's Influencer program and receive a monthly fee for using their TradingView charts in my analysis.
❤️ Please, support our work with like & comment! ❤️
EUR (Euro)

Can Patience Unlock This XAU/EUR Opportunity? 🚨💰XAU/EUR: EURO HEIST IN PROGRESS – THIEVES GO BULLISH!💥🏴☠️
🕵️♂️ Attention, Market Robbers & Vault Crackers!
Thief Trader’s back with a high-stakes golden heist – and this time, EUR is the getaway car. 🎯💶
Forget breakout hype – this is pure limit-layered infiltration. Stealth entry. Silent profit. Heavy bags. 🎒📈
🧠 PLAN OF ATTACK:
🎯 Bias: Bullish (Gold’s about to flex on the Euro)
🎯 Entry: Any price – thief don’t chase, we wait in the dark. ☠️
🎯 Stop Loss: 2877.00 – 💥 tripwire before we vanish
🎯 Target: 2950.00 – get in, grab the gold, ghost the market 👻✨
🎯 STRATEGY: LAYERING METHOD – THE THIEF'S FINE ART
💼 We don’t go all-in… we stack limit orders like C4 charges.
💣 Layered entries across key price zones – stealth mode ON.
🧱 Let the market walk into our trap — snatch liquidity, don’t provide it.
🛠️ Execution Details:
🔹 No breakout chasing. No FOMO.
🔹 Set multiple Buy Limits across the zone.
🔹 Let price come to us like moths to gold flame 🔥
🛑 RISK PLAN – NEVER BLEED ON A ROBBERY
🎯 SL at 2877.00 – below vault support
🔑 Lock it. Walk it. Don’t argue with a stop.
💬 Adjust based on size, but don’t turn a job into a gamble.
🏁 TARGET EXIT: 2950.00 – THE HEIST PAYDAY
💎 That’s our clean escape.
⏱️ Don’t overstay. This isn’t a staking farm – it’s a smash-and-grab.
📉 Trailing SL recommended if you’re playing with size.
📊 Thief's Quick Insight:
🔍 Momentum: 📈 building
💶 EUR softness = GOLD opportunity
⚠️ Caution: No trades into news – thieves hate flashing sirens 🚓
📢 CREW CALL TO ACTION:
🚀 BOOST this setup
💬 Comment if you're riding with the robbers
💥 Hit LIKE if you love silent wins over loud losses
Stay low. Stack gold. Rob smart.
💼 Thief Trader™ – We rob the market, not the people.
🔐 This chart is for education only. Plan your own crime. This ain’t advice – it’s a blueprint for freedom. 🧠💼

EUR/NZD Made H&S Pattern , Short Setup Valid After Confirmation Here is my 1H Chart On EUR/NZD , The price created a very clear reversal pattern ( head and shoulders pattern ) But the price Still not close below the neckline so the pattern still not confirmed and we can sell after we have a clear closure below our neckline and targeting from 50 : 150 pips , if we have not a closure below the neckline then we can`t sell and this idea will not be valid anymore .

EURGBP – DAILY FORECAST Q3 | W32 | D4 | Y25📊 EURGBP – DAILY FORECAST
Q3 | W32 | D4 | Y25
Daily Forecast 🔍📅
Here’s a short diagnosis of the current chart setup 🧠📈
Higher time frame order blocks have been identified — these are our patient points of interest 🎯🧭.
It’s crucial to wait for a confirmed break of structure 🧱✅ before forming a directional bias.
This keeps us disciplined and aligned with what price action is truly telling us.
📈 Risk Management Protocols
🔑 Core principles:
Max 1% risk per trade
Only execute at pre-identified levels
Use alerts, not emotion
Stick to your RR plan — minimum 1:2
🧠 You’re not paid for how many trades you take, you’re paid for how well you manage risk.
🧠 Weekly FRGNT Insight
"Trade what the market gives, not what your ego wants."
Stay mechanical. Stay focused. Let the probabilities work.
FX:EURGBP

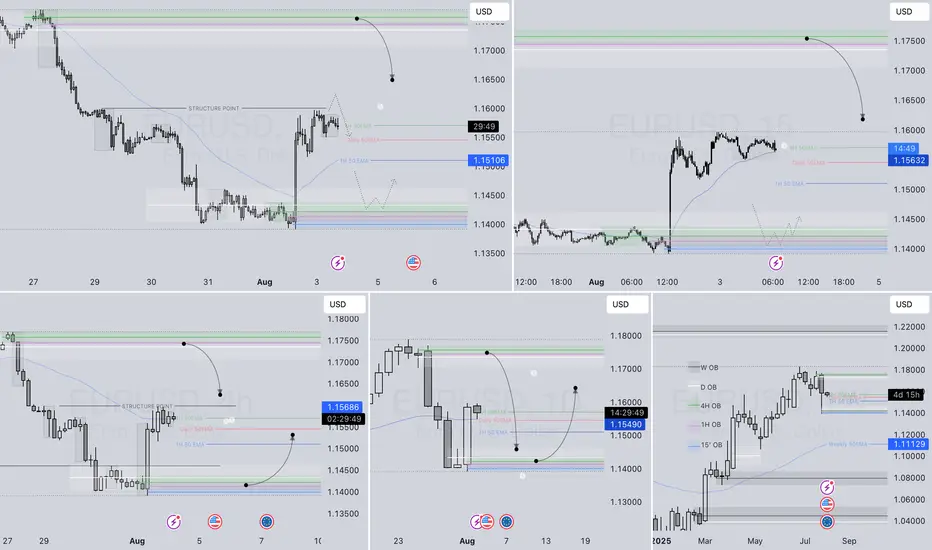
EURUSD – DAILY FORECAST Q3 | W32 | D4 | Y25📊 EURUSD – DAILY FORECAST
Q3 | W32 | D4 | Y25
Daily Forecast 🔍📅
Here’s a short diagnosis of the current chart setup 🧠📈
Higher time frame order blocks have been identified — these are our patient points of interest 🎯🧭.
It’s crucial to wait for a confirmed break of structure 🧱✅ before forming a directional bias.
This keeps us disciplined and aligned with what price action is truly telling us.
📈 Risk Management Protocols
🔑 Core principles:
Max 1% risk per trade
Only execute at pre-identified levels
Use alerts, not emotion
Stick to your RR plan — minimum 1:2
🧠 You’re not paid for how many trades you take, you’re paid for how well you manage risk.
🧠 Weekly FRGNT Insight
"Trade what the market gives, not what your ego wants."
Stay mechanical. Stay focused. Let the probabilities work.
FX:EURUSD
EURUSD consider on support and resistance zone togetherEURUSD now on resistance area i expect the price will break and form head and shoulder
on the other hand, may this area is strong and the price make down trend ,but we should wait candle pattern on this area to take sell
you must wait price action to take good trade with risk to reward 1:3
good luck

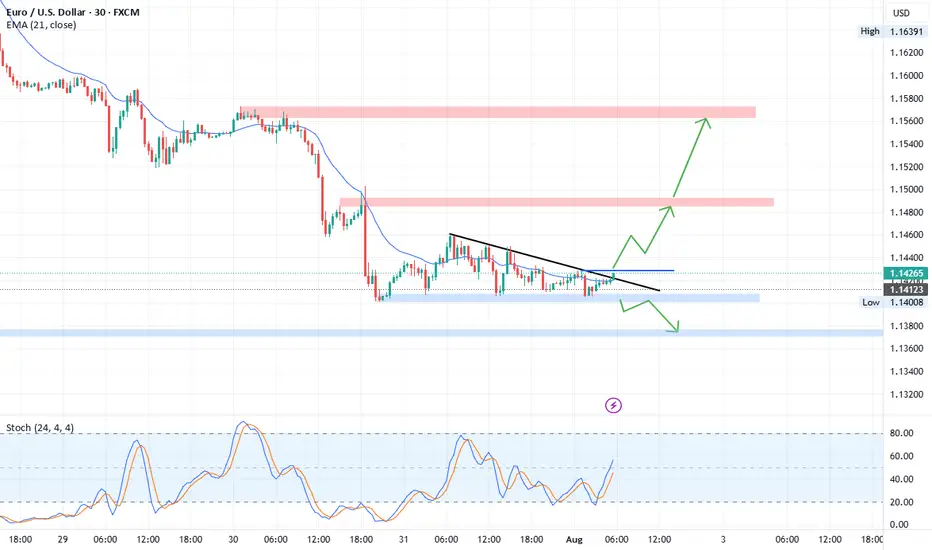
EUR/USD Technical OutlookEUR/USD is currently trading within a Descending Triangle formation. At present, the pair shows a higher probability of an upside breakout from this structure. A confirmed break above the immediate resistance zone at 1.1428 – 1.1430 could accelerate bullish momentum, opening the way toward the next key resistance level at 1.1485.
On the other hand, if the pair fails to sustain above the triangle and breaks to the downside, price may extend losses toward the 1.1375 – 1.1360 support area. From this zone, a potential corrective rebound could occur before the broader bearish trend resumes.
Overall, short-term direction hinges on the breakout of the descending triangle, with 1.1428 – 1.1430 as the critical level to watch for bulls, and 1.1375 – 1.1360 for bears. FOREXCOM:EURUSD
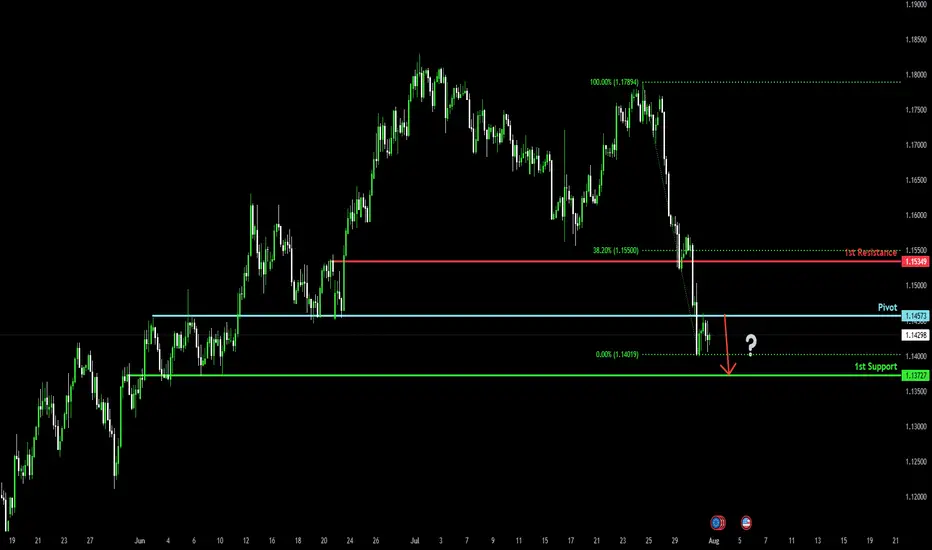
Bearish reversal off 50% Fibonacci resistance?The Fiber is reacting off the pivot, which acts as an overlap resistance that lines up with the 50% Fibonacci retracement and could reverse to the 1st support.
Pivot: 1.1691
1st Support: 1.1391
1st Resistance: 1.1811
Risk Warning:
Trading Forex and CFDs carries a high level of risk to your capital and you should only trade with money you can afford to lose. Trading Forex and CFDs may not be suitable for all investors, so please ensure that you fully understand the risks involved and seek independent advice if necessary.
Disclaimer:
The above opinions given constitute general market commentary, and do not constitute the opinion or advice of IC Markets or any form of personal or investment advice.
Any opinions, news, research, analyses, prices, other information, or links to third-party sites contained on this website are provided on an "as-is" basis, are intended only to be informative, is not an advice nor a recommendation, nor research, or a record of our trading prices, or an offer of, or solicitation for a transaction in any financial instrument and thus should not be treated as such. The information provided does not involve any specific investment objectives, financial situation and needs of any specific person who may receive it. Please be aware, that past performance is not a reliable indicator of future performance and/or results. Past Performance or Forward-looking scenarios based upon the reasonable beliefs of the third-party provider are not a guarantee of future performance. Actual results may differ materially from those anticipated in forward-looking or past performance statements. IC Markets makes no representation or warranty and assumes no liability as to the accuracy or completeness of the information provided, nor any loss arising from any investment based on a recommendation, forecast or any information supplied by any third-party.

EURJPY 4hour TF - August 3rd,2025🟦 EURJPY 4H Analysis Bearish Idea
📅 August 3, 2025
🔹 Top-Down Trend Bias:
• Monthly – Bullish
• Weekly – Bullish
• Daily – Bullish
• 4H – Bearish
EURJPY has pulled back through the previous support zone around 171.000 and is currently consolidating after a sharp bearish move. Short term trend remains bearish, but higher timeframes suggest this may be a corrective phase.
🔍 Key Zone: 171.00 – 171.70
This zone represents the 38.2% fib retracement and prior structure. A rejection from this area could trigger further downside, while a break above may confirm a higher low.
✅ Scenario A: Bearish Continuation (Blue Path)
1.If price taps into 171.00–171.70 and rejects
2.Look for bearish confirmation (rejection wick, bearish engulfing, BOS)
Target: 169.60 (key support)
This setup follows short term momentum and offers clean R:R into prior liquidity.
⚠️ Scenario B: Bullish Break & Hold (Orange Path)
1.If price breaks and closes above 172.250
2.Watch for continuation toward 173.750, our extended fib target
3.Structure shift + bullish PA would align with HTF bullish trend
This would confirm strength returning to the pair, ideal for HTF trend continuation traders.
🧠 Final Notes
• 171.00–171.70 is the reaction zone to watch
• HTFs remain bullish, but 4H momentum must flip to validate upside
• Let price confirm direction

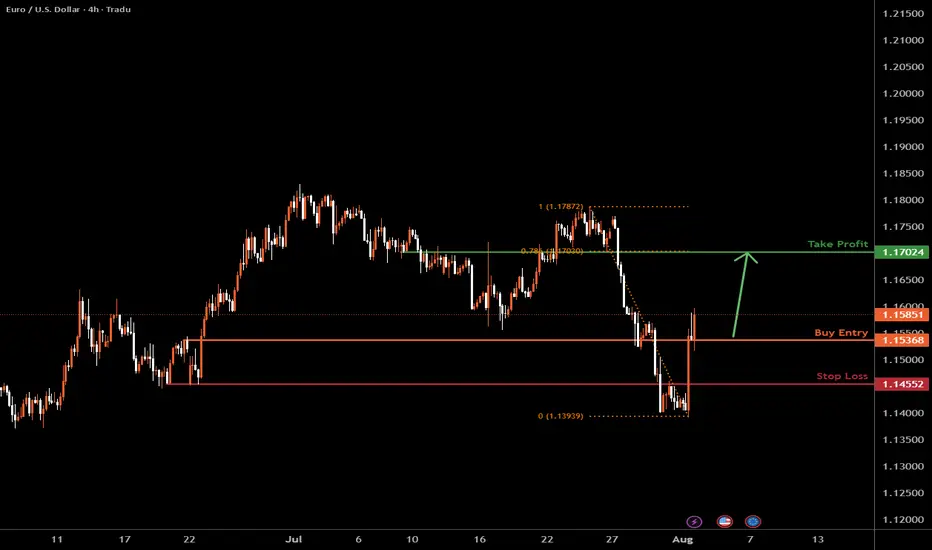
The Fiber H4 | Bullish riseEUR/USD has bounced off the support level, which serves as a pullback support and could potentially rise from this level to our take-profit target.
Buy entry is at 1.1585, which is a pullback support.
Stop loss is at 1.1455, which is a pullback support.
Take profit is at 1.1702, which is a pullback resistance that aligns with the 78.6% Fibonacci retracement.
High Risk Investment Warning
Trading Forex/CFDs on margin carries a high level of risk and may not be suitable for all investors. Leverage can work against you.
Stratos Markets Limited (tradu.com ):
CFDs are complex instruments and come with a high risk of losing money rapidly due to leverage. 65% of retail investor accounts lose money when trading CFDs with this provider. You should consider whether you understand how CFDs work and whether you can afford to take the high risk of losing your money.
Stratos Europe Ltd (tradu.com ):
CFDs are complex instruments and come with a high risk of losing money rapidly due to leverage. 66% of retail investor accounts lose money when trading CFDs with this provider. You should consider whether you understand how CFDs work and whether you can afford to take the high risk of losing your money.
Stratos Global LLC (tradu.com):
Losses can exceed deposits.
Please be advised that the information presented on TradingView is provided to Tradu (‘Company’, ‘we’) by a third-party provider (‘TFA Global Pte Ltd’). Please be reminded that you are solely responsible for the trading decisions on your account. There is a very high degree of risk involved in trading. Any information and/or content is intended entirely for research, educational and informational purposes only and does not constitute investment or consultation advice or investment strategy. The information is not tailored to the investment needs of any specific person and therefore does not involve a consideration of any of the investment objectives, financial situation or needs of any viewer that may receive it. Kindly also note that past performance is not a reliable indicator of future results. Actual results may differ materially from those anticipated in forward-looking or past performance statements. We assume no liability as to the accuracy or completeness of any of the information and/or content provided herein and the Company cannot be held responsible for any omission, mistake nor for any loss or damage including without limitation to any loss of profit which may arise from reliance on any information supplied by TFA Global Pte Ltd.
The speaker(s) is neither an employee, agent nor representative of Tradu and is therefore acting independently. The opinions given are their own, constitute general market commentary, and do not constitute the opinion or advice of Tradu or any form of personal or investment advice. Tradu neither endorses nor guarantees offerings of third-party speakers, nor is Tradu responsible for the content, veracity or opinions of third-party speakers, presenters or participants.
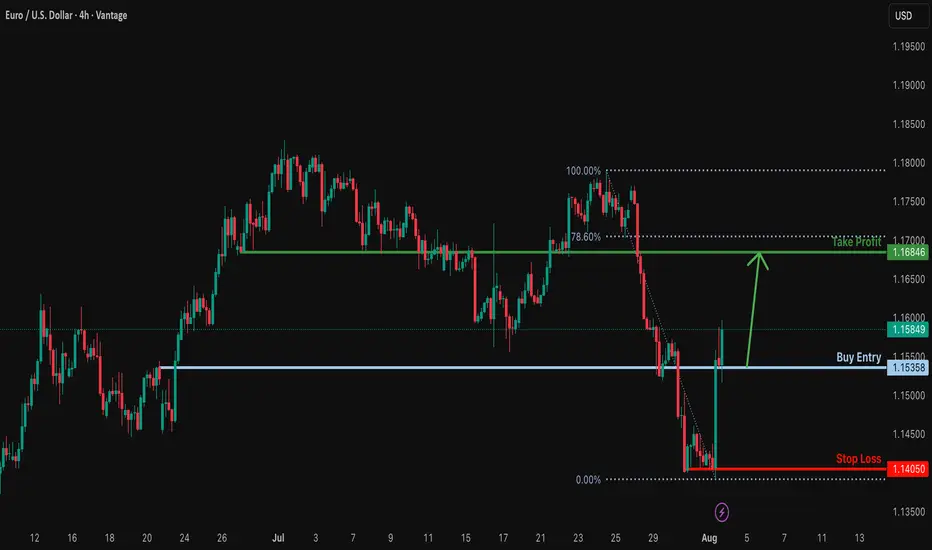
Bullish rise?EUR/USD has reacted off the support level and could potentially rise from this level to our takeprofit.
Entry: 1.1535
Why we like it:
There is a pullback support.
Stop loss: 1.1405
Why we like it:
There is a swing low support.
Take profit: 1.1684
Why we like it:
There is a pullback resistance that is slightly below the 78.6% Fibonacci retracement.
Enjoying your TradingView experience? Review us!
Please be advised that the information presented on TradingView is provided to Vantage (‘Vantage Global Limited’, ‘we’) by a third-party provider (‘Everest Fortune Group’). Please be reminded that you are solely responsible for the trading decisions on your account. There is a very high degree of risk involved in trading. Any information and/or content is intended entirely for research, educational and informational purposes only and does not constitute investment or consultation advice or investment strategy. The information is not tailored to the investment needs of any specific person and therefore does not involve a consideration of any of the investment objectives, financial situation or needs of any viewer that may receive it. Kindly also note that past performance is not a reliable indicator of future results. Actual results may differ materially from those anticipated in forward-looking or past performance statements. We assume no liability as to the accuracy or completeness of any of the information and/or content provided herein and the Company cannot be held responsible for any omission, mistake nor for any loss or damage including without limitation to any loss of profit which may arise from reliance on any information supplied by Everest Fortune Group.
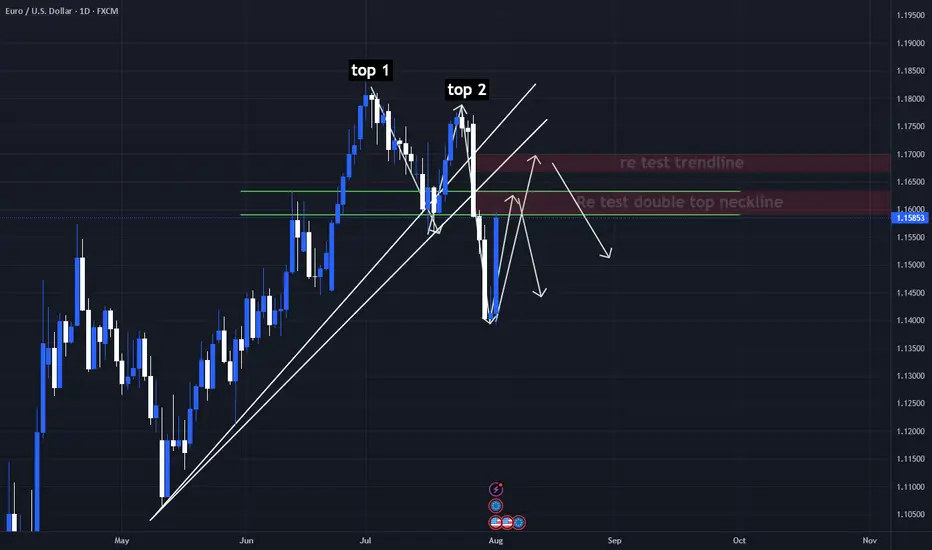
EURUSD Current Market Situation Technical Analysis Current Market Situation
The chart displays a Double Top pattern, a strong bearish reversal signal that often indicates the start of a downward move.
The price has already broken the neckline, and it is now approaching a retest of both the neckline and the broken trendline, which serves as a critical resistance area for potential bearish continuation.
Key Zones
Neckline Retest Zone: Around 1.1600, acting as immediate resistance.
Trendline Retest Zone: Between 1.1670 – 1.1700, serving as an additional resistance level to confirm the bearish bias.
Potential Scenarios
✅ Bearish Scenario (Preferred):
If price respects the retest zones and fails to break higher, we may see a decline toward:
Target 1: 1.1500
Target 2: 1.1400
Target 3: 1.1300
⚠ Bullish Scenario (Alternative):
A clear breakout and daily close above 1.1700 would invalidate the bearish outlook and could lead to a bullish reversal.
Conclusion
The market structure currently favors the bears.
Rejection from the neckline or trendline retest zones will provide a strong confirmation for sell positions.
⚠️ Trade at your own risk – We are not responsible for any losses.
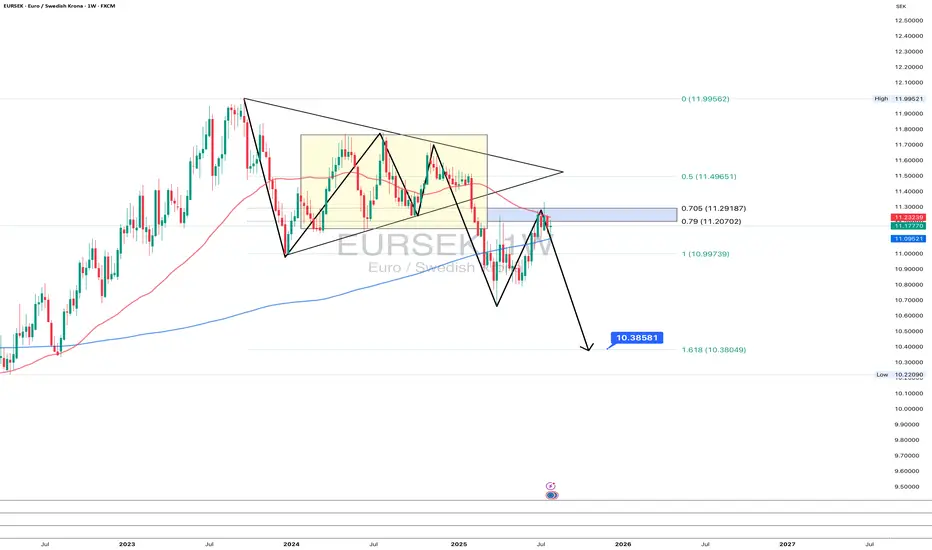
EURSEK 1W: triangle breakdown - bearish retest in playOn the weekly chart, EURSEK completed a symmetrical triangle pattern followed by a clean breakdown. The recent bullish move is now testing the 0.705–0.79 Fibo zone ($11.29–11.20), which aligns with the lower boundary of the former consolidation and 200 EMA resistance. So far, the price fails to break and hold above — suggesting a bearish continuation is likely.
Technical outlook:
Symmetrical triangle broke downward
Price is retesting Fibo zone 0.705–0.79
Strong resistance near 11.29
EMA200 adds overhead pressure
Next downside target: 1.618 Fibo at 10.38
From a macro perspective, the Swedish krona is holding better due to domestic rate expectations, while the euro may weaken further if the ECB pauses tightening. If the trend holds, EURSEK could break 11.00 and head toward 10.38 in the coming weeks.
When structure and fundamentals align - markets tend to follow.
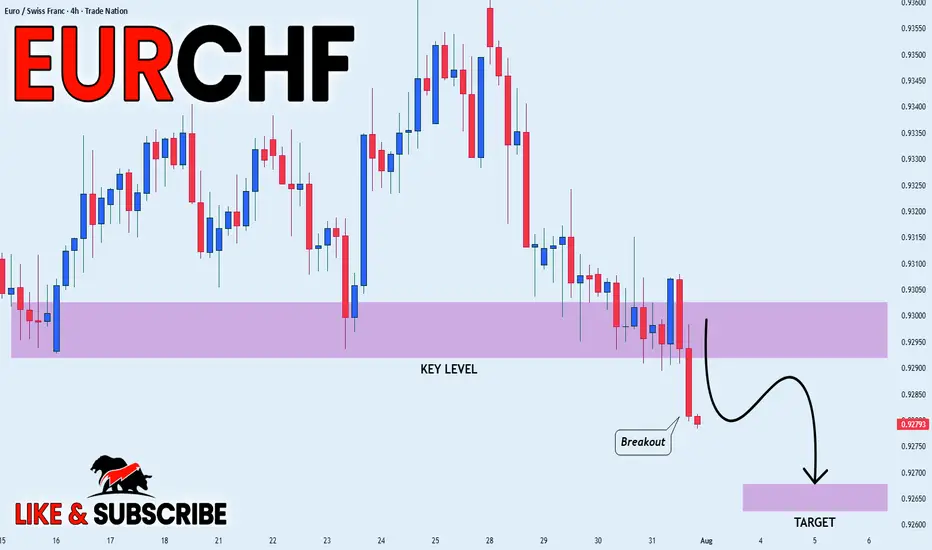
EUR/CHF SHORT FROM RESISTANCE
Hello, Friends!
EUR/CHF pair is in the uptrend because previous week’s candle is green, while the price is obviously rising on the 5H timeframe. And after the retest of the resistance line above I believe we will see a move down towards the target below at 0.926 because the pair overbought due to its proximity to the upper BB band and a bearish correction is likely.
Disclosure: I am part of Trade Nation's Influencer program and receive a monthly fee for using their TradingView charts in my analysis.
✅LIKE AND COMMENT MY IDEAS✅

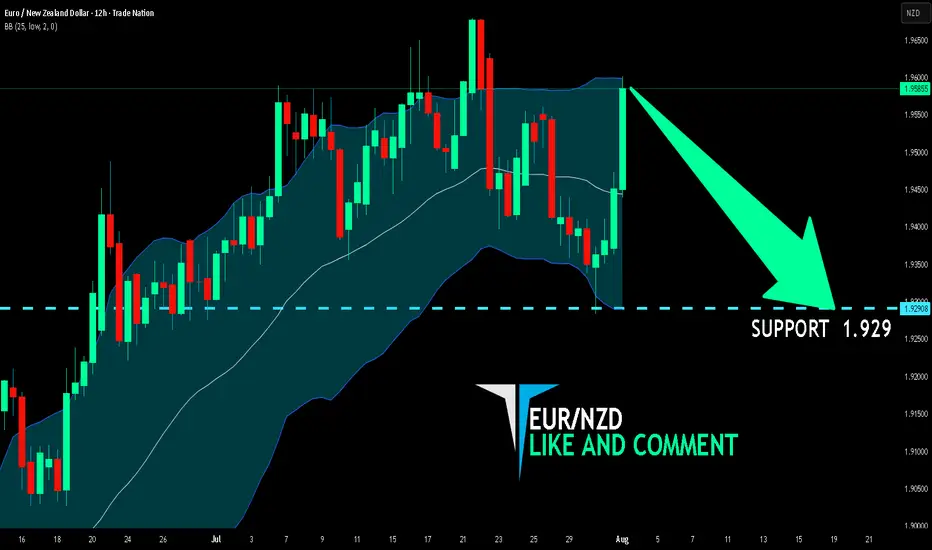
EUR/NZD BEARS WILL DOMINATE THE MARKET|SHORT
Hello, Friends!
EUR/NZD pair is trading in a local uptrend which we know by looking at the previous 1W candle which is green. On the 12H timeframe the pair is going up too. The pair is overbought because the price is close to the upper band of the BB indicator. So we are looking to sell the pair with the upper BB line acting as resistance. The next target is 1.929 area.
Disclosure: I am part of Trade Nation's Influencer program and receive a monthly fee for using their TradingView charts in my analysis.
✅LIKE AND COMMENT MY IDEAS✅
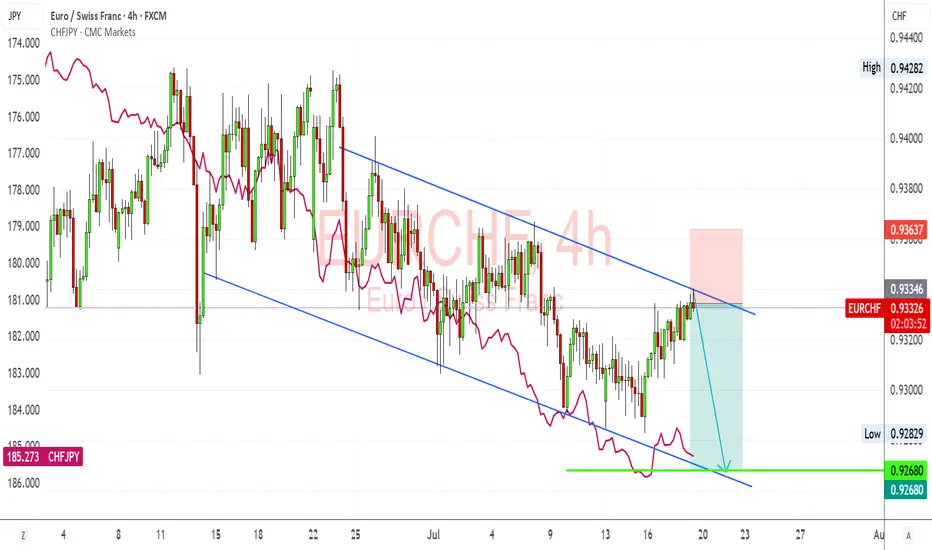
EURCHF – Bearish Channel Holds Firm, CHF Strength Set to ResumeEURCHF just tapped into the descending channel resistance again and is showing signs of rejecting. I'm expecting a bearish continuation here, especially given the strong CHF momentum recently, supported by safe-haven flows and Swiss inflation stability. If the pair fails to break above 0.9340, I’m watching for a downside push back toward 0.9270–0.9265, completing another leg within the structure.
🔍 Technical Setup (4H):
Channel Structure: EURCHF remains firmly within a downward-sloping parallel channel since mid-June.
Resistance Rejection: Price recently tested upper channel resistance (~0.9335–0.9340 zone), aligning with trendline rejection.
Target Support: 0.9270–0.9265 (channel base and key horizontal level).
Confluence: CHFJPY overlay (pink line) is rising again, suggesting renewed CHF strength—this usually weighs on EURCHF.
💡 Fundamental Insight:
EUR Side:
ECB officials remain cautious, but with recent EU data showing weaker growth (especially PMIs and sentiment), euro upside is capped.
The ECB is likely to pause further tightening, while other central banks like SNB remain firm on inflation risks.
CHF Strength:
The Swiss National Bank (SNB) still leans hawkish, with stable inflation giving room to hold rates steady or tighten if needed.
CHF benefits from risk-off flows amid global tariff headlines, China slowdown, and Middle East tensions.
Rising CHFJPY = clear CHF strength across the board.
⚠️ Risks:
If eurozone data surprises to the upside (e.g., inflation rebounds), EURCHF could break out of the channel.
A sudden drop in geopolitical tension or strong risk-on rally could weaken CHF as safe-haven demand falls.
SNB jawboning or FX intervention is always a wildcard.
🧭 Summary:
I’m bearish on EURCHF while it respects this well-defined descending channel. The technicals show consistent lower highs and lower lows, while the fundamentals continue to support CHF strength due to risk aversion, stable inflation, and a resilient SNB. My short bias is valid as long as price remains below 0.9340, with downside targets at 0.9270–0.9265. CHFJPY rising confirms franc leadership across FX markets, and EURCHF is likely a lagger following broader CHF strength.
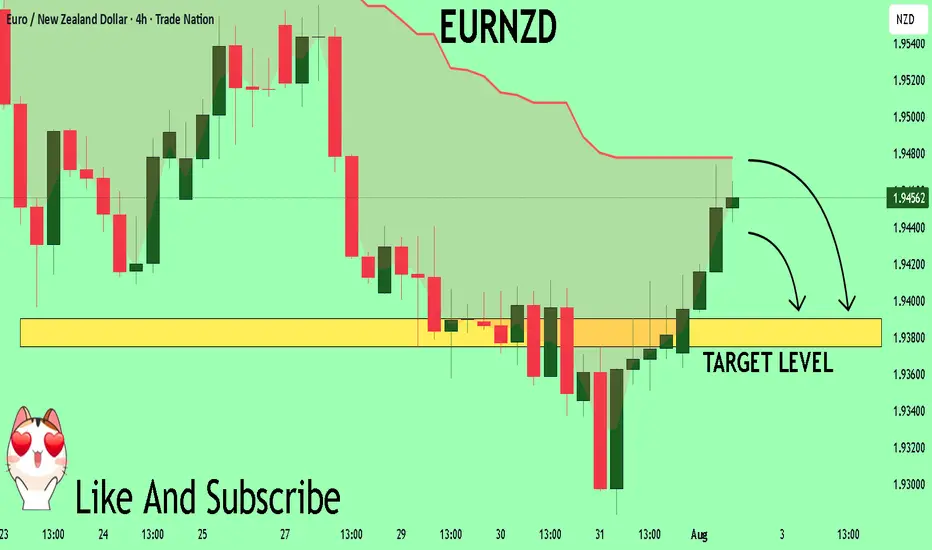
EURNZD Set To Fall! SELL!
My dear subscribers,
This is my opinion on the EURNZD next move:
The instrument tests an important psychological level 1.9459
Bias - Bearish
Technical Indicators: Supper Trend gives a precise Bearish signal, while Pivot Point HL predicts price changes and potential reversals in the market.
Target - 1.9390
About Used Indicators:
On the subsequent day, trading above the pivot point is thought to indicate ongoing bullish sentiment, while trading below the pivot point indicates bearish sentiment.
Disclosure: I am part of Trade Nation's Influencer program and receive a monthly fee for using their TradingView charts in my analysis.
———————————
WISH YOU ALL LUCK
Bearish drop?The Fiber (EUR/USD) has rejected off the pivot and could potentially drop to the 1st support, which acts as an overlap support.
Pivot: 1.1457
1st Support: 1.1372
1st Resistance: 1.1534
Risk Warning:
Trading Forex and CFDs carries a high level of risk to your capital and you should only trade with money you can afford to lose. Trading Forex and CFDs may not be suitable for all investors, so please ensure that you fully understand the risks involved and seek independent advice if necessary.
Disclaimer:
The above opinions given constitute general market commentary, and do not constitute the opinion or advice of IC Markets or any form of personal or investment advice.
Any opinions, news, research, analyses, prices, other information, or links to third-party sites contained on this website are provided on an "as-is" basis, are intended only to be informative, is not an advice nor a recommendation, nor research, or a record of our trading prices, or an offer of, or solicitation for a transaction in any financial instrument and thus should not be treated as such. The information provided does not involve any specific investment objectives, financial situation and needs of any specific person who may receive it. Please be aware, that past performance is not a reliable indicator of future performance and/or results. Past Performance or Forward-looking scenarios based upon the reasonable beliefs of the third-party provider are not a guarantee of future performance. Actual results may differ materially from those anticipated in forward-looking or past performance statements. IC Markets makes no representation or warranty and assumes no liability as to the accuracy or completeness of the information provided, nor any loss arising from any investment based on a recommendation, forecast or any information supplied by any third-party.
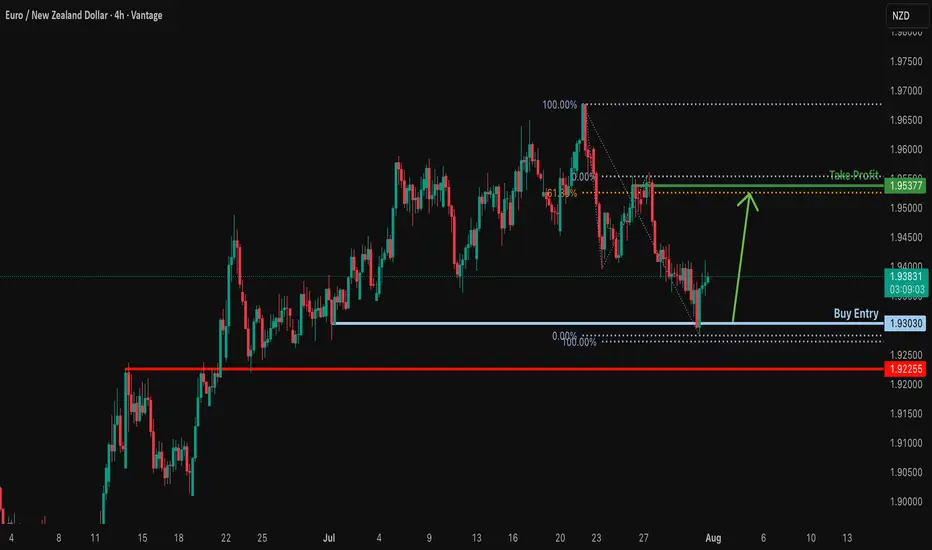
Bullish bounce off pullback support?EUR/NZD has bounced off the support level, which is a pullback support and could rise from this level to our take profit.
Entry: 1.93030
Why we like it:
There is a pullback support.
Stop loss: 1.92255
Why we like it:
There is an overlap support
Take profit: 1.95377
Why we like it:
There is a swing high resistance that lines up with the 61.8% Fibonacci retracement.
Enjoying your TradingView experience? Review us!
Please be advised that the information presented on TradingView is provided to Vantage (‘Vantage Global Limited’, ‘we’) by a third-party provider (‘Everest Fortune Group’). Please be reminded that you are solely responsible for the trading decisions on your account. There is a very high degree of risk involved in trading. Any information and/or content is intended entirely for research, educational and informational purposes only and does not constitute investment or consultation advice or investment strategy. The information is not tailored to the investment needs of any specific person and therefore does not involve a consideration of any of the investment objectives, financial situation or needs of any viewer that may receive it. Kindly also note that past performance is not a reliable indicator of future results. Actual results may differ materially from those anticipated in forward-looking or past performance statements. We assume no liability as to the accuracy or completeness of any of the information and/or content provided herein and the Company cannot be held responsible for any omission, mistake nor for any loss or damage including without limitation to any loss of profit which may arise from reliance on any information supplied by Everest Fortune Group.
EUR_CHF WILL KEEP FALLING|SHORT|
✅EUR_CHF broke the key
Structure level of 0.9295
While trading in an local downtrend
Which makes me bearish
And I think that after the retest of the
Broken level is complete
A rebound and bearish
Continuation will follow
SHORT🔥
✅Like and subscribe to never miss a new idea!✅
Disclosure: I am part of Trade Nation's Influencer program and receive a monthly fee for using their TradingView charts in my analysis.
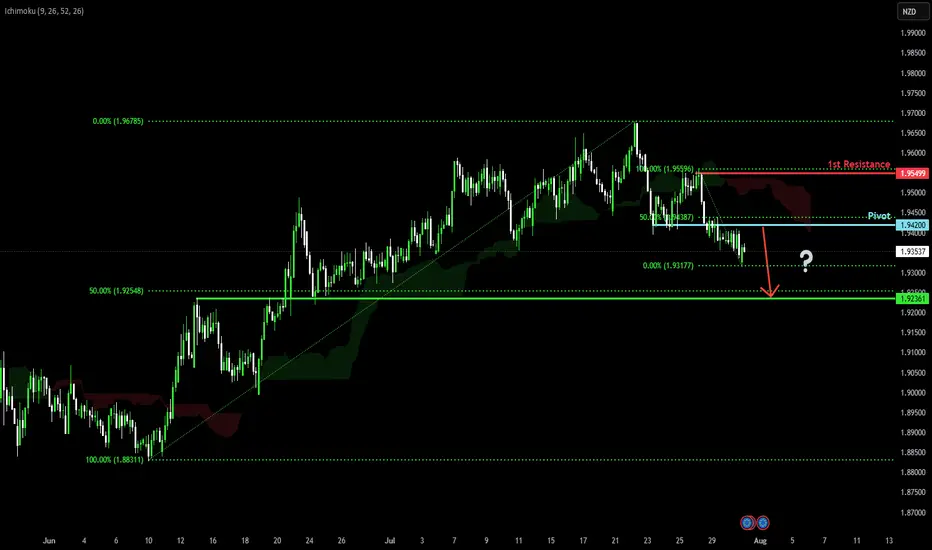
Potential bearish drop?EUR/NZD has rejected off the pivot and could drop to the overlap support.
Pivot: 1.94200
1st Support: 1.92361
1st Resistance: 1.95499
Risk Warning:
Trading Forex and CFDs carries a high level of risk to your capital and you should only trade with money you can afford to lose. Trading Forex and CFDs may not be suitable for all investors, so please ensure that you fully understand the risks involved and seek independent advice if necessary.
Disclaimer:
The above opinions given constitute general market commentary, and do not constitute the opinion or advice of IC Markets or any form of personal or investment advice.
Any opinions, news, research, analyses, prices, other information, or links to third-party sites contained on this website are provided on an "as-is" basis, are intended only to be informative, is not an advice nor a recommendation, nor research, or a record of our trading prices, or an offer of, or solicitation for a transaction in any financial instrument and thus should not be treated as such. The information provided does not involve any specific investment objectives, financial situation and needs of any specific person who may receive it. Please be aware, that past performance is not a reliable indicator of future performance and/or results. Past Performance or Forward-looking scenarios based upon the reasonable beliefs of the third-party provider are not a guarantee of future performance. Actual results may differ materially from those anticipated in forward-looking or past performance statements. IC Markets makes no representation or warranty and assumes no liability as to the accuracy or completeness of the information provided, nor any loss arising from any investment based on a recommendation, forecast or any information supplied by any third-party.
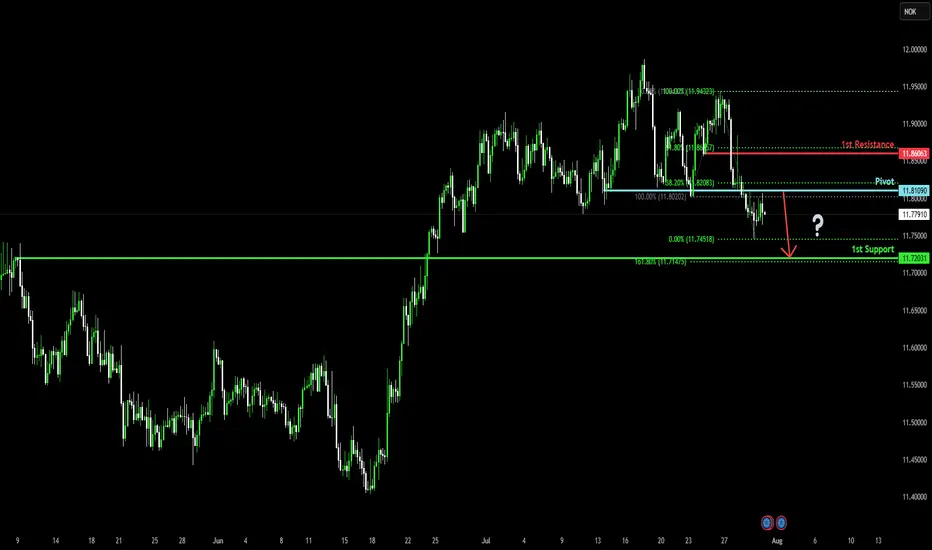
Bearish drop?EUR/NOK has rejected off the pivot, which acts as a pullback resistance, and could drop to the 1st support, which is a pullback support that lines up with the 161.8% Fibonacci extension.
Pivot: 11.81090
1st Support: 11.72031
1st Resistance: 11.86063
Risk Warning:
Trading Forex and CFDs carries a high level of risk to your capital and you should only trade with money you can afford to lose. Trading Forex and CFDs may not be suitable for all investors, so please ensure that you fully understand the risks involved and seek independent advice if necessary.
Disclaimer:
The above opinions given constitute general market commentary, and do not constitute the opinion or advice of IC Markets or any form of personal or investment advice.
Any opinions, news, research, analyses, prices, other information, or links to third-party sites contained on this website are provided on an "as-is" basis, are intended only to be informative, is not an advice nor a recommendation, nor research, or a record of our trading prices, or an offer of, or solicitation for a transaction in any financial instrument and thus should not be treated as such. The information provided does not involve any specific investment objectives, financial situation and needs of any specific person who may receive it. Please be aware, that past performance is not a reliable indicator of future performance and/or results. Past Performance or Forward-looking scenarios based upon the reasonable beliefs of the third-party provider are not a guarantee of future performance. Actual results may differ materially from those anticipated in forward-looking or past performance statements. IC Markets makes no representation or warranty and assumes no liability as to the accuracy or completeness of the information provided, nor any loss arising from any investment based on a recommendation, forecast or any information supplied by any third-party.
EURUSD H4 | Bearish reversal off overlap resistanceThe Fiber (EUR/USD) is rising towards the sell entry, which is an overlap resistance and could drop lower.
Sell entry is at 1.1452, which is an overlap resistance.
Stop loss is at 1.1536, which is a pullback resistance that lines up with the 38.2% Fibonacci retracement.
Take profit is at 1.1323, which is a pullback support that is slightly below the 78.6% Fibonacci retracement.
High Risk Investment Warning
Trading Forex/CFDs on margin carries a high level of risk and may not be suitable for all investors. Leverage can work against you.
Stratos Markets Limited (tradu.com ):
CFDs are complex instruments and come with a high risk of losing money rapidly due to leverage. 65% of retail investor accounts lose money when trading CFDs with this provider. You should consider whether you understand how CFDs work and whether you can afford to take the high risk of losing your money.
Stratos Europe Ltd (tradu.com ):
CFDs are complex instruments and come with a high risk of losing money rapidly due to leverage. 66% of retail investor accounts lose money when trading CFDs with this provider. You should consider whether you understand how CFDs work and whether you can afford to take the high risk of losing your money.
Stratos Global LLC (tradu.com ):
Losses can exceed deposits.
Please be advised that the information presented on TradingView is provided to Tradu (‘Company’, ‘we’) by a third-party provider (‘TFA Global Pte Ltd’). Please be reminded that you are solely responsible for the trading decisions on your account. There is a very high degree of risk involved in trading. Any information and/or content is intended entirely for research, educational and informational purposes only and does not constitute investment or consultation advice or investment strategy. The information is not tailored to the investment needs of any specific person and therefore does not involve a consideration of any of the investment objectives, financial situation or needs of any viewer that may receive it. Kindly also note that past performance is not a reliable indicator of future results. Actual results may differ materially from those anticipated in forward-looking or past performance statements. We assume no liability as to the accuracy or completeness of any of the information and/or content provided herein and the Company cannot be held responsible for any omission, mistake nor for any loss or damage including without limitation to any loss of profit which may arise from reliance on any information supplied by TFA Global Pte Ltd.
The speaker(s) is neither an employee, agent nor representative of Tradu and is therefore acting independently. The opinions given are their own, constitute general market commentary, and do not constitute the opinion or advice of Tradu or any form of personal or investment advice. Tradu neither endorses nor guarantees offerings of third-party speakers, nor is Tradu responsible for the content, veracity or opinions of third-party speakers, presenters or participants.
