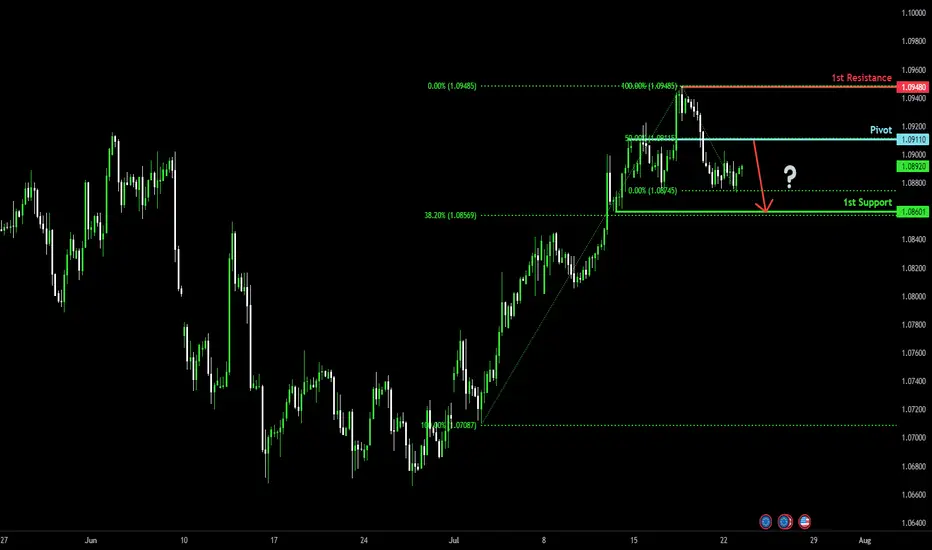
Heading into 50% Fibonacci resistance?The Fiber (EUR/USD) is rising towards the pivot and could reverse to the pullback support level.
Pivot: 1.0911
1st Support: 1.0860
1st Resistance: 1.0948
Risk Warning:
Trading Forex and CFDs carries a high level of risk to your capital and you should only trade with money you can afford to lose. Trading Forex and CFDs may not be suitable for all investors, so please ensure that you fully understand the risks involved and seek independent advice if necessary.
Disclaimer:
The above opinions given constitute general market commentary, and do not constitute the opinion or advice of IC Markets or any form of personal or investment advice.
Any opinions, news, research, analyses, prices, other information, or links to third-party sites contained on this website are provided on an "as-is" basis, are intended only to be informative, is not an advice nor a recommendation, nor research, or a record of our trading prices, or an offer of, or solicitation for a transaction in any financial instrument and thus should not be treated as such. The information provided does not involve any specific investment objectives, financial situation and needs of any specific person who may receive it. Please be aware, that past performance is not a reliable indicator of future performance and/or results. Past Performance or Forward-looking scenarios based upon the reasonable beliefs of the third-party provider are not a guarantee of future performance. Actual results may differ materially from those anticipated in forward-looking or past performance statements. IC Markets makes no representation or warranty and assumes no liability as to the accuracy or completeness of the information provided, nor any loss arising from any investment based on a recommendation, forecast or any information supplied by any third-party.
Eur-usd
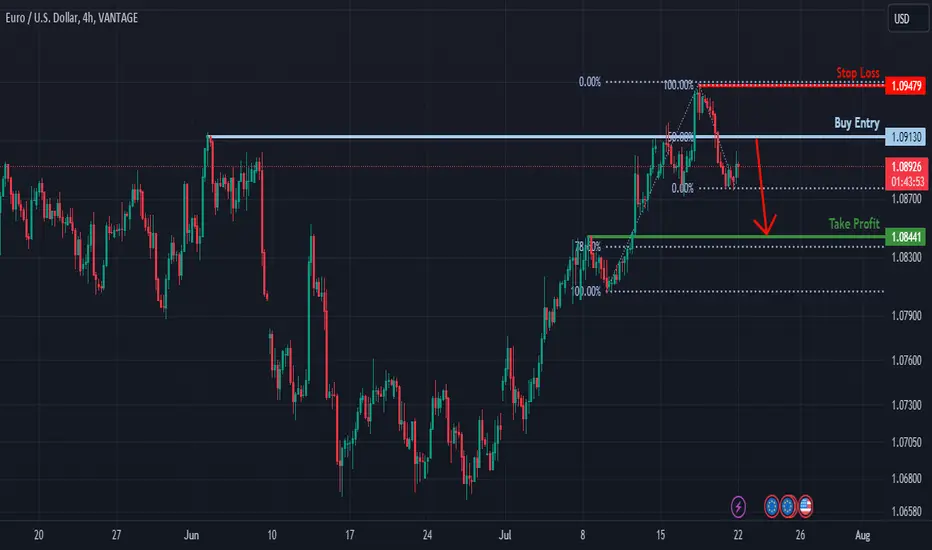
Heading into 50% Fibonacci resistance?EUR/USD is rising towards the resistance level which is a pullback resistance that aligns with the 50% Fibonacci retracement and could reverse from this level to our take profit.
Entry: 1.0913
Why we like it:
There is a pullback resistance level which lines up with the 50% Fibonacci retracement.
Stop loss: 1.0947
Why we like it:
There is a pullback resistance level.
Take profit: 1.0844
Why we like it:
There is a pullback support level which aligns with the 78.6% Fibonacci retracement.
Please be advised that the information presented on TradingView is provided to Vantage (‘Vantage Global Limited’, ‘we’) by a third-party provider (‘Everest Fortune Group’). Please be reminded that you are solely responsible for the trading decisions on your account. There is a very high degree of risk involved in trading. Any information and/or content is intended entirely for research, educational and informational purposes only and does not constitute investment or consultation advice or investment strategy. The information is not tailored to the investment needs of any specific person and therefore does not involve a consideration of any of the investment objectives, financial situation or needs of any viewer that may receive it. Kindly also note that past performance is not a reliable indicator of future results. Actual results may differ materially from those anticipated in forward-looking or past performance statements. We assume no liability as to the accuracy or completeness of any of the information and/or content provided herein and the Company cannot be held responsible for any omission, mistake nor for any loss or damage including without limitation to any loss of profit which may arise from reliance on any information supplied by Everest Fortune Group.
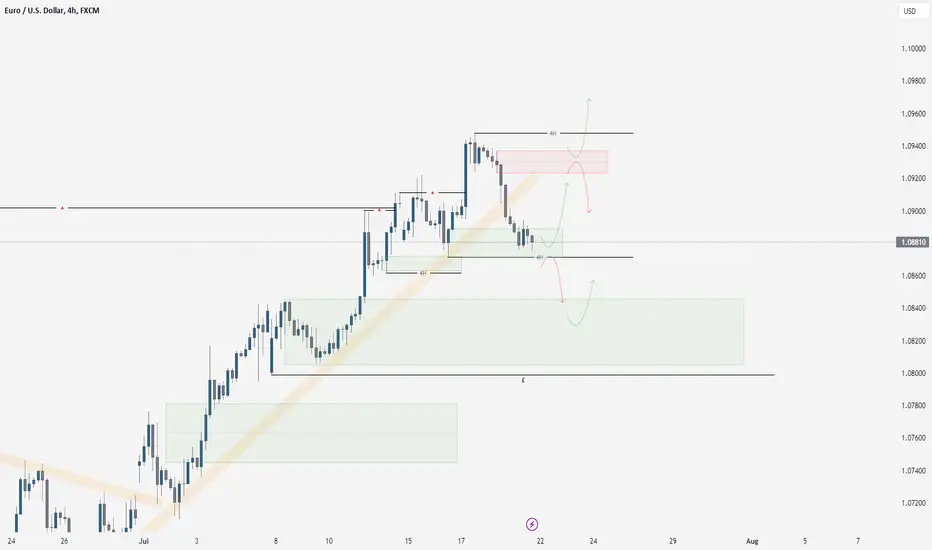
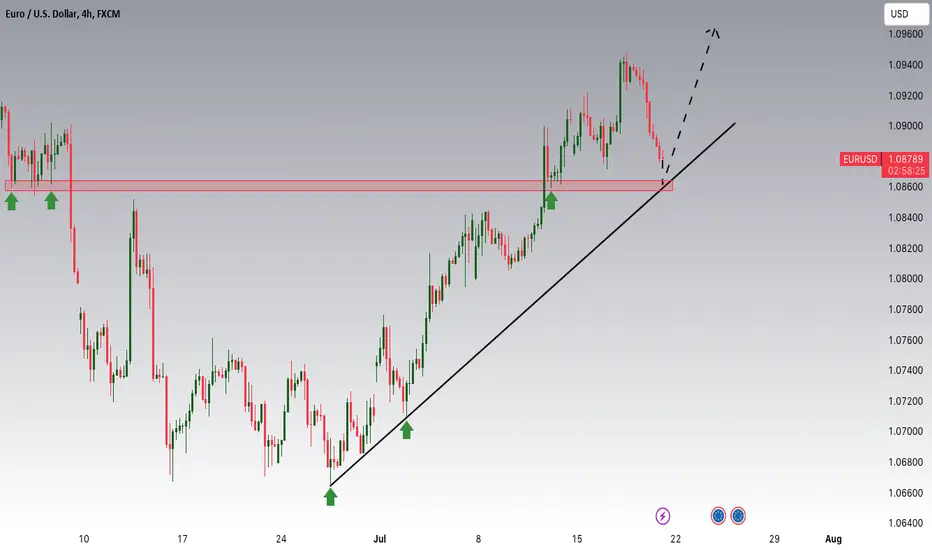
EURUSD 21/7/24Here is EUR/USD. Following on from last week, we provided a basic trend continuation idea that played out perfectly, even though it went against the higher time frame bias established earlier this year. We are now looking at a variation of this same trend movement. We have seen a break of the potential liquidity stored across the lows in the form of trendline liquidity. This could be an early indication that we may be shifting structure, which would then suggest that the price is going to change direction and follow the higher time frame bias once again.
Coming into this week, I have three ideas on the table:
1. We play bullish from the area of demand that we are currently sitting in, and the price pushes up and continues the four-hour trend. For example, it will take the four-hour high, which is placed at the upper end of our chart. That would be a trend continuation movement.
2. We push higher from the area of demand, as in the first idea, but in this case, we play off the area of supply, which also lines up with a retest of the liquidity trendline break. If this happens, I would expect the price to play below the four-hour low later this week, bringing us back to a bearish structural bias.
3. The area of demand that we currently sit in fails, and the price breaks the four-hour low, giving us a bearish structure from the first session of the week. I will then be looking for a pullback into the newly established bearish range. Of course, we follow what the price shows us and take what we are given in terms of market movement.
Wishing you all a successful trading week. Trade safe and always follow your plan.
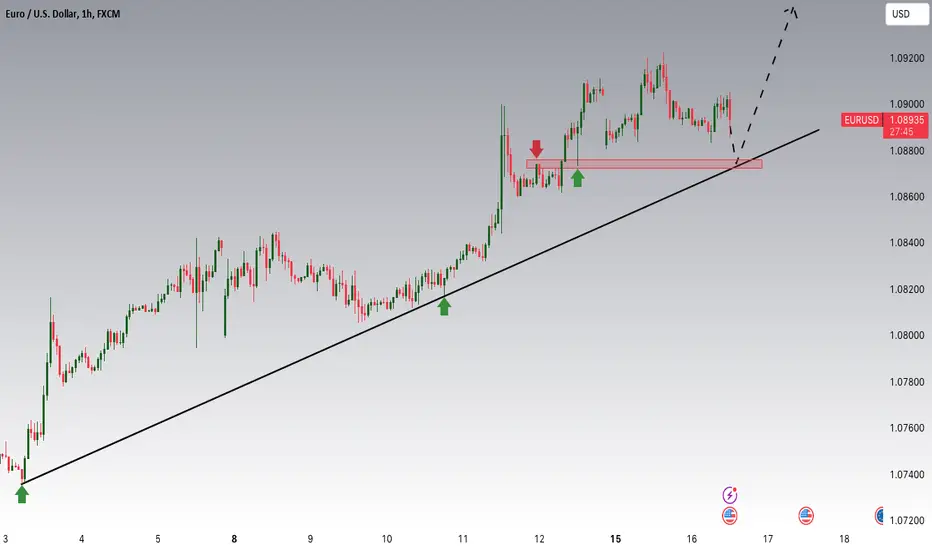
EURUSD Is Approaching An Important Support ZoneHey Traders, in today's trading session we are monitoring EURUSD for a buying opportunity around 1.08600 zone, EURUSD is trading in an uptrend and currently is in a correction phase in which it is approaching the trend at 1.08600 support and resistance area.
Trade safe, Joe.
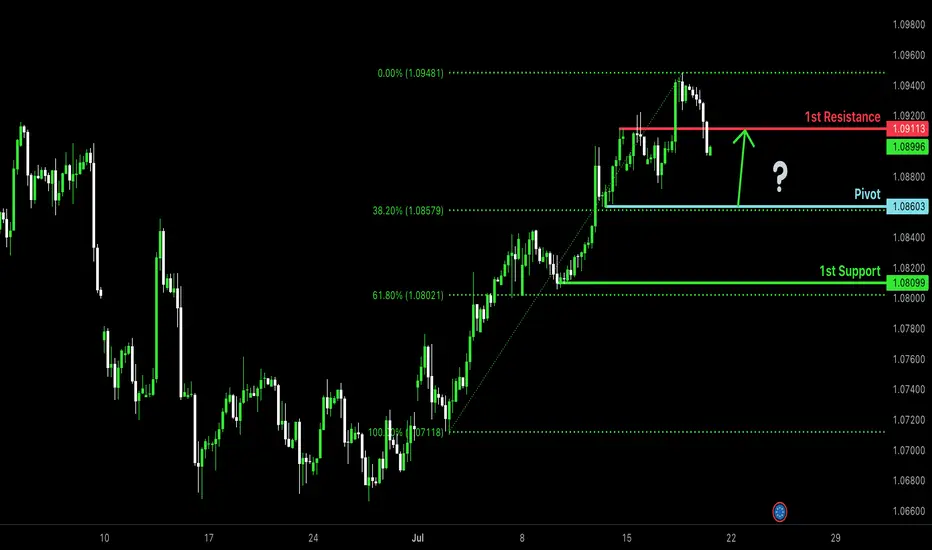
Bullish bounce?The Fiber (EUR/USD) is falling towards the pivot which has been identified as a pullback support and could bounce to the 1st resistance.
Pivot: 1.0860
1st Support: 1.0809
1st Resistance: 1.0911
Risk Warning:
Trading Forex and CFDs carries a high level of risk to your capital and you should only trade with money you can afford to lose. Trading Forex and CFDs may not be suitable for all investors, so please ensure that you fully understand the risks involved and seek independent advice if necessary.
Disclaimer:
The above opinions given constitute general market commentary, and do not constitute the opinion or advice of IC Markets or any form of personal or investment advice.
Any opinions, news, research, analyses, prices, other information, or links to third-party sites contained on this website are provided on an "as-is" basis, are intended only to be informative, is not an advice nor a recommendation, nor research, or a record of our trading prices, or an offer of, or solicitation for a transaction in any financial instrument and thus should not be treated as such. The information provided does not involve any specific investment objectives, financial situation and needs of any specific person who may receive it. Please be aware, that past performance is not a reliable indicator of future performance and/or results. Past Performance or Forward-looking scenarios based upon the reasonable beliefs of the third-party provider are not a guarantee of future performance. Actual results may differ materially from those anticipated in forward-looking or past performance statements. IC Markets makes no representation or warranty and assumes no liability as to the accuracy or completeness of the information provided, nor any loss arising from any investment based on a recommendation, forecast or any information supplied by any third-party.
Watch out for Lagarde's comments todayThe ECB is delivering its interest rate decision today, however, most of the action could happen during the press conference. Keep your eyes on that!
FX_IDC:EURUSD EASYMARKETS:EURUSD
Disclaimer:
easyMarkets Account on TradingView allows you to combine easyMarkets industry leading conditions, regulated trading and tight fixed spreads with TradingView's powerful social network for traders, advanced charting and analytics. Access no slippage on limit orders, tight fixed spreads, negative balance protection, no hidden fees or commission, and seamless integration.
Any opinions, news, research, analyses, prices, other information, or links to third-party sites contained on this website are provided on an "as-is" basis, are intended only to be informative, is not an advice nor a recommendation, nor research, or a record of our trading prices, or an offer of, or solicitation for a transaction in any financial instrument and thus should not be treated as such. The information provided does not involve any specific investment objectives, financial situation and needs of any specific person who may receive it. Please be aware, that past performance is not a reliable indicator of future performance and/or results. Past Performance or Forward-looking scenarios based upon the reasonable beliefs of the third-party provider are not a guarantee of future performance. Actual results may differ materially from those anticipated in forward-looking or past performance statements. easyMarkets makes no representation or warranty and assumes no liability as to the accuracy or completeness of the information provided, nor any loss arising from any investment based on a recommendation, forecast or any information supplied by any third-party.

EUR/USD: Biden Replacement and ECB Decision Loom Political uncertainty in the U.S. could significantly impact the EUR/USD as markets brace for tomorrow’s ECB decision. The major political factor may not if President Biden steps down, but who steps up to take his place. Who will the markets like and who will they dislike? This could play out in the EUR/USD.
Biden has said he will reevaluate his candidacy if advised by doctors due to health concerns, possibly setting the stage for his withdrawal from the presidential race. Notably, Democratic Representative Adam Schiff (California) is the latest major figure to urge Biden to step aside as the Democratic nominee for president.
Turning to the more traditional economic event, ING forecasts that the EUR/USD is more likely to hit 1.08 rather than 1.10 following tomorrow’s ECB meeting. The tip of the very clean and tight channel the pair has traveled in since June might suggest resistance at 1.0965.
The European Central Bank is expected to maintain rates steady, a month after its first rate cut in five years. A recent Reuters poll revealed analysts anticipate two additional 0.25 percentage point rate cuts this year, slated for September and December.
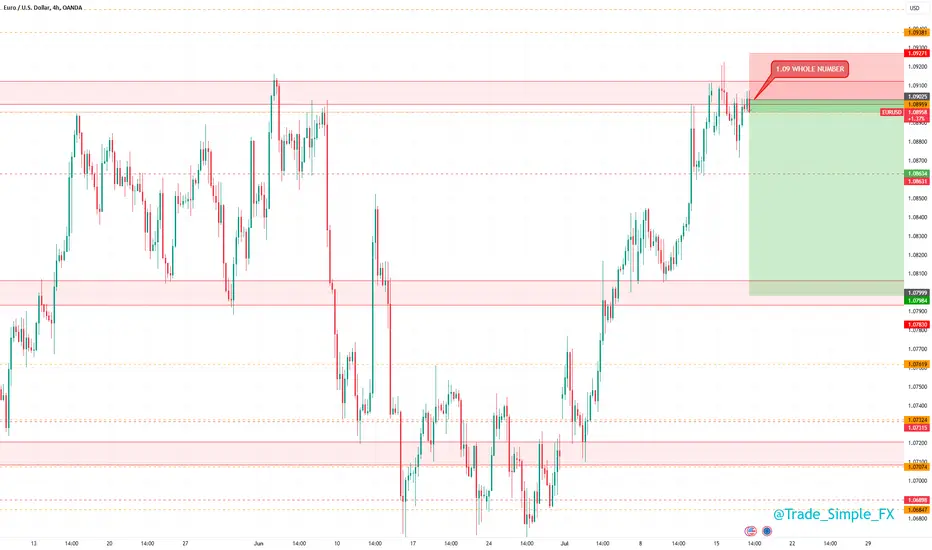
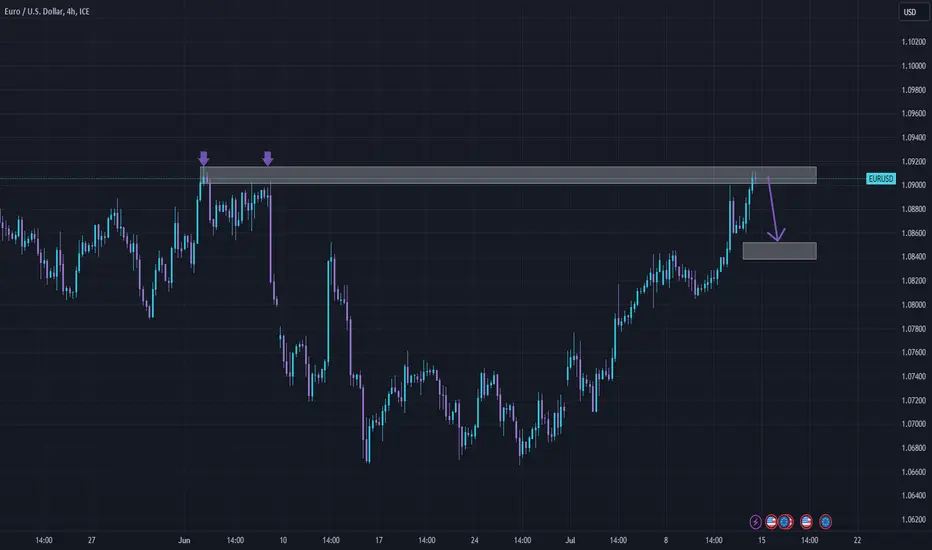
EURUSD H4 - Short Signal EURUSD H4
In addition to GBPUSD, we also have EURUSD which is at a key area of resistance. This 1.09 handle is acting as a whole number resistance price, amongst H4 supply and previous tested resistance. Certainly a good region and zone for a short confluence stack.
We will be following EURUSD, GBPUSD and DXY very closely this week as we are trading from some significant levels.
EURUSD: Easing Inflation And Potential UpsidesHey Traders, in today's trading session we are monitoring EURUSD for a buying opportunity around 1.08700, EURUSD is trading in an uptrend and currently is in a correction phase in which it is approaching the trend at 1.08700 support and resistance area.
we would also like to consider the current easing inflation in the US, the previous soft inflation data may take us to a potential upcoming rate cut and a dovish USD environment which should weaken the dollar over the medium term.
Trade Safe, Joe.
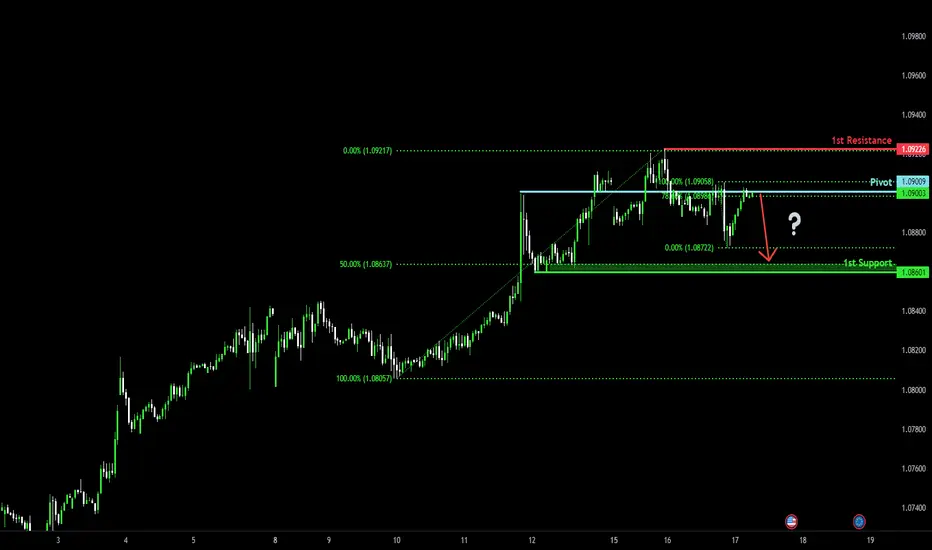
Bearish drop?The Fiber (EUR/USD) is reacting off the pivot and could potentially drop to the pullback support.
Pivot: 1.0900
1st Support: 1.0860
1st Resistance: 1.09226
Risk Warning:
Trading Forex and CFDs carries a high level of risk to your capital and you should only trade with money you can afford to lose. Trading Forex and CFDs may not be suitable for all investors, so please ensure that you fully understand the risks involved and seek independent advice if necessary.
Disclaimer:
The above opinions given constitute general market commentary, and do not constitute the opinion or advice of IC Markets or any form of personal or investment advice.
Any opinions, news, research, analyses, prices, other information, or links to third-party sites contained on this website are provided on an "as-is" basis, are intended only to be informative, is not an advice nor a recommendation, nor research, or a record of our trading prices, or an offer of, or solicitation for a transaction in any financial instrument and thus should not be treated as such. The information provided does not involve any specific investment objectives, financial situation and needs of any specific person who may receive it. Please be aware, that past performance is not a reliable indicator of future performance and/or results. Past Performance or Forward-looking scenarios based upon the reasonable beliefs of the third-party provider are not a guarantee of future performance. Actual results may differ materially from those anticipated in forward-looking or past performance statements. IC Markets makes no representation or warranty and assumes no liability as to the accuracy or completeness of the information provided, nor any loss arising from any investment based on a recommendation, forecast or any information supplied by any third-party.
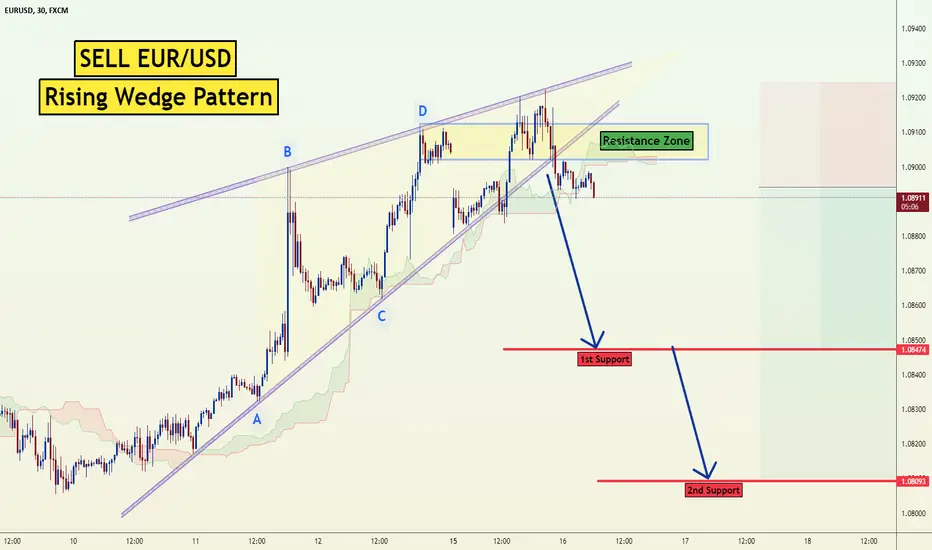
Sell EURUSD Wedge BreaoutThe EUR/USD pair on the M30 timeframe presents a potential selling opportunity due to a recent downward breakout from a well-defined Rising Wedge pattern. This suggests a shift in momentum towards the downside in the coming Hours.
Key Points:
Sell Entry: Consider entering a short position around the current price of 1.0895, positioned close to the breakout level. This offers an entry point near the perceived shift in momentum.
Target Levels:
1st Support – 1.0847
2nd Support – 1.0809
Stop-Loss: To manage risk, place a stop-loss order above 1.0925. This helps limit potential losses if the price unexpectedly reverses and breaks back upwards.
Thank you.
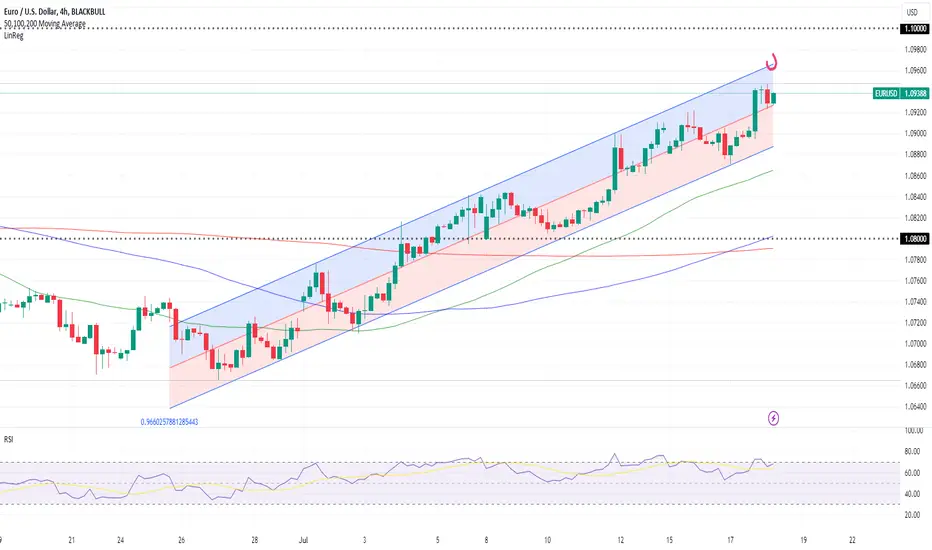
EURUSD Going for a Higher High rejection. Time the sell.The EURUSD pair has been trading within a Channel Up pattern and as we mentioned on our previous idea (July 08, see chart below), is aiming for a Higher High target at 1.09500:
Since last week, the price is getting closer to our Target and the top of the 3-month Channel Up. Based on the pattern's symmetry and the proportions between the Bullish/ Bearish Legs, once we reach 1.09500 we will reverse to a sell, targeting 1.07250 (bottom of Channel Up).
Technically, once the 4H RSI forms Higher Lows, the new bottom is formed.
-------------------------------------------------------------------------------
** Please LIKE 👍, FOLLOW ✅, SHARE 🙌 and COMMENT ✍ if you enjoy this idea! Also share your ideas and charts in the comments section below! This is best way to keep it relevant, support us, keep the content here free and allow the idea to reach as many people as possible. **
-------------------------------------------------------------------------------
💸💸💸💸💸💸
👇 👇 👇 👇 👇 👇

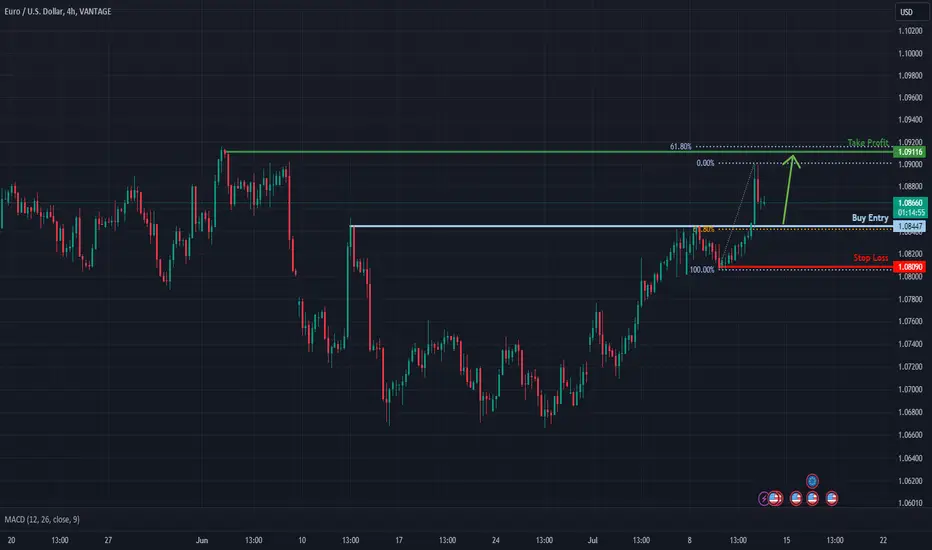
Falling towards the 61.8% Fibonacci support?EUR/USD is falling towards the support level which is a pullback support that aligns with the 61.8% Fibonacci retracement and could bounce from this level to our take profit.
Entry: 1.08447
Why we like it:
There is a pullback support level which lines up with the 61.8% Fibonacci retracement.
Stop loss: 1.08090
Why we like it:
There is a pullback support level.
Take profit: 1.09116
Why we like it:
There is a pullback resistance level.
Please be advised that the information presented on TradingView is provided to Vantage (‘Vantage Global Limited’, ‘we’) by a third-party provider (‘Everest Fortune Group’). Please be reminded that you are solely responsible for the trading decisions on your account. There is a very high degree of risk involved in trading. Any information and/or content is intended entirely for research, educational and informational purposes only and does not constitute investment or consultation advice or investment strategy. The information is not tailored to the investment needs of any specific person and therefore does not involve a consideration of any of the investment objectives, financial situation or needs of any viewer that may receive it. Kindly also note that past performance is not a reliable indicator of future results. Actual results may differ materially from those anticipated in forward-looking or past performance statements. We assume no liability as to the accuracy or completeness of any of the information and/or content provided herein and the Company cannot be held responsible for any omission, mistake nor for any loss or damage including without limitation to any loss of profit which may arise from reliance on any information supplied by Everest Fortune Group.
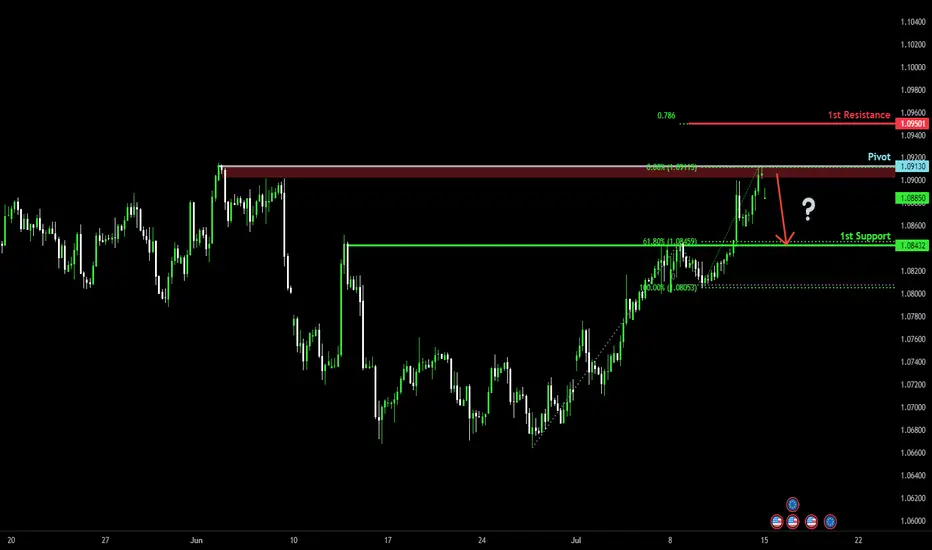
Bearish reversal?EUR/USD is reacting off the pivot which has been identified as a pullback resistance and could reverse to the pullback support.
Pivot: 1.0913
1st Support: 1.0843
1st Resistance: 1.0950
Risk Warning:
Trading Forex and CFDs carries a high level of risk to your capital and you should only trade with money you can afford to lose. Trading Forex and CFDs may not be suitable for all investors, so please ensure that you fully understand the risks involved and seek independent advice if necessary.
Disclaimer:
The above opinions given constitute general market commentary, and do not constitute the opinion or advice of IC Markets or any form of personal or investment advice.
Any opinions, news, research, analyses, prices, other information, or links to third-party sites contained on this website are provided on an "as-is" basis, are intended only to be informative, is not an advice nor a recommendation, nor research, or a record of our trading prices, or an offer of, or solicitation for a transaction in any financial instrument and thus should not be treated as such. The information provided does not involve any specific investment objectives, financial situation and needs of any specific person who may receive it. Please be aware, that past performance is not a reliable indicator of future performance and/or results. Past Performance or Forward-looking scenarios based upon the reasonable beliefs of the third-party provider are not a guarantee of future performance. Actual results may differ materially from those anticipated in forward-looking or past performance statements. IC Markets makes no representation or warranty and assumes no liability as to the accuracy or completeness of the information provided, nor any loss arising from any investment based on a recommendation, forecast or any information supplied by any third-party.
Multi- Swiing High ResistanceEUR/USD is currently on a very strong resistance zone and could reverse from this level to the downside.
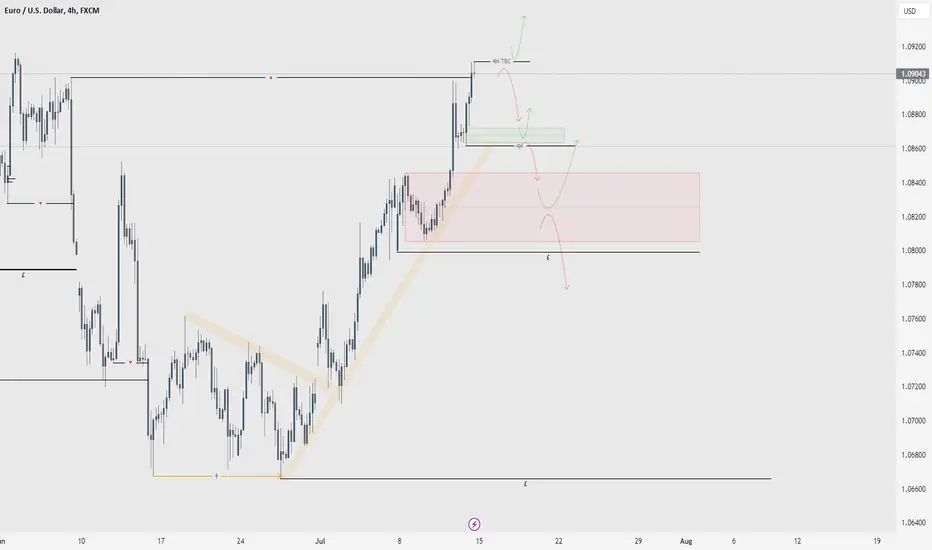
EURUSD 14/7/24The EU this week sits within a bullish trend and bullish range. This, of course, goes against the higher timeframe biases that we have discussed over the last several weeks in our Sunday markups. However, we follow what the price shows us, not what we want it to do.
Coming into this week, we have a relatively neutral bias in terms of direction. Bullish, of course, is our main priority, as that is the way the market is showing us it wants to go. However, the break of the four-hour high, highlighted by the last bullish range, is relatively weak on a larger scale. This leads us to believe there is potential for a pullback or a reversal/continuation of higher timeframe price action.
This brings us to our predictions for this week. First, we need to confirm our four-hour high, which we have not yet confirmed. We have a clear four-hour low, giving us our current bullish range. Based on this, we're looking at the area of demand at the base to push the price higher or for the price to continue higher without interacting with this area at all. If this area fails, we'll be looking at a bearish four-hour range, and ultimately, the price will come down to find a higher timeframe order block to either continue moving higher or break lower, confirming the higher timeframe bias we have been discussing.
Key factors to watch are liquidity across the lows, which will build a lot of momentum if we start to sell off, and the daily candle to see where it closes, as there could be potential for a high timeframe rejection.
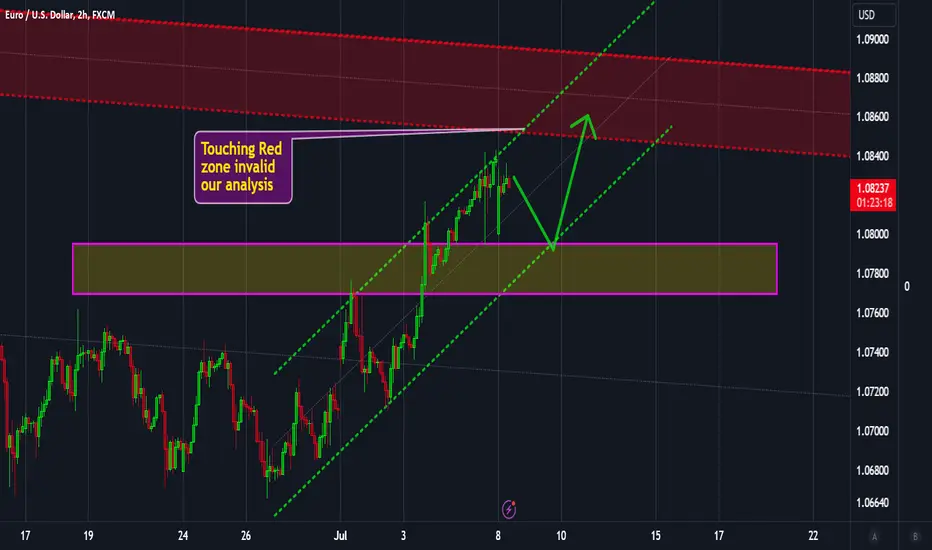
EURUSD: Daily ReviewHello traders,
First let's take a deeper look at daily chart!!
We are in a bullish leg of a bearish channel. I'm waiting for a reversal to enter around the zone!
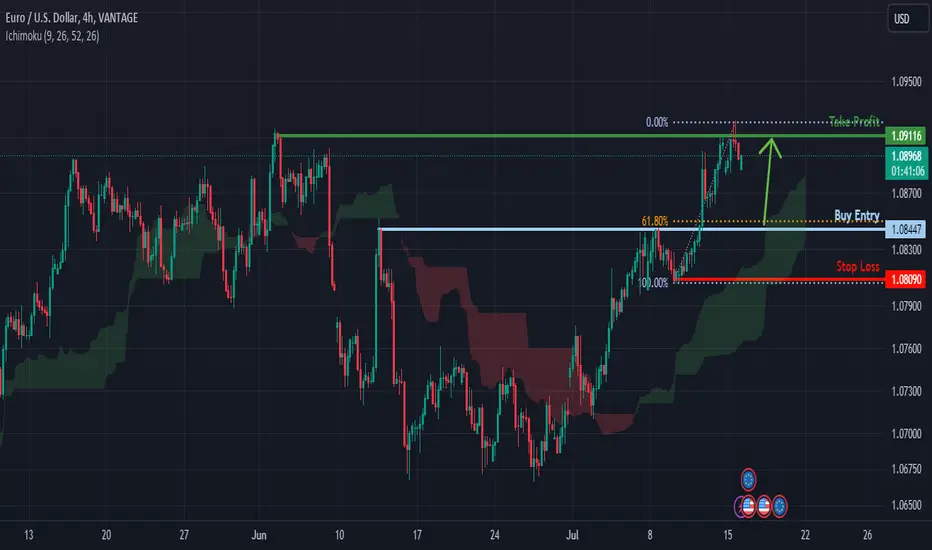
Falling towards 61.8% Fibonacci support?EUR/USD is falling towards the support level which is a pullback support that aligns with the 61.8% Fibonacci retracement and could bounce from this level to our take profit.
Entry: 1.08447
Why we like it:
There is a pullback support that aligns with the 61.8% Fibonacci retracement.
Stop loss: 1.08090
Why we like it:
There is a pullback support level.
Take profit: 1.09116
Why we like it:
There is a pullback resistance that lines up with the 61.8% Fibonacci projection.
Please be advised that the information presented on TradingView is provided to Vantage (‘Vantage Global Limited’, ‘we’) by a third-party provider (‘Everest Fortune Group’). Please be reminded that you are solely responsible for the trading decisions on your account. There is a very high degree of risk involved in trading. Any information and/or content is intended entirely for research, educational and informational purposes only and does not constitute investment or consultation advice or investment strategy. The information is not tailored to the investment needs of any specific person and therefore does not involve a consideration of any of the investment objectives, financial situation or needs of any viewer that may receive it. Kindly also note that past performance is not a reliable indicator of future results. Actual results may differ materially from those anticipated in forward-looking or past performance statements. We assume no liability as to the accuracy or completeness of any of the information and/or content provided herein and the Company cannot be held responsible for any omission, mistake nor for any loss or damage including without limitation to any loss of profit which may arise from reliance on any information supplied by Everest Fortune Group.
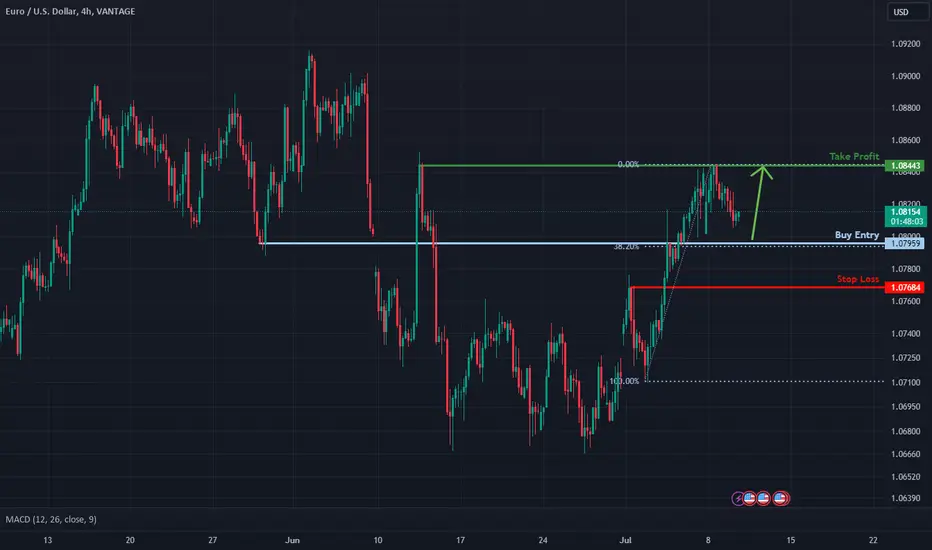
Bullish bounce?EUR/USD is falling towards a support level which is an overlap support that aligns with the 38.2% Fibonacci retracement and could bounce from this level to our take profit.
Entry: 1.07959
Why we like it:
There is an overlap support level which aligns with the 38.2% Fibonacci retracement.
Stop loss: 1.07684
Why we like it:
There is a pullback support level.
Take profit: 1.08443
Why we like it:
There is a pullback resistance level.
Please be advised that the information presented on TradingView is provided to Vantage (‘Vantage Global Limited’, ‘we’) by a third-party provider (‘Everest Fortune Group’). Please be reminded that you are solely responsible for the trading decisions on your account. There is a very high degree of risk involved in trading. Any information and/or content is intended entirely for research, educational and informational purposes only and does not constitute investment or consultation advice or investment strategy. The information is not tailored to the investment needs of any specific person and therefore does not involve a consideration of any of the investment objectives, financial situation or needs of any viewer that may receive it. Kindly also note that past performance is not a reliable indicator of future results. Actual results may differ materially from those anticipated in forward-looking or past performance statements. We assume no liability as to the accuracy or completeness of any of the information and/or content provided herein and the Company cannot be held responsible for any omission, mistake nor for any loss or damage including without limitation to any loss of profit which may arise from reliance on any information supplied by Everest Fortune Group.
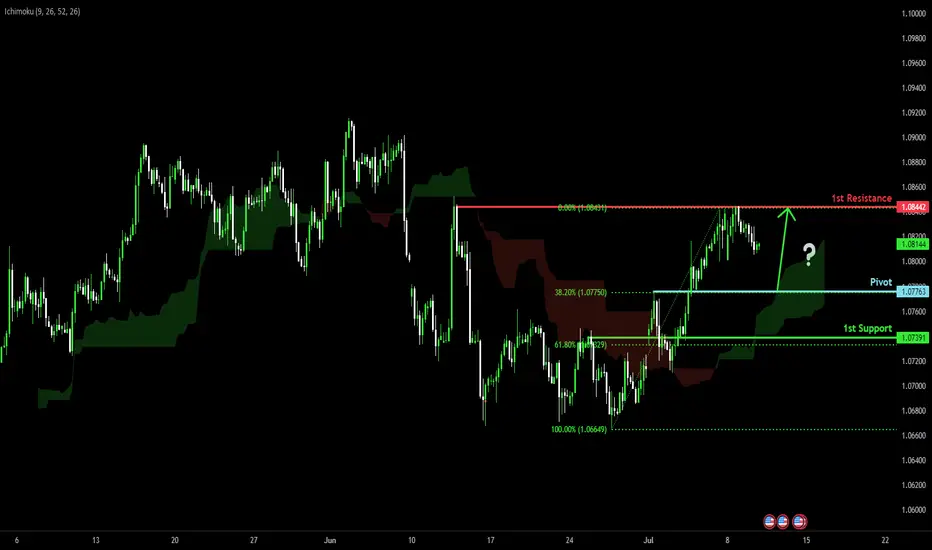
Falling towards 38.2% Fibonacci support?The Fiber (EUR/USD) is falling towards the pivot which has been identified as a pullback support and could bounce to the 1st resistance.
Pivot: 1.07763
1st Support: 1.07391
1st Resistance: 1.08442
Risk Warning:
Trading Forex and CFDs carries a high level of risk to your capital and you should only trade with money you can afford to lose. Trading Forex and CFDs may not be suitable for all investors, so please ensure that you fully understand the risks involved and seek independent advice if necessary.
Disclaimer:
The above opinions given constitute general market commentary, and do not constitute the opinion or advice of IC Markets or any form of personal or investment advice.
Any opinions, news, research, analyses, prices, other information, or links to third-party sites contained on this website are provided on an "as-is" basis, are intended only to be informative, is not an advice nor a recommendation, nor research, or a record of our trading prices, or an offer of, or solicitation for a transaction in any financial instrument and thus should not be treated as such. The information provided does not involve any specific investment objectives, financial situation and needs of any specific person who may receive it. Please be aware, that past performance is not a reliable indicator of future performance and/or results. Past Performance or Forward-looking scenarios based upon the reasonable beliefs of the third-party provider are not a guarantee of future performance. Actual results may differ materially from those anticipated in forward-looking or past performance statements. IC Markets makes no representation or warranty and assumes no liability as to the accuracy or completeness of the information provided, nor any loss arising from any investment based on a recommendation, forecast or any information supplied by any third-party.
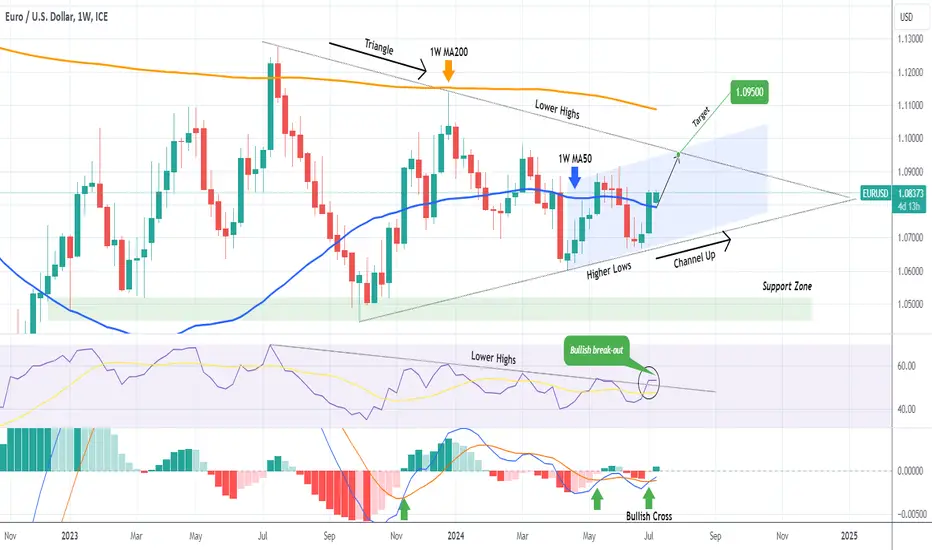
EURUSD Turning bullish short-term.The EURUSD pair closed last week above the 1W MA50 (blue trend-line) for the first time since May 27 and this week is already using it as a Support to sustain further uptrend. Technically this could be the 2nd phase of the Bullish Leg of the (blue) Channel Up that started on the week of June 24.
On the long-term, the pair has been trading within a fierce Triangle consolidation for exactly 1 year. The technical Support level has been the Support Zone that started back in January 2023 and the Resistance level, is the 1W MA200 (orange trend-line) / 1M MA50 cluster.
Back to the Triangle's and Channel Up dynamics, last week's 1W MACD Bullish Cross formation and the bullish break-out of the 1W RSI above its Lower Highs trend-line, support being bullish on the short-term.
We will take a more modest/ cautious approach and will 'only' target 1.09500 (which is the crossroads of the Channel Up Higher Highs and Triangle Lower Highs trend-lines).
-------------------------------------------------------------------------------
** Please LIKE 👍, FOLLOW ✅, SHARE 🙌 and COMMENT ✍ if you enjoy this idea! Also share your ideas and charts in the comments section below! This is best way to keep it relevant, support us, keep the content here free and allow the idea to reach as many people as possible. **
-------------------------------------------------------------------------------
💸💸💸💸💸💸
👇 👇 👇 👇 👇 👇
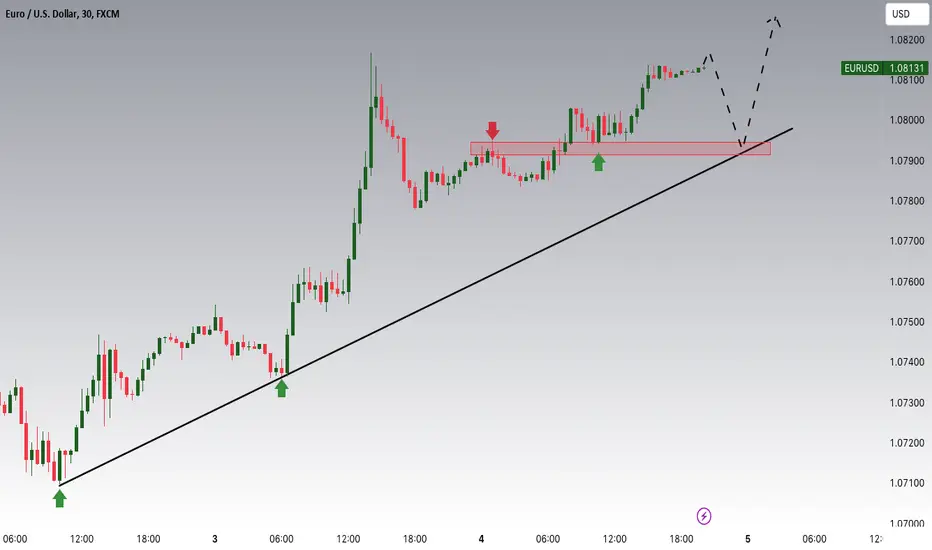
EURUSD Potential UpsidesHey Traders, in today's trading session we are monitoring EURUSD for a buying opportunity around 1.07900 zone, EURUSD is trading in an uptrend and currently is in a correction phase in which it is approaching the trend at 1.07900 support and resistance area.
Trade safe, Joe.
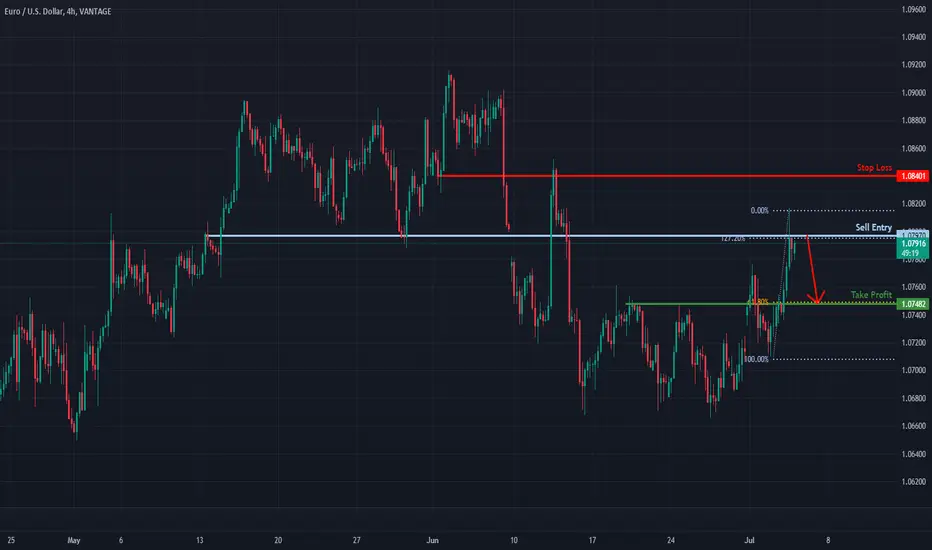
Could EUR/USD fall from here?Price is rising towards a resistance level which is an overlap resistane that aligns with the 127.2% Fibonacci extension and could potentially reverse from this level to our take profit.
Entry: 1.0797
Why we like it:
There is an overlap resistance level which aligns with the 127.2% Fibonacci extension.
Stop loss: 1.0840
Why we like it:
There is an overlap resistance level.
Take profit: 1.0748
Why we like it:
There is a pullback support level which aligns with the 61.8% Fibonacci retracement.
Please be advised that the information presented on TradingView is provided to Vantage (‘Vantage Global Limited’, ‘we’) by a third-party provider (‘Everest Fortune Group’). Please be reminded that you are solely responsible for the trading decisions on your account. There is a very high degree of risk involved in trading. Any information and/or content is intended entirely for research, educational and informational purposes only and does not constitute investment or consultation advice or investment strategy. The information is not tailored to the investment needs of any specific person and therefore does not involve a consideration of any of the investment objectives, financial situation or needs of any viewer that may receive it. Kindly also note that past performance is not a reliable indicator of future results. Actual results may differ materially from those anticipated in forward-looking or past performance statements. We assume no liability as to the accuracy or completeness of any of the information and/or content provided herein and the Company cannot be held responsible for any omission, mistake nor for any loss or damage including without limitation to any loss of profit which may arise from reliance on any information supplied by Everest Fortune Group.