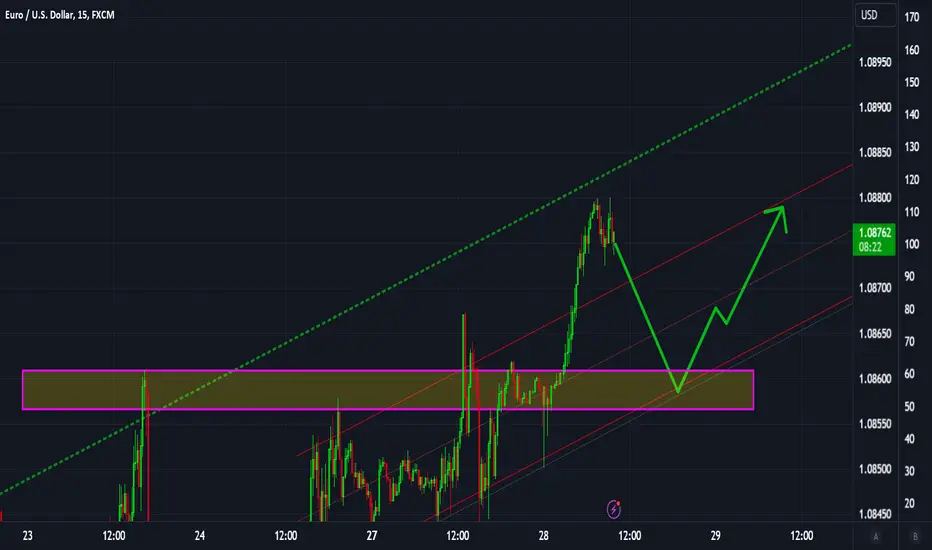
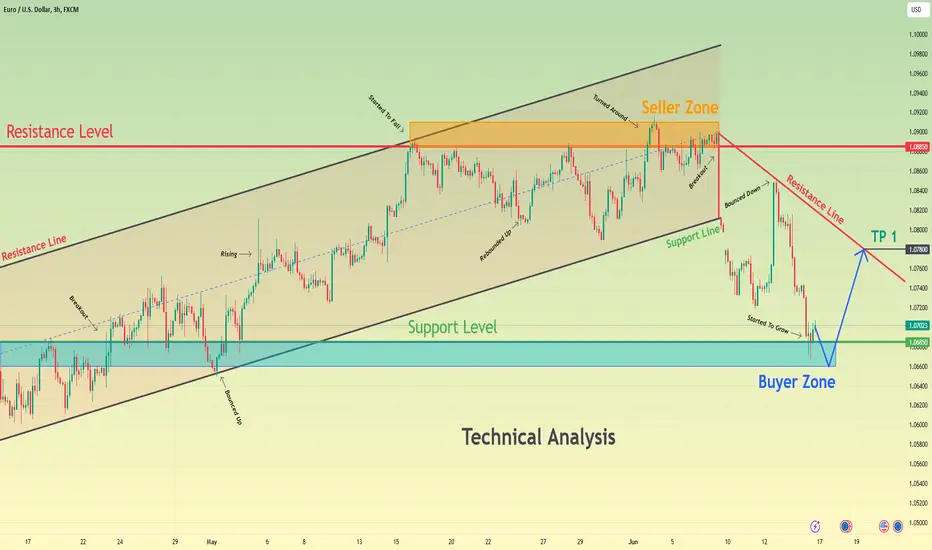
Euro can rebound up from buyer zone to resistance lineHello traders, I want share with you my opinion about Euro. Observing the chart, we can see that the price a not long time ago started to trades inside the upward channel, where it soon reached the support level, which coincided with the buyer zone and broke it. After this, the Euro made a correction to the support line of the channel and then rebounded up and continued to move up inside the channel. Later, the price reached a resistance level, which coincided with the seller zone, but at once turned around and fell a little lower. After this movement, the price reached the 1.0885 level again and then fell almost to the support line of the upward channel. Next, the Euro rebounded up and rose to the seller zone, but soon turned around and dropped to the 1.0685 level, thereby breaking the resistance level and exiting from the channel. Also, the price formed a gap, after which rose to the resistance line and then fell to the support level. Not a long time ago EUR started to grow, so, in my opinion, the price can fall to the buyer zone, and then rebound up to the resistance line. For this case, I set my TP at 1.0780 points, which coincided with this line. Please share this idea with your friends and click Boost 🚀
Eur-usd
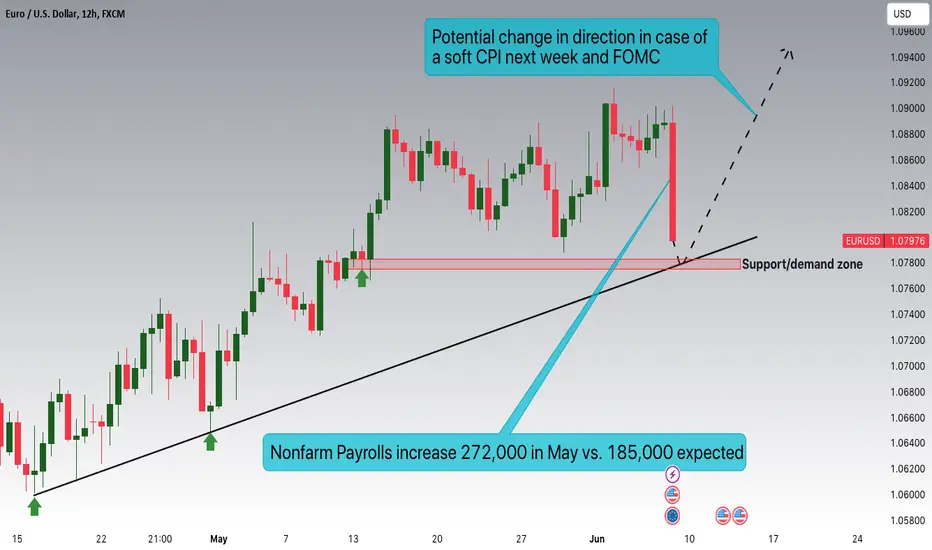
EURUSD:Strong NFP but coming CPI may change directionDear Traders,
Following a period of subdued inflation data, EURUSD recently breached the 1.09000 mark. However, Friday's Non-Farm Payroll (NFP) report surpassed expectations, revealing over 272,000 jobs created compared to the anticipated 185,000. Consequently, EURUSD has retraced towards the key uptrend support around the 1.07800 level.
While the NFP figures are significant, it's crucial to recognize that they are just one piece of the puzzle for the Federal Reserve's decision-making process. Another critical aspect will be the forthcoming Consumer Price Index (CPI). Should the CPI data indicate a softer inflationary trend, we anticipate further weakness in the USD, potentially propelling EURUSD upwards from the support zone at 1.07800.
Conversely, if the CPI surprises with higher-than-expected inflation, we may witness a break in the EURUSD downtrend, possibly leading to new lows.
Remember to trade cautiously and stay informed.
Best regards,
Joe
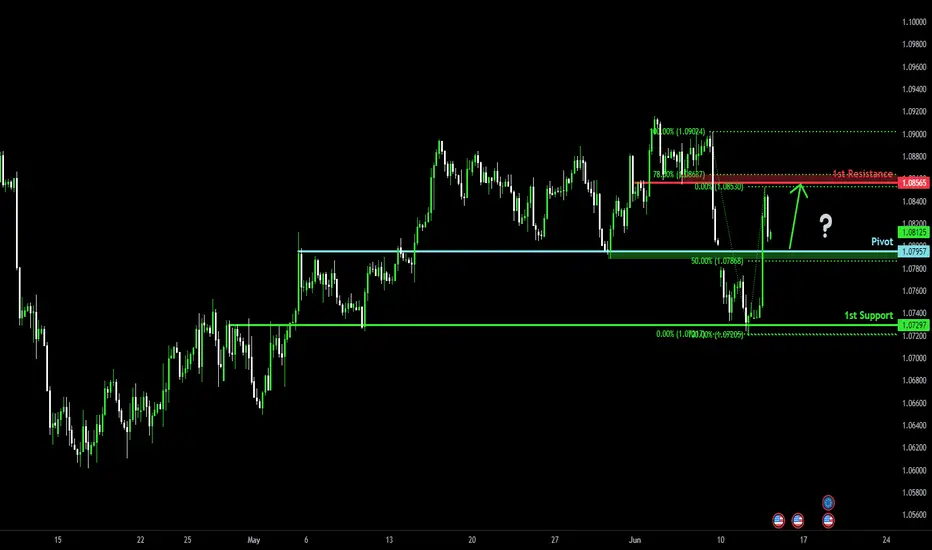
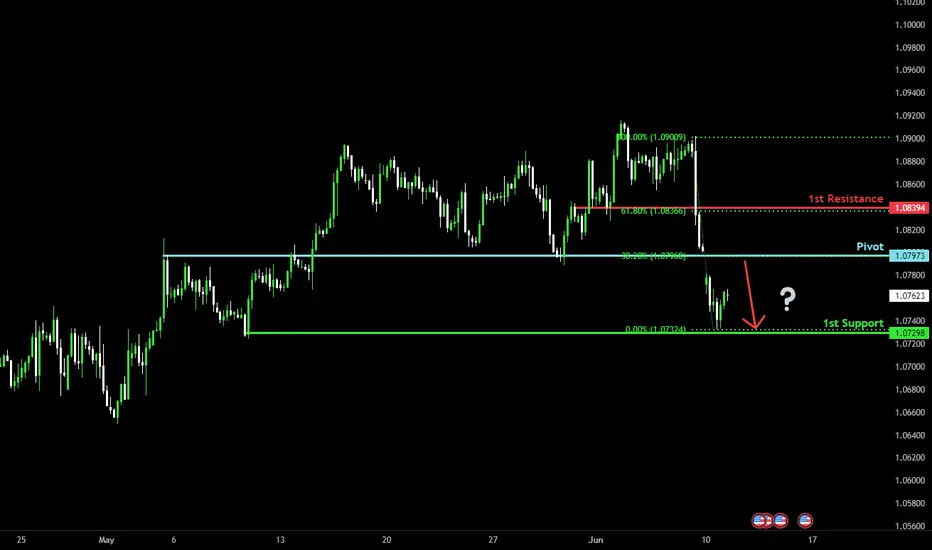
Bullish bounce?The Fiber (EUR/USD) is falling towards the pivot which has been identified as a pullback support level and could potentially bounce to the 1st resistance.
Pivot: 1.07967
1st Support: 1.07297
1st Resistance: 1.08565
Risk Warning:
Trading Forex and CFDs carries a high level of risk to your capital and you should only trade with money you can afford to lose. Trading Forex and CFDs may not be suitable for all investors, so please ensure that you fully understand the risks involved and seek independent advice if necessary.
Disclaimer:
The above opinions given constitute general market commentary, and do not constitute the opinion or advice of IC Markets or any form of personal or investment advice.
Any opinions, news, research, analyses, prices, other information, or links to third-party sites contained on this website are provided on an "as-is" basis, are intended only to be informative, is not an advice nor a recommendation, nor research, or a record of our trading prices, or an offer of, or solicitation for a transaction in any financial instrument and thus should not be treated as such. The information provided does not involve any specific investment objectives, financial situation and needs of any specific person who may receive it. Please be aware, that past performance is not a reliable indicator of future performance and/or results. Past Performance or Forward-looking scenarios based upon the reasonable beliefs of the third-party provider are not a guarantee of future performance. Actual results may differ materially from those anticipated in forward-looking or past performance statements. IC Markets makes no representation or warranty and assumes no liability as to the accuracy or completeness of the information provided, nor any loss arising from any investment based on a recommendation, forecast or any information supplied by any third-party.
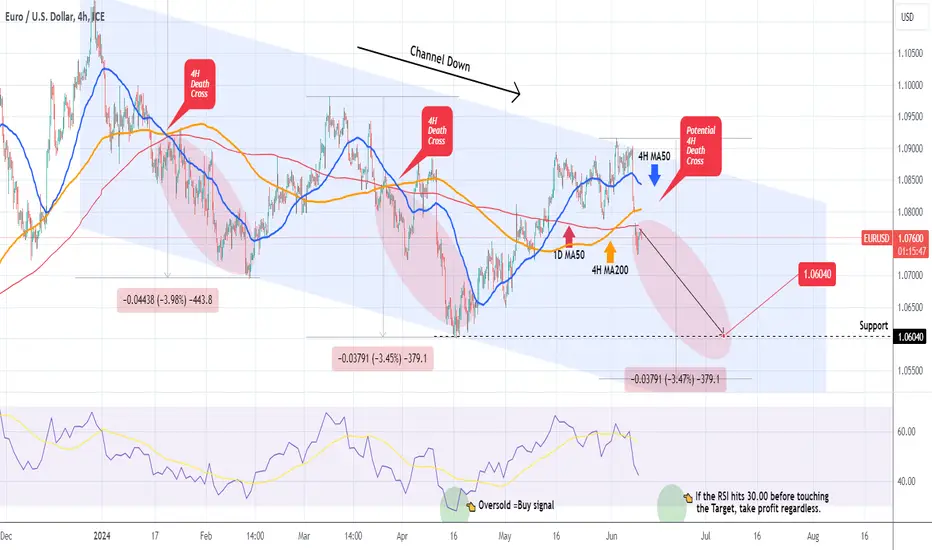
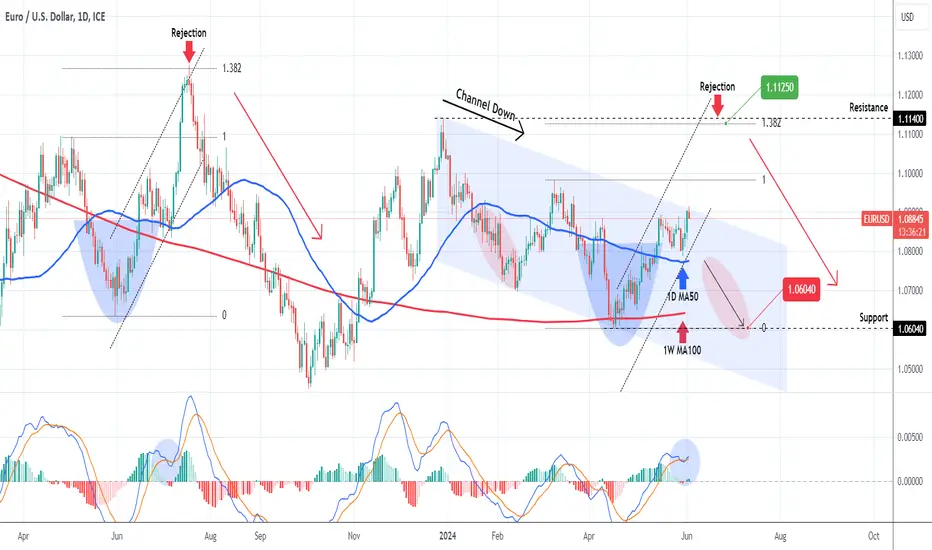
EURUSD The new Bearish Leg has started.On our last analysis EURUSD analysis (June 04, see chart below) we mentioned that it was a do-or-die moment for a rejection as it had marginally broken above the top (Lower Highs trend-line) of the 5-month Channel Down:
As you can see the price did close all subsequent candles below the top and inside the pattern, hence confirming the rejection bias and that the downtrend was still intact. The last two strong bearish days, suggest that the new Bearish Leg has started, especially since yesterday's 1D candle closed below the 1D MA50 (red trend-line) for the first time in a month (since May 10).
Our Target remains 1.06040 (Support 1), which is still a 'good case scenario' for the bearish event as it is above the % drop of the weakest Bearish Leg, the one right before the current (at -3.45%). Ideally, we expect to see the 4H MA200 (orange trend-line) being the Resistance throughout the whole Leg.
-------------------------------------------------------------------------------
** Please LIKE 👍, FOLLOW ✅, SHARE 🙌 and COMMENT ✍ if you enjoy this idea! Also share your ideas and charts in the comments section below! This is best way to keep it relevant, support us, keep the content here free and allow the idea to reach as many people as possible. **
-------------------------------------------------------------------------------
💸💸💸💸💸💸
👇 👇 👇 👇 👇 👇
Heading into 38.2% Fibonacci resistance?The Fiber (EUR/USD) is rising towards the pivot which is an overlap resistance and could reverse to the pullback support.
Pivot: 1.07973
1st Support: 1.07298
1st Resistance: 1.08394
Risk Warning:
Trading Forex and CFDs carries a high level of risk to your capital and you should only trade with money you can afford to lose. Trading Forex and CFDs may not be suitable for all investors, so please ensure that you fully understand the risks involved and seek independent advice if necessary.
Disclaimer:
The above opinions given constitute general market commentary, and do not constitute the opinion or advice of IC Markets or any form of personal or investment advice.
Any opinions, news, research, analyses, prices, other information, or links to third-party sites contained on this website are provided on an "as-is" basis, are intended only to be informative, is not an advice nor a recommendation, nor research, or a record of our trading prices, or an offer of, or solicitation for a transaction in any financial instrument and thus should not be treated as such. The information provided does not involve any specific investment objectives, financial situation and needs of any specific person who may receive it. Please be aware, that past performance is not a reliable indicator of future performance and/or results. Past Performance or Forward-looking scenarios based upon the reasonable beliefs of the third-party provider are not a guarantee of future performance. Actual results may differ materially from those anticipated in forward-looking or past performance statements. IC Markets makes no representation or warranty and assumes no liability as to the accuracy or completeness of the information provided, nor any loss arising from any investment based on a recommendation, forecast or any information supplied by any third-party.
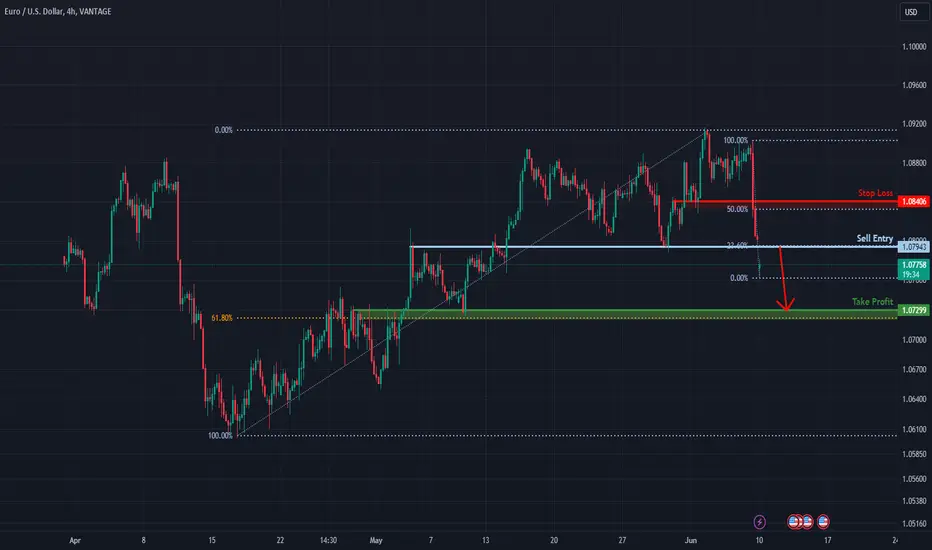
Heading into overlap resistance, could it reverse from here?EUR/USD is rising towards a resistance level which is an overlap resistance that lines up with the 23.6% Fibonacci retracement and could potentially reverse from this level to our take profit.
Entry: 1.07943
Why we like it:
There is an overlap resistance level which aligns with the 23.6% Fibonacci retracement.
Stop loss: 1.08406
Why we like it:
There is an overlap resistance level which is slightly above the 50% Fibonacci retracement.
Take profit: 1.07299
Why we like it:
There is an overlap support level that lines up with the 61.8% Fibonacci retracement.
Please be advised that the information presented on TradingView is provided to Vantage (‘Vantage Global Limited’, ‘we’) by a third-party provider (‘Everest Fortune Group’). Please be reminded that you are solely responsible for the trading decisions on your account. There is a very high degree of risk involved in trading. Any information and/or content is intended entirely for research, educational and informational purposes only and does not constitute investment or consultation advice or investment strategy. The information is not tailored to the investment needs of any specific person and therefore does not involve a consideration of any of the investment objectives, financial situation or needs of any viewer that may receive it. Kindly also note that past performance is not a reliable indicator of future results. Actual results may differ materially from those anticipated in forward-looking or past performance statements. We assume no liability as to the accuracy or completeness of any of the information and/or content provided herein and the Company cannot be held responsible for any omission, mistake nor for any loss or damage including without limitation to any loss of profit which may arise from reliance on any information supplied by Everest Fortune Group.
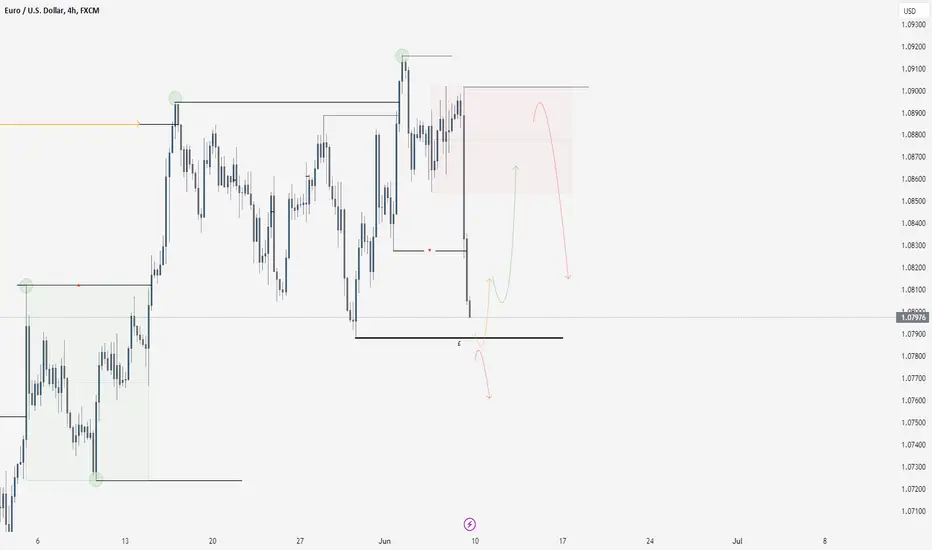
EURUSD 9/6/24Starting things off with euro to the USD this pair has finally shifted bearish into the higher time for a narrative we have mentioned so many times over the last fortnight. This means for us this week we are predominantly focusing on bearish movements, as it stands we have an nfp range this is the overall range responsible for shifting us bearish, Within the 4 hour time frame we still have no low of this range.
Because of this we are still waiting for this range to form properly before we begin to interpret the appropriate point to enter. But as always we have an idea of what we would like to see which is the following. A price pulling back after either liquidating the nearest low or forming a low above this point, Then pulling back to the area of unmitigated supply that we have highlighted above this. for us this is the ideal area to sell from it sits above 50 percent of this range and it also is the area responsible for breaking our major structural point down.
As we head into this week we are going to be waiting for this range to form properly before we begin to formulate sell or buy setups.
What we have shown and spoke about here is our overall main idea so we will wait for this to start playing out and give the principal some fluidity.
Wishing you all the best trading week and remember to reprice trade with appropriate risk and always use a stop loss.
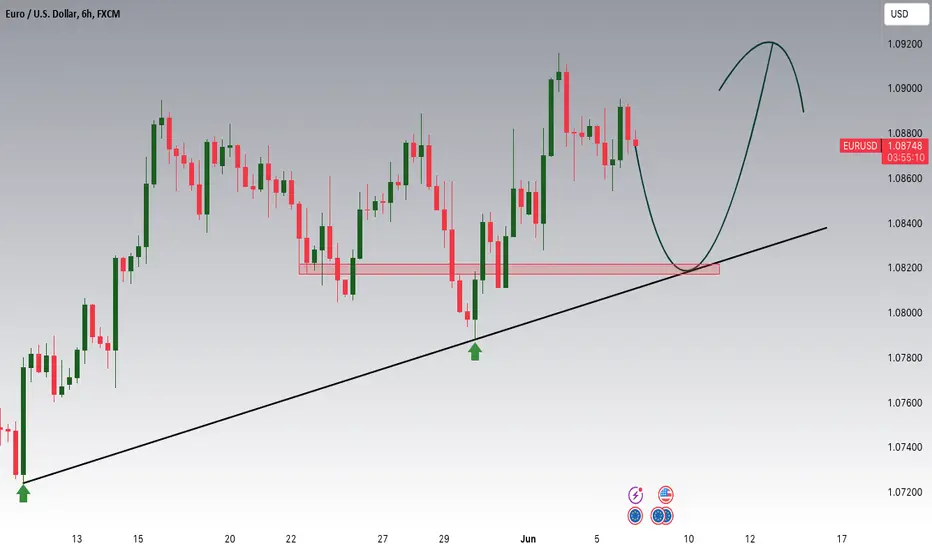
EURUSD is approaching a significant support areaHey Traders, in today's trading session we are monitoring EURUSD for a buying opportunity around 1.08200 zone, EURUSD is trading in an uptrend and currently is in a correction phase in which it is approaching the trend at 1.08200 support and resistance area.
Trade safe, Joe.
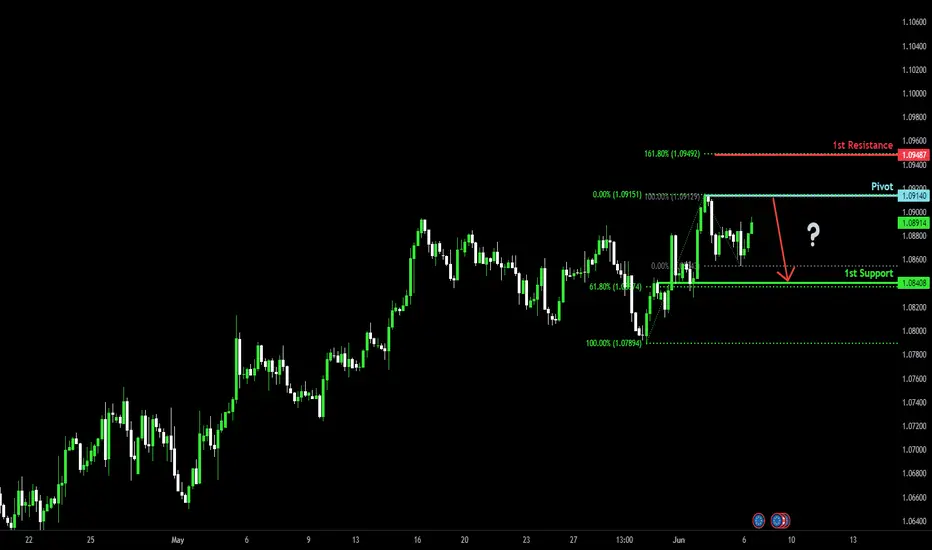
Could EUR/USD reverse from here?Price is rising towards the pivot which acts as a pullback resistance and could reverse to the 1st support.
Pivot: 1.09140
1st Support: 1.08408
1st Resistance: 1.09487
Risk Warning:
Trading Forex and CFDs carries a high level of risk to your capital and you should only trade with money you can afford to lose. Trading Forex and CFDs may not be suitable for all investors, so please ensure that you fully understand the risks involved and seek independent advice if necessary.
Disclaimer:
The above opinions given constitute general market commentary, and do not constitute the opinion or advice of IC Markets or any form of personal or investment advice.
Any opinions, news, research, analyses, prices, other information, or links to third-party sites contained on this website are provided on an "as-is" basis, are intended only to be informative, is not an advice nor a recommendation, nor research, or a record of our trading prices, or an offer of, or solicitation for a transaction in any financial instrument and thus should not be treated as such. The information provided does not involve any specific investment objectives, financial situation and needs of any specific person who may receive it. Please be aware, that past performance is not a reliable indicator of future performance and/or results. Past Performance or Forward-looking scenarios based upon the reasonable beliefs of the third-party provider are not a guarantee of future performance. Actual results may differ materially from those anticipated in forward-looking or past performance statements. IC Markets makes no representation or warranty and assumes no liability as to the accuracy or completeness of the information provided, nor any loss arising from any investment based on a recommendation, forecast or any information supplied by any third-party.
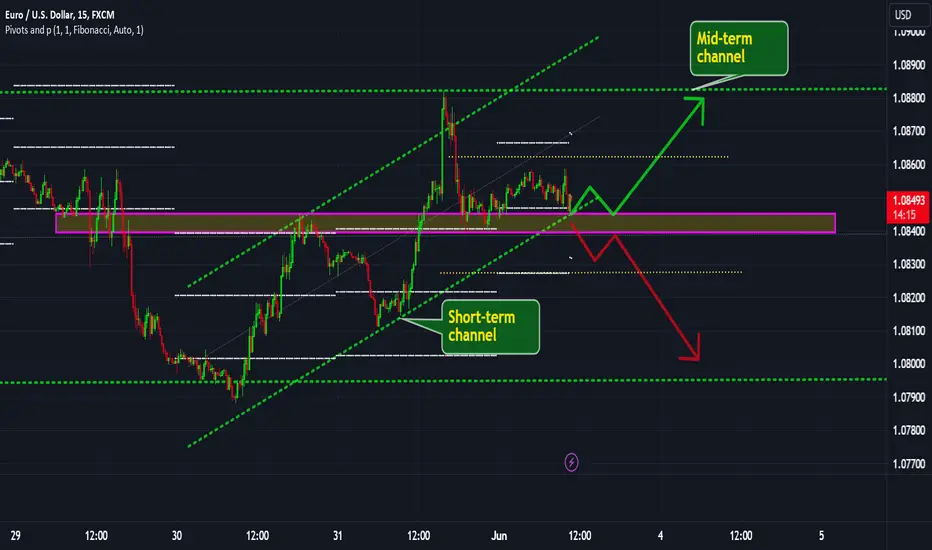
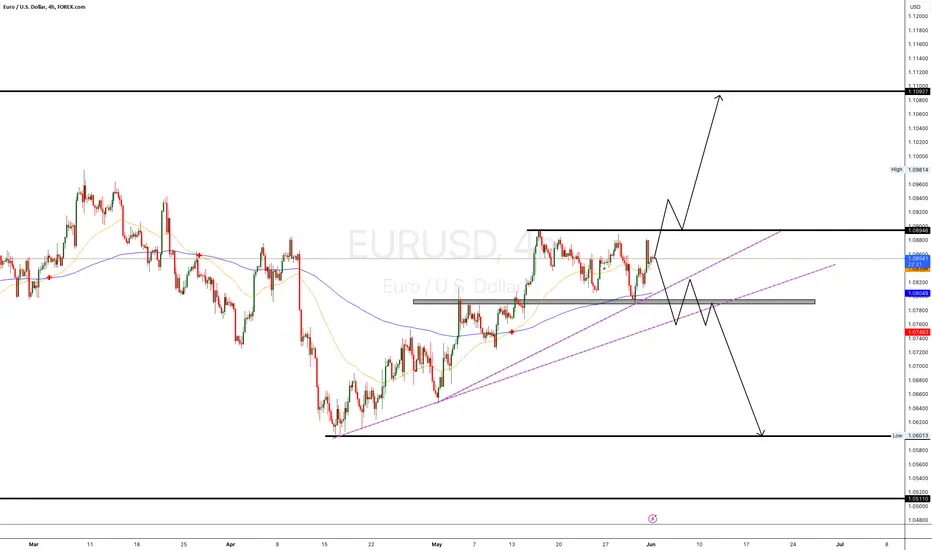
EURUSD: IntradayDear traders!
A mid-term channel is clear in the chart.
A short-term channel is also there! Any breaking below the bottom of short-term channel is hunting liquidity as long as we are perfectly over the zone!
Any breaks below the zone alter the bearish scenario! Remember that Final Manufacturing PMI release if USA could change the market direction.
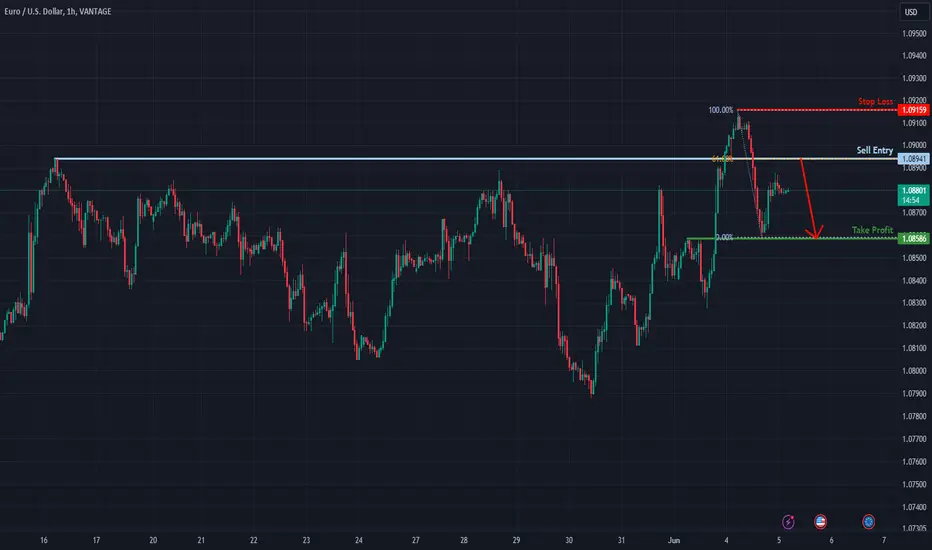
Could EUR/USD reverse from here?Price is rising towards a resistance level which is a pullback resistance that lines up with the 61.8% Fibonacci retracement and could reverse from this level to our take profit.
Entry: 1.08941
Why we like it:
There is a pullback resistance level which aligns with the 61.8% Fibonacci retracement.
Stop loss: 1.09159
Why we like it:
There is a pullback resistance level.
Take profit: 1.08586
Why we like it:
There is an overlap support level.
Please be advised that the information presented on TradingView is provided to Vantage (‘Vantage Global Limited’, ‘we’) by a third-party provider (‘Everest Fortune Group’). Please be reminded that you are solely responsible for the trading decisions on your account. There is a very high degree of risk involved in trading. Any information and/or content is intended entirely for research, educational and informational purposes only and does not constitute investment or consultation advice or investment strategy. The information is not tailored to the investment needs of any specific person and therefore does not involve a consideration of any of the investment objectives, financial situation or needs of any viewer that may receive it. Kindly also note that past performance is not a reliable indicator of future results. Actual results may differ materially from those anticipated in forward-looking or past performance statements. We assume no liability as to the accuracy or completeness of any of the information and/or content provided herein and the Company cannot be held responsible for any omission, mistake nor for any loss or damage including without limitation to any loss of profit which may arise from reliance on any information supplied by Everest Fortune Group.
EURUSD Bullish break-out or Bearish rejection?The EURUSD pair cemented a strong rebound yesterday as it broke above the May 16 High, after it held the 1D MA50 (blue trend-line) as Support. This took yesterday's 1D candle exactly at the top (Lower Highs trend-line) of the December 28 2023 Channel Down.
This is the last chance for the pair to resume the pattern's downtrend, if today's 1D candle closes inside the Channel Down, which will constitute a Lower Highs rejection. In that case, we will require a closing below the 1D MA50 as well in order to confirm the downtrend. The 1.0640 Support will be the Target.
If however the candle closes above the Channel Down, it will be a confirmed bullish break-out and in our opinion there will be high probabilities of imitating the July 2023 rally. That rise peaked exactly on the 1.382 Fibonacci extension level, so on that occasion, that will be our Target (1.1125), which conveniently falls just below the 1.11400 Resistance. Notice also how similar the 1D RSI sequences are between the two fractals.
-------------------------------------------------------------------------------
** Please LIKE 👍, FOLLOW ✅, SHARE 🙌 and COMMENT ✍ if you enjoy this idea! Also share your ideas and charts in the comments section below! This is best way to keep it relevant, support us, keep the content here free and allow the idea to reach as many people as possible. **
-------------------------------------------------------------------------------
💸💸💸💸💸💸
👇 👇 👇 👇 👇 👇
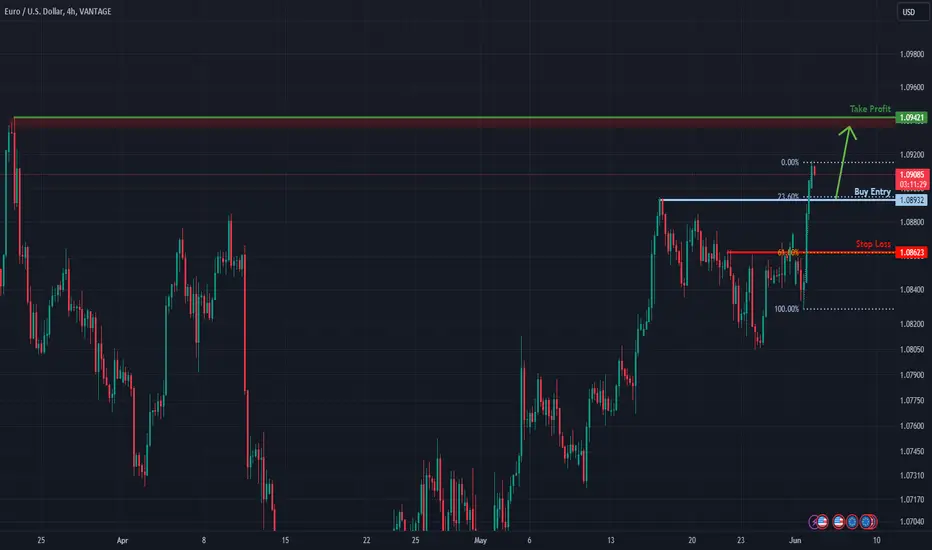
Falling towards a pullback support, could it bounce from here?EUR/USD is falling towards a support level which is a pullback support that aligns with the 23.6% Fibonacci retracement and could bounce from this level to our take profit.
Entry: 1.08932
Why we like it:
There is a pullback support level which lines up with the 23.6% Fibonacci retracement.
Stop loss: 1.08623
Why we like it:
There is a pullback support level which lines up with the 61.8% Fibonacci retracement.
Take profit: 1.09421
Why we like it:
There is a pullback resistance level.
Please be advised that the information presented on TradingView is provided to Vantage (‘Vantage Global Limited’, ‘we’) by a third-party provider (‘Everest Fortune Group’). Please be reminded that you are solely responsible for the trading decisions on your account. There is a very high degree of risk involved in trading. Any information and/or content is intended entirely for research, educational and informational purposes only and does not constitute investment or consultation advice or investment strategy. The information is not tailored to the investment needs of any specific person and therefore does not involve a consideration of any of the investment objectives, financial situation or needs of any viewer that may receive it. Kindly also note that past performance is not a reliable indicator of future results. Actual results may differ materially from those anticipated in forward-looking or past performance statements. We assume no liability as to the accuracy or completeness of any of the information and/or content provided herein and the Company cannot be held responsible for any omission, mistake nor for any loss or damage including without limitation to any loss of profit which may arise from reliance on any information supplied by Everest Fortune Group.
BUY TRADE SETUP ON EURUSDHey Trader,
Check out this analysis on EURUSD.
A long entry plan is best above the intraday resistance area.
Alternatively, a short trade can be considered if the price breaks below the intraday key zone (support), retests, and resists. A short trade can be considered.
Trade safe.
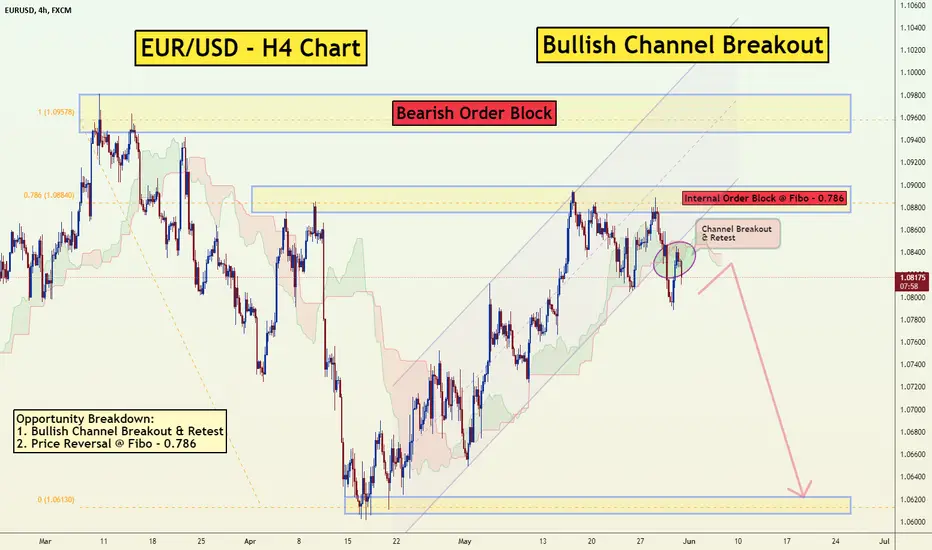
Sell EURUSD H4 Channel Breakout & Order BlockThe EUR/USD pair on the H4 timeframe presents a potential selling opportunity due to a recent downward breakout from a well-defined channel pattern. This suggests a shift in momentum towards the downside in the coming Hours.
Key Points:
Sell Entry: Consider entering a short position around the current price of 1.0820, positioned close to the breakout level. This offers an entry point near the perceived shift in momentum.
Target Levels:
1st Support – 1.0620
Stop-Loss: To manage risk, place a stop-loss order above 1.0900. This helps limit potential losses if the price unexpectedly reverses and breaks back upwards.
Opportunity Breakdown :
1. Bullish Channel Breakout & Retest
2. Price Reversal @ Fibo - 0.786
Market Factors:
Dovish ECB vs Hawkish Fed: The European Central Bank (ECB) is generally expected to maintain a dovish stance on interest rates, while the Federal Reserve might continue raising rates to combat inflation. This interest rate differential could weaken the EUR relative to the USD.
Weak Eurozone Data: Recent economic data releases from the Eurozone might have painted a weaker picture of the region's economic health, potentially undermining confidence in the Euro.
Thank you.
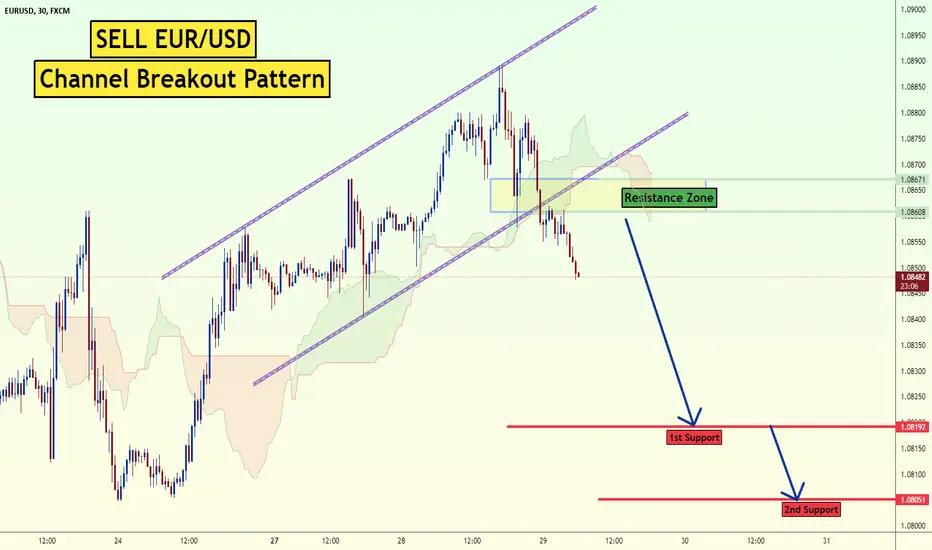
Sell EURUSD Channel BreakoutThe EUR/USD pair on the M30 timeframe presents a potential selling opportunity due to a recent downward breakout from a well-defined channel pattern. This suggests a shift in momentum towards the downside in the coming Hours.
Key Points:
Sell Entry: Consider entering a short position around the current price of 1.0850, positioned close to the breakout level. This offers an entry point near the perceived shift in momentum.
Target Levels:
1st Support – 1.0819
2nd Support – 1.0805
Stop-Loss: To manage risk, place a stop-loss order above 1.0885 This helps limit potential losses if the price unexpectedly reverses and breaks back upwards.
Thank you.
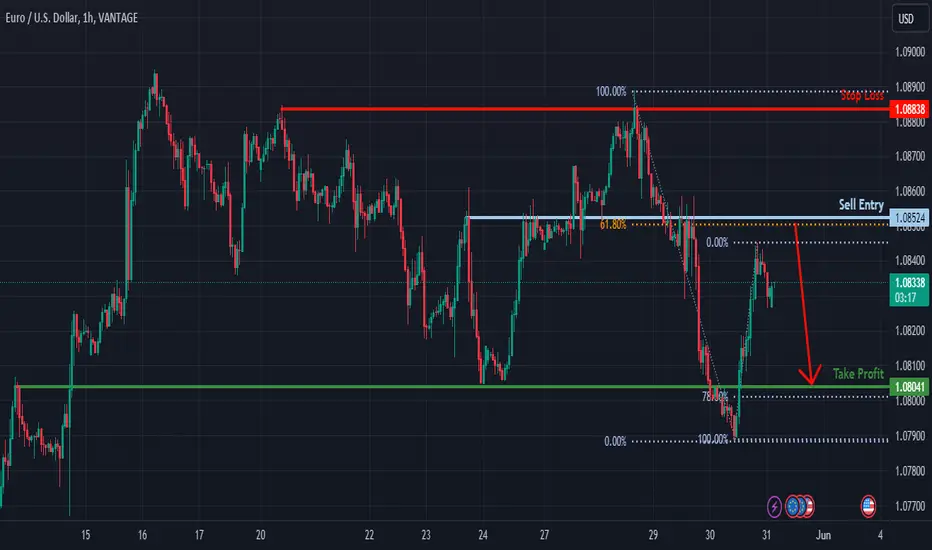
Heading into 61.8% Fibonacci resistance?EUR/USD is rising towards a resistance level which is an overlap resistance that aligns with the 61.8% Fibonacci retracement and could reverse from this level to our take profit.
Entry: 1.08524
Why we like it:
There is an overlap resistance level which aligns with the 61.8% Fibonacci retracement.
Stop loss: 1.08838
Why we like it:
There is a pullback resistance level.
Take profit: 1.08041
Why we like it:
There is a pullback support level which lines up with the 78.6% Fibonacci retracement.
Please be advised that the information presented on TradingView is provided to Vantage (‘Vantage Global Limited’, ‘we’) by a third-party provider (‘Everest Fortune Group’). Please be reminded that you are solely responsible for the trading decisions on your account. There is a very high degree of risk involved in trading. Any information and/or content is intended entirely for research, educational and informational purposes only and does not constitute investment or consultation advice or investment strategy. The information is not tailored to the investment needs of any specific person and therefore does not involve a consideration of any of the investment objectives, financial situation or needs of any viewer that may receive it. Kindly also note that past performance is not a reliable indicator of future results. Actual results may differ materially from those anticipated in forward-looking or past performance statements. We assume no liability as to the accuracy or completeness of any of the information and/or content provided herein and the Company cannot be held responsible for any omission, mistake nor for any loss or damage including without limitation to any loss of profit which may arise from reliance on any information supplied by Everest Fortune Group.
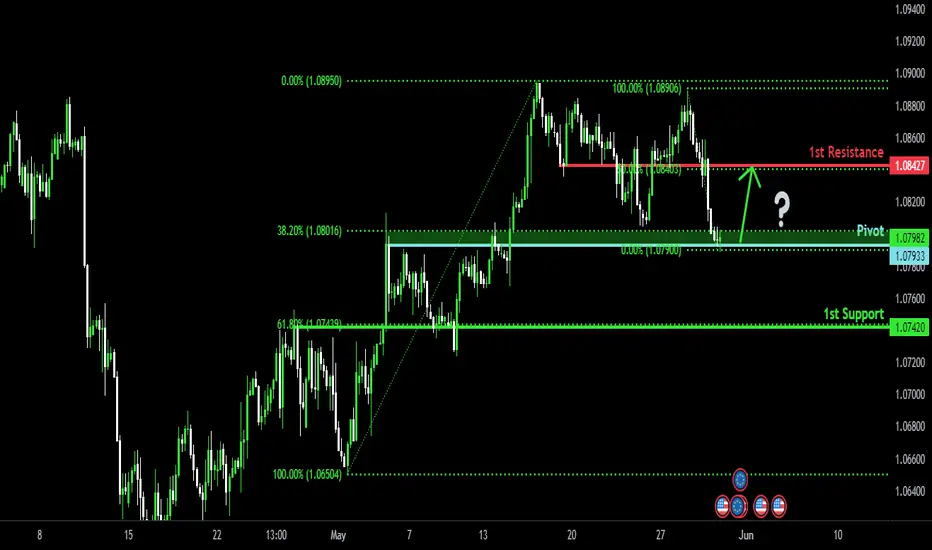
Bullish bounce off 38.2% Fibonacci support?The Fiber (EUR/USD) is currently at the pivot which acts as an overlap resistance and could rise to the 1st resistance.
Pivot: 1.0793
1st Support: 1.0742
1st Resistance: 1.0842
Risk Warning:
Trading Forex and CFDs carries a high level of risk to your capital and you should only trade with money you can afford to lose. Trading Forex and CFDs may not be suitable for all investors, so please ensure that you fully understand the risks involved and seek independent advice if necessary.
Disclaimer:
The above opinions given constitute general market commentary, and do not constitute the opinion or advice of IC Markets or any form of personal or investment advice.
Any opinions, news, research, analyses, prices, other information, or links to third-party sites contained on this website are provided on an "as-is" basis, are intended only to be informative, is not an advice nor a recommendation, nor research, or a record of our trading prices, or an offer of, or solicitation for a transaction in any financial instrument and thus should not be treated as such. The information provided does not involve any specific investment objectives, financial situation and needs of any specific person who may receive it. Please be aware, that past performance is not a reliable indicator of future performance and/or results. Past Performance or Forward-looking scenarios based upon the reasonable beliefs of the third-party provider are not a guarantee of future performance. Actual results may differ materially from those anticipated in forward-looking or past performance statements. IC Markets makes no representation or warranty and assumes no liability as to the accuracy or completeness of the information provided, nor any loss arising from any investment based on a recommendation, forecast or any information supplied by any third-party.
EURUSD: ZONES and CHANNELS Hello traders:
This is intraday analysis for EURUSD:
The mid-term channel is bullish and we are around a good place to see pressure of buyers.
On the other hand, the bullish short-term channel is broken but we are far enough from it.
I'm searching for longing the pair around the current zone 1.0845. my first tp could be around 1.08550 and the final TP is 1.08650.
the 1.08650 zone is perfect for short trading if it coincide with the middle mid-term channel.
Trade Like A Sniper - Episode 8 - EURUSD - (29th May 2024)This video is part of a video series where I backtest a specific asset using the TradingView Replay function, and perform a top-down analysis in order to frame ONE high-probability setup. I choose a random point of time to replay, and begin to work my way down the timeframes. Trading like a sniper is not about entries with no drawdown. It is about careful planning, discipline, and taking your shot at the right time in the best of conditions.
A couple of things to note:
- I cannot see news events.
- I cannot change timeframes without affecting my bias due to higher-timeframe candles revealing its entire range.
- I cannot go to a very low timeframe due to the limit in amount of replayed candlesticks
In this session I will be analyzing EURUSD, starting from the Monthly chart.
- R2F

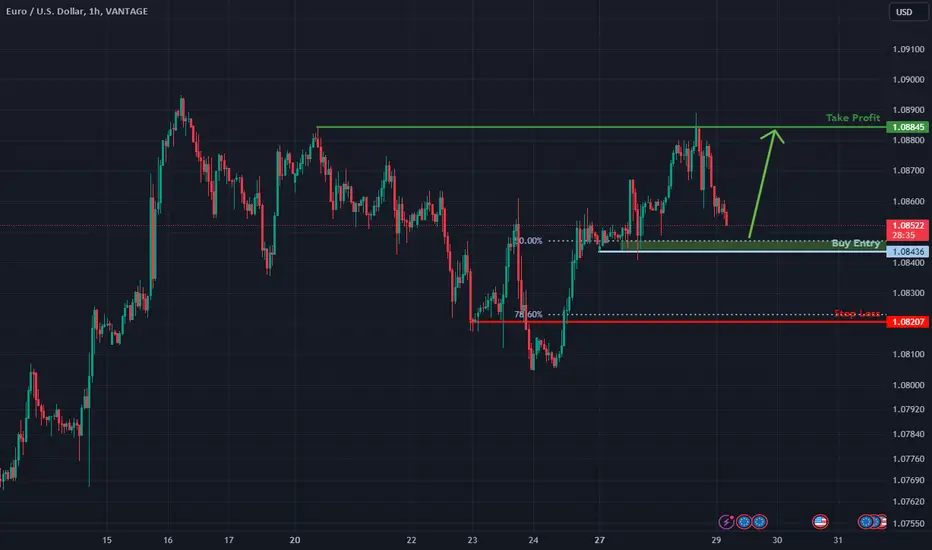
Falling towards 50% Fibonacci support?EUR/USD is falling towards the support level which is a pullback support that aligns with the 50% Fibonacci retracement and could bounce from this level to our take profit.
Entry: 1.08436
Why we like it:
There is a pullback support level which lines up with the 50% Fibonacci retracement.
Stop loss: 1.08207
Why we like it:
There is a pullback support that lines up with the 78.6% Fibonacci retracement.
Take profit: 1.08845
Why we like it:
There is a pullback resistance level.
Please be advised that the information presented on TradingView is provided to Vantage (‘Vantage Global Limited’, ‘we’) by a third-party provider (‘Everest Fortune Group’). Please be reminded that you are solely responsible for the trading decisions on your account. There is a very high degree of risk involved in trading. Any information and/or content is intended entirely for research, educational and informational purposes only and does not constitute investment or consultation advice or investment strategy. The information is not tailored to the investment needs of any specific person and therefore does not involve a consideration of any of the investment objectives, financial situation or needs of any viewer that may receive it. Kindly also note that past performance is not a reliable indicator of future results. Actual results may differ materially from those anticipated in forward-looking or past performance statements. We assume no liability as to the accuracy or completeness of any of the information and/or content provided herein and the Company cannot be held responsible for any omission, mistake nor for any loss or damage including without limitation to any loss of profit which may arise from reliance on any information supplied by Everest Fortune Group.
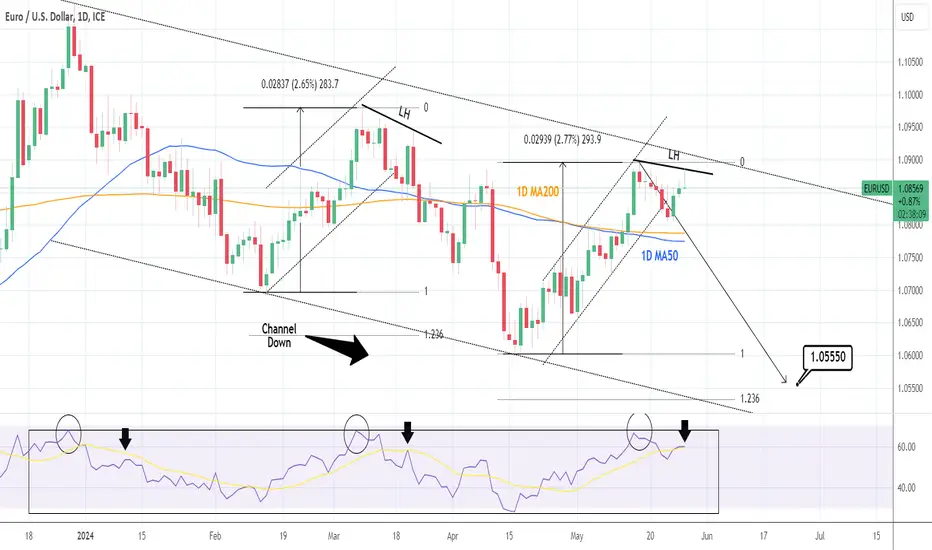
EURUSD: Today's result is critical for maintaing the Channel DowEURUSD has turned bullish short-term on its 1D technical outlook (RSI = 59.604, MACD = 0.002, ADX = 30.311) as it rebounded before the 1D MA50/200 test. This is making a LH, same way it did on March 21st, again after holding the 1D MA50/200. Similarly, the 1D RSI us on the MA period. A rejection today validates the fractal bias of happening again. In that case, we are still on course to forming the new bearish wave of the five month Channel Down. We are still aiming for the 1.236 Fibonacci extension (TP = 1.05550).
## If you like our free content follow our profile to get more daily ideas. ##
## Comments and likes are greatly appreciated. ##
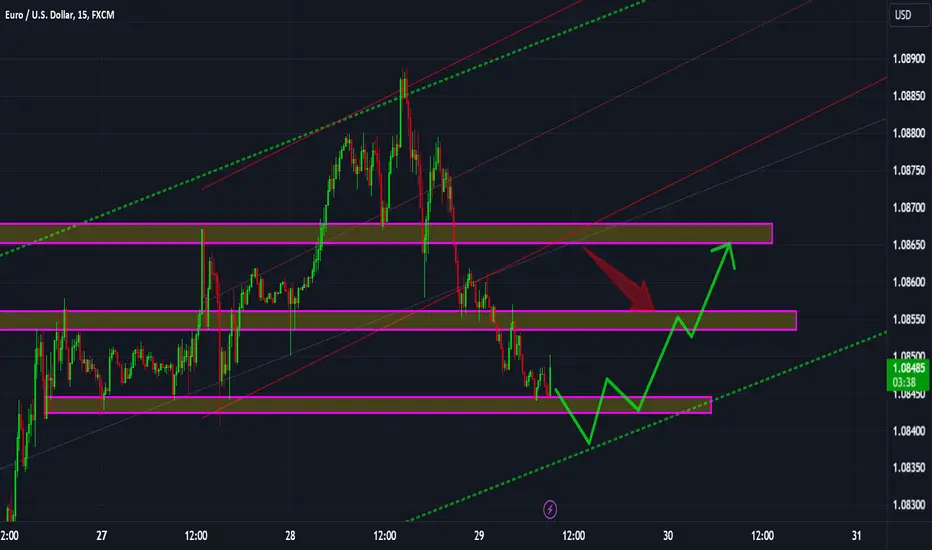
EURUSD: Intraday:Upon examining the updated chart for EUR/USD, it appears our previous analysis was profitable. Let's break down the current chart and provide an updated intraday analysis based on the new information provided.
Previous Day Analysis Review
In our previous analysis, we noted key support and resistance levels, the short-term upward channel, and the highlighted support zone. The suggested bullish scenario played out, as the price respected the lower boundary of the channel and moved upward, yielding profitable trades for those who followed the strategy.
The price is still moving within the upward channel marked in red.
The lower boundary of the channel remains around 1.08600, with the upper boundary near 1.08900.
Support and Resistance:
The highlighted support zone (purple) around 1.08550 - 1.08650 remains critical.
Near the lower boundary of the channel at 1.08600.
The upper boundary of the channel at 1.08900.
The price recently tested the upper boundary and pulled back, suggesting a potential retest of the support zone and the lower boundary of the channel.
A rebound from the support zone would align with the short-term bullish trend within the channel.
Trading Scenarios
Entry Point: Near the support zone at 1.08550 - 1.08650.
Target: The upper boundary of the channel that could around 1.08900 or more.
Stop-Loss: Below 1.08500, just under the support zone.
The intraday analysis confirms a profitable outcome from our previous analysis. The key levels to monitor include the support zone around 1.08550 - 1.08650 and the upper boundary of the channel at 1.08900. Maintaining a disciplined approach with proper risk management is crucial for successful trading.