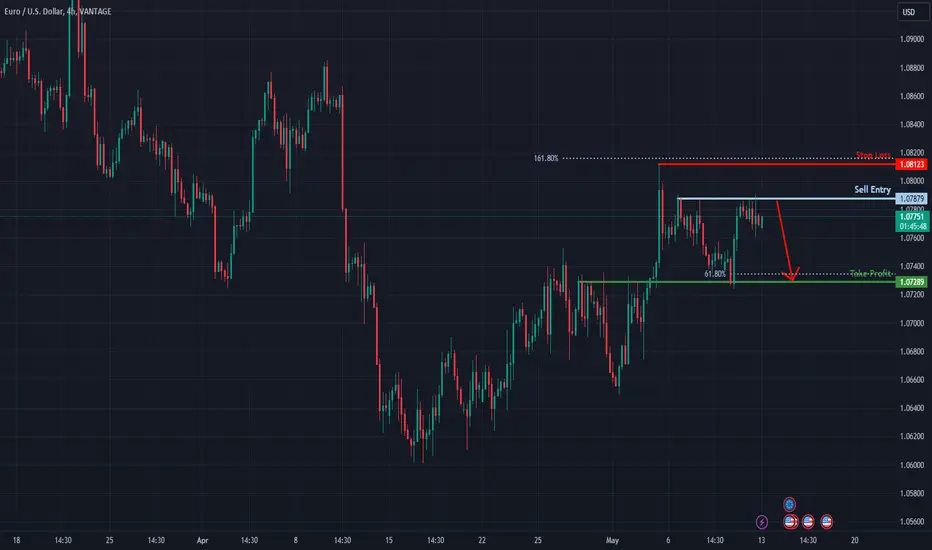
Potential bearish drop?Price has reacted off the resistance level which is a pullback resistance and could potentially drop from this level to out take profit.
Entry: 1.07879
Why we like it:
There is a pullback resistance level.
Stop loss: 1.08123
Why we like it:
There is a pullback resistance level.
Take profit: 1.07289
Why we like it:
There is an overlap support level which aligns with the61.8% Fibonacci projection.
Please be advised that the information presented on TradingView is provided to Vantage (‘Vantage Global Limited’, ‘we’) by a third-party provider (‘Everest Fortune Group’). Please be reminded that you are solely responsible for the trading decisions on your account. There is a very high degree of risk involved in trading. Any information and/or content is intended entirely for research, educational and informational purposes only and does not constitute investment or consultation advice or investment strategy. The information is not tailored to the investment needs of any specific person and therefore does not involve a consideration of any of the investment objectives, financial situation or needs of any viewer that may receive it. Kindly also note that past performance is not a reliable indicator of future results. Actual results may differ materially from those anticipated in forward-looking or past performance statements. We assume no liability as to the accuracy or completeness of any of the information and/or content provided herein and the Company cannot be held responsible for any omission, mistake nor for any loss or damage including without limitation to any loss of profit which may arise from reliance on any information supplied by Everest Fortune Group.
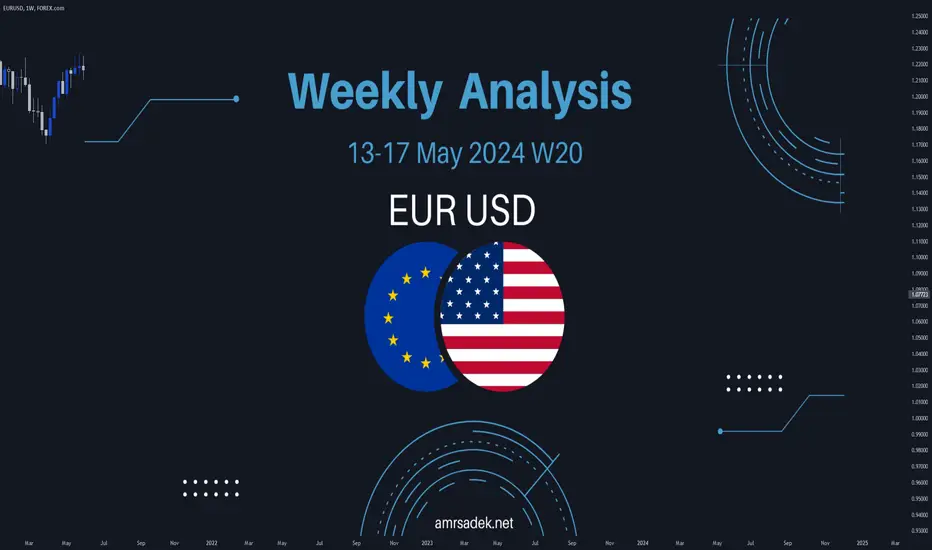
Eur-usd
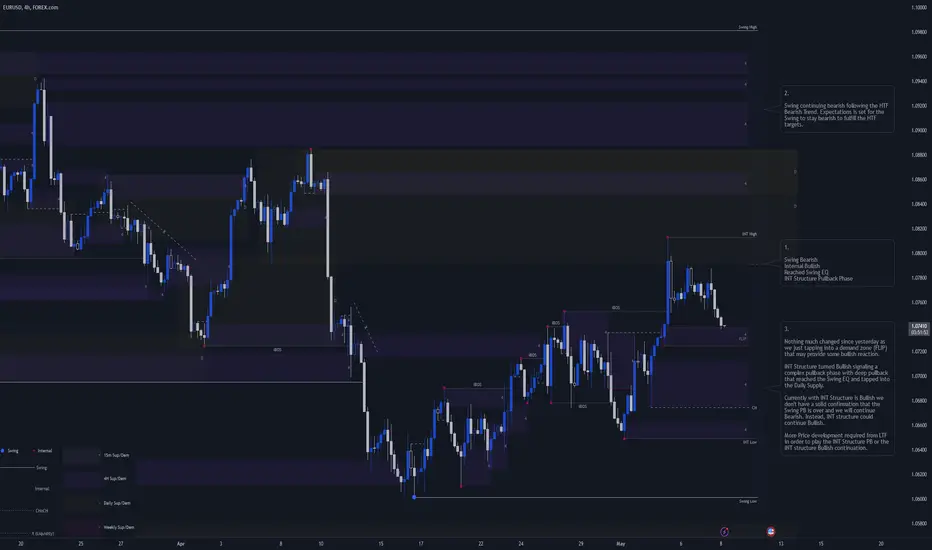
EURUSD 13-17 May 2024 W20 - Weekly Analysis - EU & US CPI Week!This is my Weekly analysis on EURUSD for 13-17 May 2024 W20 based on Smart Money Concept (SMC) which includes the following:
Market Sentiment
Weekly Chart Analysis
Daily Chart Analysis
4H Chart Analysis
Economic Events for the Week
Market Sentiment
The narrative surrounding the monetary policy divergence between the Fed and the rest of its G10 peers continues to dominate the macro scenario in the market. On this, the FedWatch Tool tracked by CME Group sees the probability of a Fed’s rate reduction in September nearly 70%.
With the inflation reports expected this week (CPI), If inflation stays high but doesn't speed up much more, the Federal Reserve might keep interest rates higher for a longer time. This is because the market is worried about inflation staying high, and if there's a surprise where inflation doesn't increase as much as feared, the reaction will likely be smaller. Powell, said they would only raise rates if they had convincing proof that their current policies are too tight.
Right now, the market expects interest rates to be cut twice by the end of the year. However, if we see another report showing high inflation, those expectations might change. A weaker report might lead to just one rate cut being expected instead of two, but not much more than that. The Federal Reserve might wait until their meeting in September at the earliest to make any major decisions, unless there's a sudden worsening in the job market.
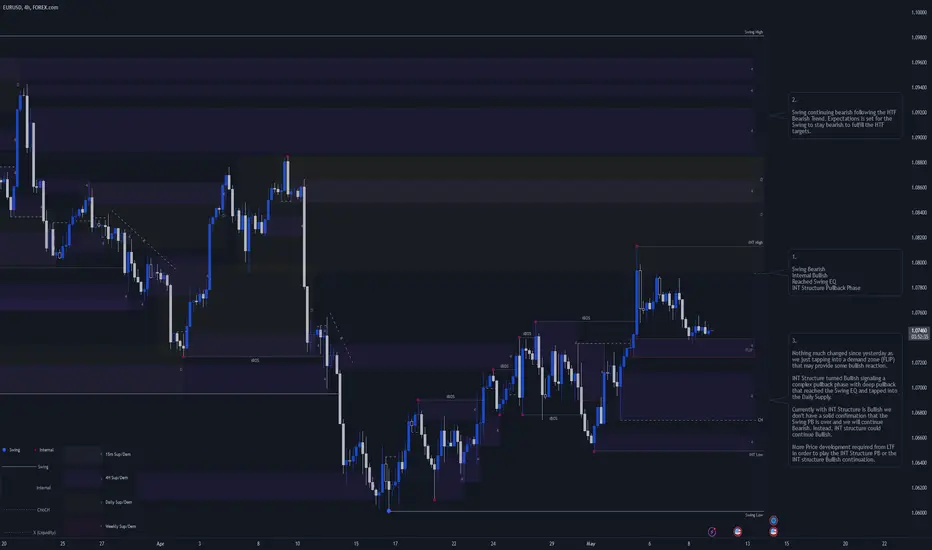
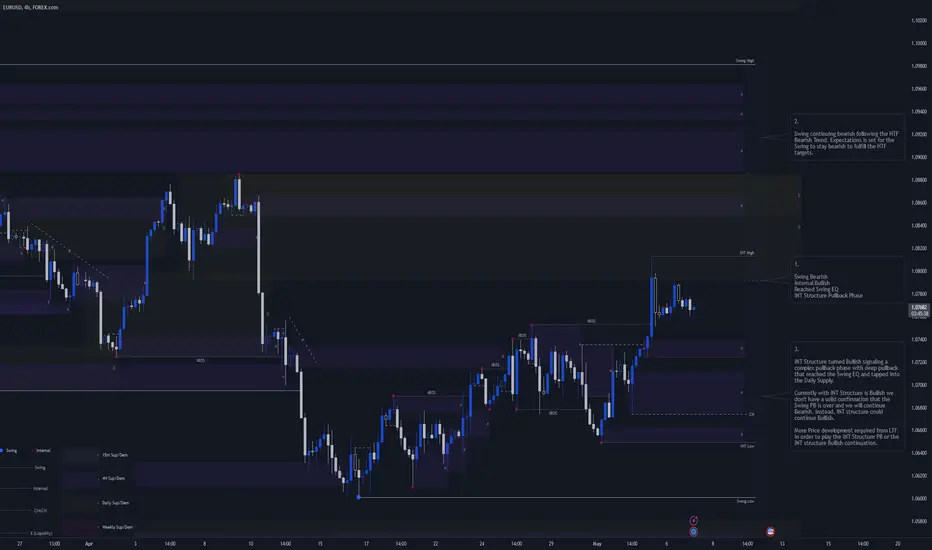
Weekly Chart Analysis
1.
Swing Bearish
Internal Bearish
Reached Swing EQ
Swing Continuation Phase (Pro Swing + Pro Internal)
2.
After the Bearish iBOS we confirmed that the Swing Pullback is over and we will target the Weak INT Low and the Weak Swing Low.
3.
Price had reached the Bearish INT Structure extreme and initiated the Bearish Internal Structure Continuation.
Expectation is to continue bearish and target he Weak INT Low.
4.
Price tapped into a Weekly demand zone that is currently providing Pullback for the continuation down to the Weak INT Low.
Daily Chart Analysis
1.
Swing Bearish
INT Bearish
Swing Continuation Phase (Pro Swing + Pro Internal)
2.
Internal Structure continuing bearish following the Bearish Swing.
3.
After the Bearish iBOS we expect a Pullback.
Price in a clear corrective move to the upside after tapping the Weekly Demand Zone which initiated the Bearish iBOS Pullback Phase.
As expected last week with the probability of a deep pullback, price reached the Daily Supply. With that deep Pullback, there is a HP that we can continue the Bearish INT Structure with expectation to target the Weak INT Low and possibly the Weak Swing Low.
More development required on LTF to show signs of Bearish Structure to validate the expectations.
4.
Daily and Weekly demand zones for reactions to fulfill the INT Pullback Phase.
4H Chart Analysis
1.
Swing Bearish
Internal Bullish
Reached Swing EQ
INT Structure Pullback Phase
2.
Swing continuing bearish following the HTF Bearish Trend. Expectations is set for the Swing to stay bearish to fulfill the HTF targets.
3.
With the 4H INT is Bullish, it's for me not much aligning with the Daily TF which makes the view unclear from a trend prospective.
Are we going to hold Bullish Internal to maybe have a more deeper PB on Daily, or we are going to turn bearish on the 4H Internal to continue the Daily Swing/INT Structure trend.
With the current week inflationary reports coming out from EU and US, most probably we will have more price development that can facilitate a HP setups.
Economic Events for the Week
EUR USD signal EUR/USD is the forex ticker that tells traders how many US Dollars are needed to buy a Euro. The Euro-Dollar pair is popular with traders because its constituents represent the two largest and most influential economies in the world. Follow real-time EUR/USD rates and improve your technical analysis with the interactive chart. Discover the factors that can influence the EUR/USD forecast and stay up to date with the latest EUR/USD news and analysis articles. Confirm signal

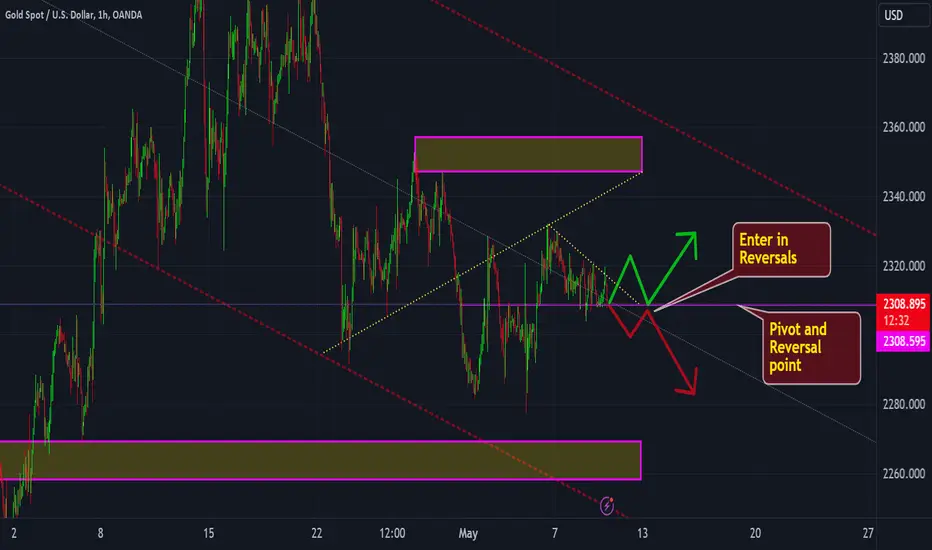
Gold (XAUUSD) Analysis:The next move for gold hinges on the unemployment news of Preliminary UoM Consumer Sentiment. Any breaks above or below 2320 or 2303 respectively indicate a continuation of the trend. Consider entering after a breakout or on reversals.
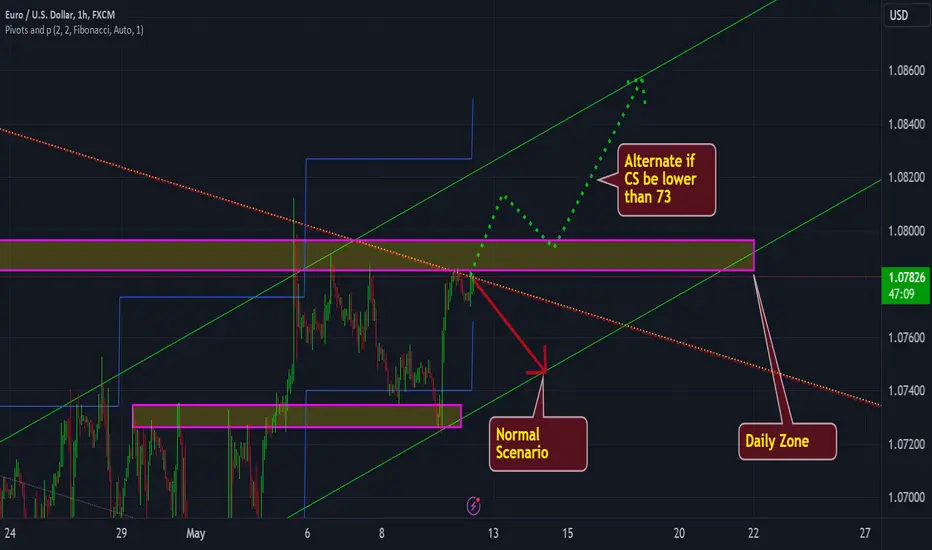
EURUSD: Regarding the NewsTwo scenarios:
If the composite index level based on surveyed consumers favors USD or remains normal, we'll follow the red path towards the bottom of the bullish channel.
If any announcement exceeds 77, there's a possibility of breaking below the bottom of the channel.
The dotted green path is in case of any surprise gains for the US dollar. In that scenario, we'll wait for a breakout of the zone and a reversal to it.
EUR USD signal EUR/USD is the forex ticker that tells traders how many US Dollars are needed to buy a Euro. The Euro-Dollar pair is popular with traders because its constituents represent the two largest and most influential economies in the world. Follow real-time EUR/USD rates and improve your technical analysis with the interactive chart. Discover the factors that can influence the EUR/USD forecast and stay up to date with the latest EUR/USD news and analysis articles. Confirm signal
EURUSD 9 May 2024 W19 - Intraday Analysis - US Jobless ClaimsThis is my Intraday analysis on EURUSD for 9 May 2024 W19 based on Smart Money Concept (SMC) which includes the following:
Market Sentiment
4H Chart Analysis
15m Chart Analysis
Market Sentiment
Nothing changed since the start of the week and as per Tuesday sentiment, investors are waiting for a catalyst to have a clear policy direction for the upcoming quarter.
4H Chart Analysis
1.
Swing Bearish
Internal Bullish
Reached Swing EQ
INT Structure Pullback Phase
2.
Swing continuing bearish following the HTF Bearish Trend. Expectations is set for the Swing to stay bearish to fulfill the HTF targets.
3.
Nothing much changed since yesterday as we just tapping into a demand zone (FLIP) that may provide some bullish reaction.
INT Structure turned Bullish signaling a complex pullback phase with deep pullback that reached the Swing EQ and tapped into the Daily Supply.
Currently with INT Structure is Bullish we don't have a solid confirmation that the Swing PB is over and we will continue Bearish. Instead, INT structure could continue Bullish.
More Price development required from LTF in order to play the INT Structure PB or the INT structure Bullish continuation.
15m Chart Analysis
1.
Swing Bullish
Internal Bullish
Long : Phase B (LP)
Short : Phase C (HP)
2.
Finally we are barely out from Friday NFP Range and price still ranging with clear direction.
With a Bearish iBOS we confirmed the 15m Swing Pullback.
Currently price tapped and formed Bullish Sub-Internal Structure that is facilitating the INT Pullback.
Not convinced much of Longs as per our position in the HTF (Tapped into Daily Supply), instead will follow the Bearish INT Structure and look for Shorts from 15m Supply that are well positioned within the Swing.
3.
15m/4H Demand zones for possible longs one reached.
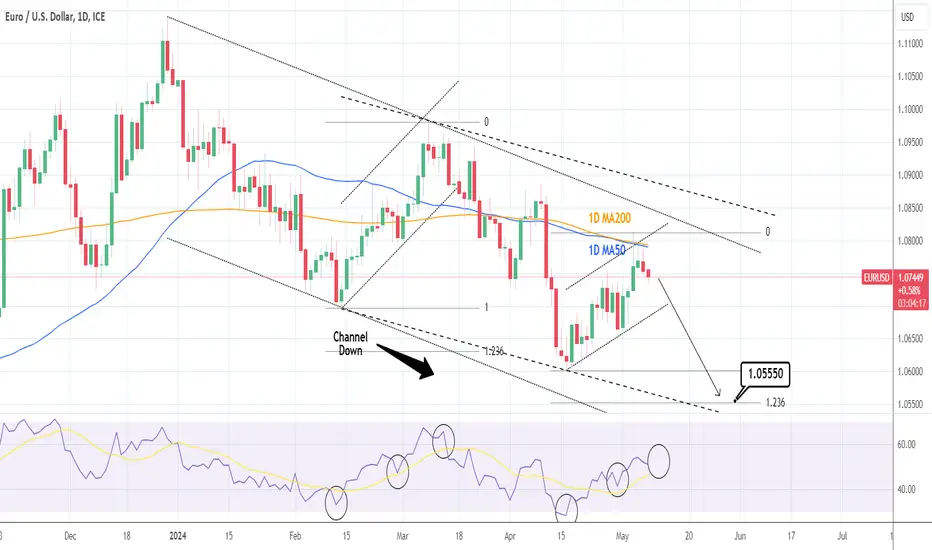
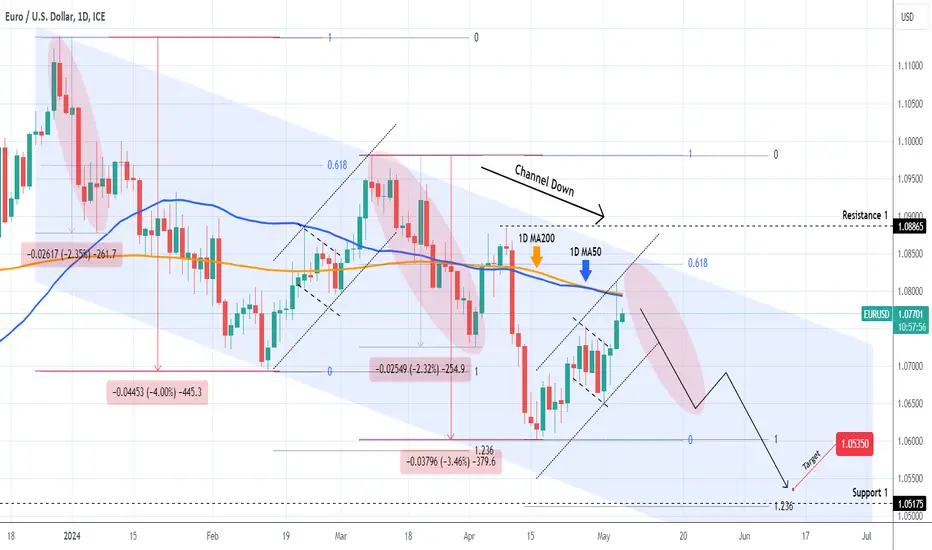
EURUSD: 1D MA50-200 rejection. Strong sell.EURUSD is neutral on its 1D technical outlook (RSI = 51.370, MACD = -0.001, ADX = 29.673) as it got rejected on the 1D MA50-MA200 level, which stopped the bullish wave of the Channel Up from extending higher and potential breaking the pattern. The 1D RSI is on the stage where it should reverse as per March 12th. This is a strong sell signal, TP = 1.05550 (the 1.236 Fibonacci extension level).
## If you like our free content follow our profile to get more daily ideas. ##
## Comments and likes are greatly appreciated. ##
EURUSD Analysis:
Previously, we witnessed a strong reaction around the selling zone.
Consider a safe entry after a complete break of the short-term bullish channel and a drop below 1.0726.
A slightly riskier entry point is around 1.0760.
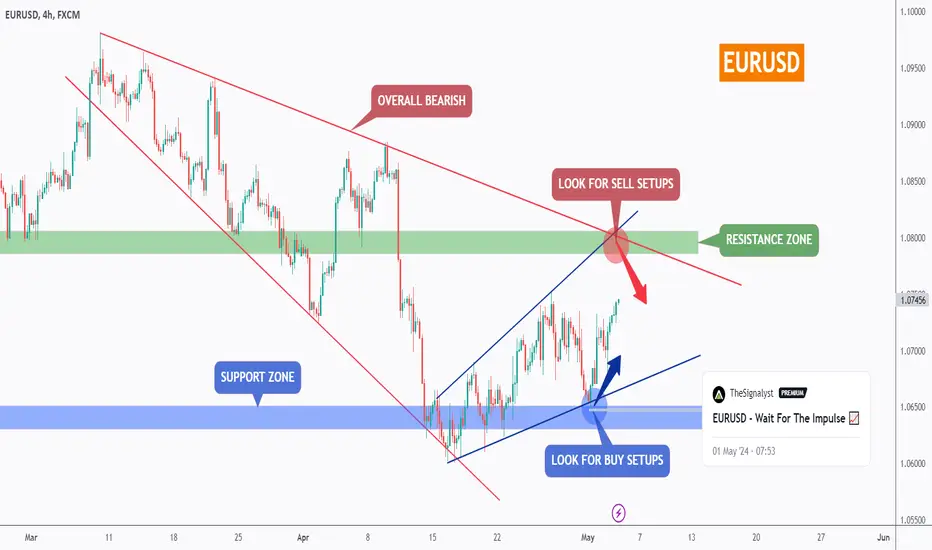
EURUSD - 📈 => 📉Hello TradingView Family / Fellow Traders. This is Richard, also known as theSignalyst.
As per my last analysis (attached on the chart), EURUSD rejected our blue circle zone and traded higher.
What's next?
📈 EURUSD has been overall bearish long-term , trading within the falling wedge pattern in red.
Currently, EURUSD is approaching the upper bound of the wedge pattern.
Moreover, the green zone is a strong resistance.
🏹 Thus, the highlighted red circle is a strong area to look for sell setups as it is the intersection of the green resistance and upper red trendline.
📚 As per my trading style:
As #EURUSD approaches the red circle zone, I will be looking for bearish reversal setups (like a double top pattern, trendline break , and so on...)
📚 Always follow your trading plan regarding entry, risk management, and trade management.
Good luck!
All Strategies Are Good; If Managed Properly!
~Rich
EURUSD 8 May 2024 W19 - Intraday AnalysisThis is my Intraday analysis on EURUSD for 8 May 2024 W19 based on Smart Money Concept (SMC) which includes the following:
Market Sentiment
4H Chart Analysis
15m Chart Analysis
Market Sentiment
Nothing changed since the start of the week and as per yesterday sentiment here, investors are waiting for a catalyst to have a clear policy direction for the upcoming quarter.
4H Chart Analysis
1.
Swing Bearish
Internal Bullish
Reached Swing EQ
INT Structure Pullback Phase
2.
Swing continuing bearish following the HTF Bearish Trend. Expectations is set for the Swing to stay bearish to fulfill the HTF targets.
3.
Nothing much changed since yesterday as we just tapping into a demand zone (FLIP) that may provide some bullish reaction.
INT Structure turned Bullish signaling a complex pullback phase with deep pullback that reached the Swing EQ and tapped into the Daily Supply.
Currently with INT Structure is Bullish we don't have a solid confirmation that the Swing PB is over and we will continue Bearish. Instead, INT structure could continue Bullish.
More Price development required from LTF in order to play the INT Structure PB or the INT structure Bullish continuation.
15m Chart Analysis
1.
Swing Bullish
Internal Bullish
Long : Phase B (LP)
Short : Phase C (HP)
2.
Finally we are barely out from Friday NFP Range.
With a Bearish iBOS we confirmed the 15m Swing Pullback.
Currently price tapped into a 4H Demand which could initiate the INT Structure PB.
Bullish CHoCH will be the first sign that the INT PB is starting.
Not convinced much of Longs as per our position in the HTF (Tapped into Daily Supply), instead will follow the Bearish INT Structure and look for Shorts from 15m Supply that are well positioned within the Swing.
3.
15m/4H Demand zones for possible longs one reached.
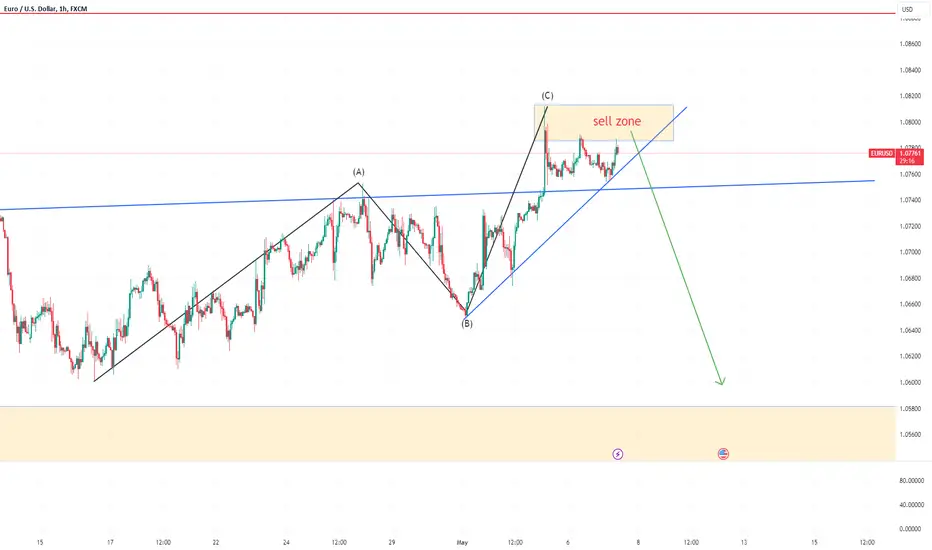
EUR/USD Ready to short!(5/7/2024)In our last analysis, EUR/USD FX:EURUSD
Continued the mini bullish move(retracement) and right now the price is ranging.
We believe the price has finished the correction phase and is ready to start a new bearish move.
Our technical view has been shown in the chart.
If you like it then Support us by Like, Following, and Sharing.
Thanks For Reading
Team Fortuna
-RC
(Disclaimer: Published ideas and other Contents on this page are for educational purposes and do not include a financial recommendation. Trading is Risky, so before any action do your research.
EURUSD Analysis:
Consider a risky long position as we approach the top of a bearish channel, typically a prime spot to go short. However, there's potential for a long opportunity, albeit with reduced risk. Keep an eye on the 1.0730 level, as a break below could change the bearish outlook.
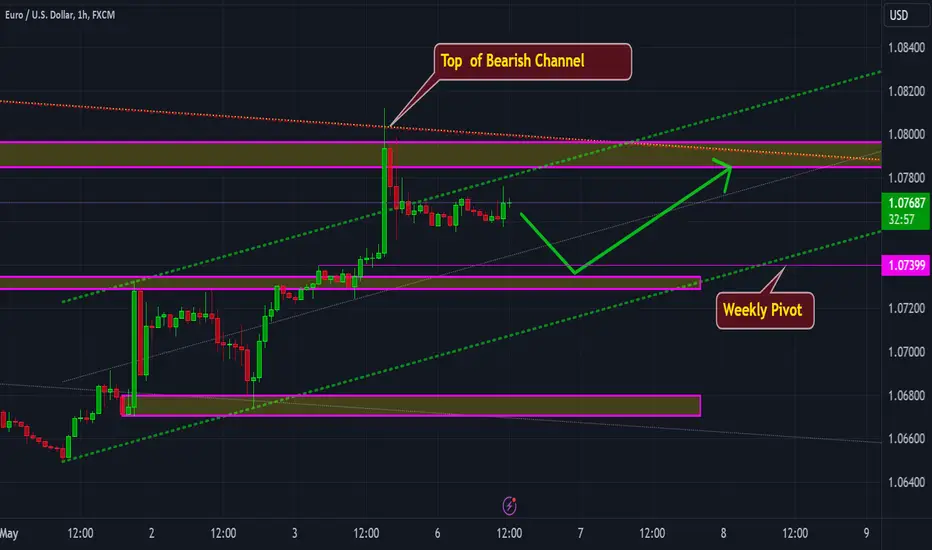
EURUSD 7 May 2024 W19 - Intraday Analysis - EU Retail SalesThis is my Intraday analysis on EURUSD for 7 May 2024 W19 based on Smart Money Concept (SMC) which includes the following:
Market Sentiment
4H Chart Analysis
15m Chart Analysis
Market Sentiment
Today's sentiment for EUR/USD pair is shaped by pivotal occurrences from the previous week. The release of weaker-than-anticipated Non-Farm Payroll (NFP) data prompted a decline in the US dollar, lending some buoyancy to the EUR/USD pair. Additionally, the Federal Open Market Committee (FOMC) statement and remarks from Federal Reserve Chair Jerome Powell wielded considerable influence. The FOMC opted to maintain the policy interest rate and continue tapering securities holdings. Powell reiterated the Fed's unwavering commitment to achieving their 2% inflation target. Consequently, there's a prevailing bearish sentiment towards the US dollar, keeping the EUR/USD pair comfortably above the 1.0750 threshold. However, the market remains vigilant ahead of this week's data releases.
4H Chart Analysis
1.
Swing Bearish
Internal Bullish
Reached Swing EQ
INT Structure Pullback Phase
2.
Swing continuing bearish following the HTF Bearish Trend. Expectations is set for the Swing to stay bearish to fulfill the HTF targets.
3.
INT Structure turned Bullish signaling a complex pullback phase with deep pullback that reached the Swing EQ and tapped into the Daily Supply.
Currently with INT Structure is Bullish we don't have a solid confirmation that the Swing PB is over and we will continue Bearish. Instead, INT structure could continue Bullish.
More Price development required from LTF in order to play the INT Structure PB or the INT structure Bullish continuation.
15m Chart Analysis
1.
Swing Bullish
Internal Bullish
Long : Phase A2
Short : Phase D
2.
Nothing changed since yesterday, price still ranging!
Swing failed to continue Bearish and with NFP we created a Bullish BOS which reached the Daily Supply Zone.
After a BOS we expect a Pullback. INT structure is Bullish which means we still in Bullish continuation.
With the 4H created a Bullish iBOS and requesting a Pullback, i prefer to look for Shorts after a Bearish iBOS.
Longs will be ideal for me when we reach the 4H demand zone within the 15m Swing.
3.
15m/4H Demand zones for possible longs one reached.
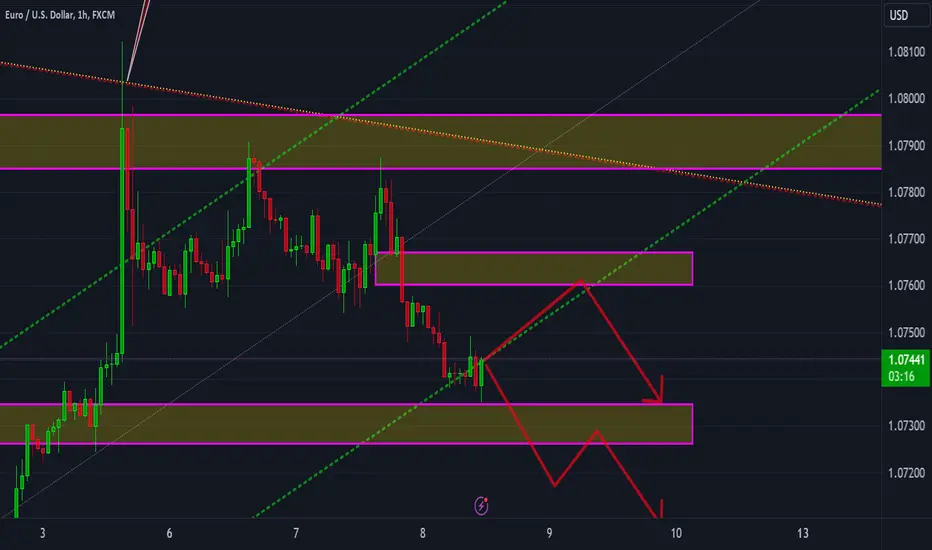
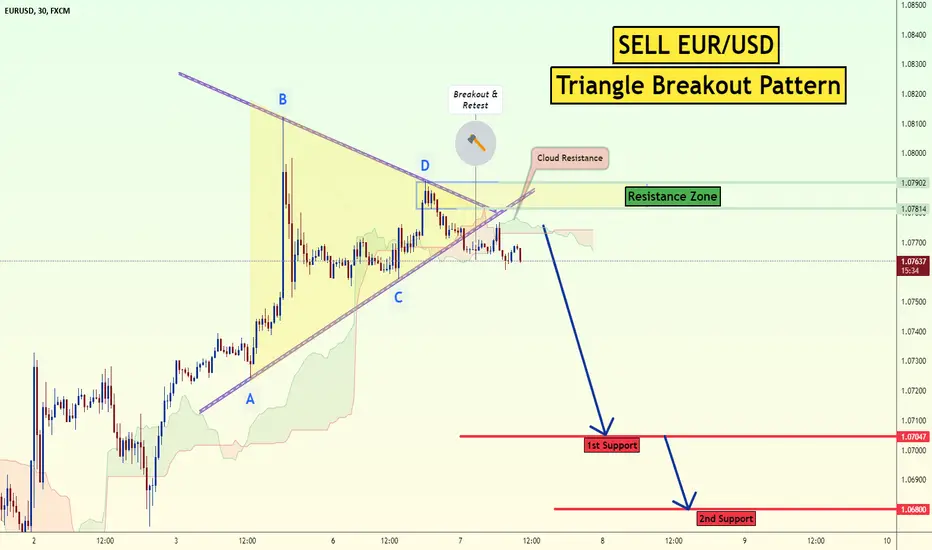
Sell EUR/USD Triangle BreakoutThe EUR/USD pair on the M30 timeframe presents a potential shorting opportunity due to a recent breakout from a triangle pattern.
Entry: Consider entering a short position (selling) below the broken support trendline of the triangle after confirmation. Ideally, this would be around 1.0770 or lower if the price continues to decline.
Target Levels:
1.0704: This represents the height of the triangle, measured from its apex (highest or lowest point) to the breakout point, projected downwards from the breakout point.
1.0680: This is a further extension of the downside target, based on the height of the recent price movement before the breakout.
Stop-Loss: Once the entry point is confirmed, place a stop-loss order above the broken support line of the triangle, ideally with some buffer around 1.0800. This helps limit potential losses if the price unexpectedly reverses and breaks back upwards.
Thank you.
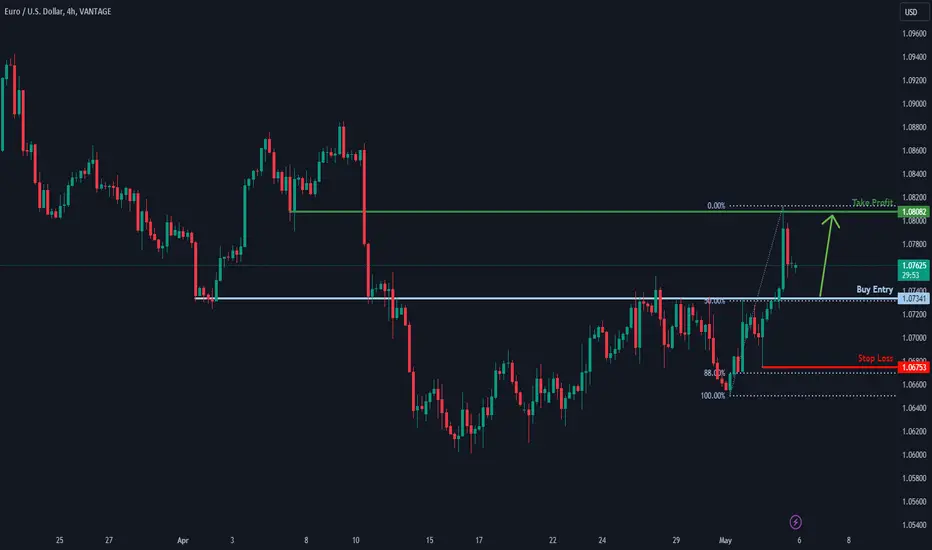
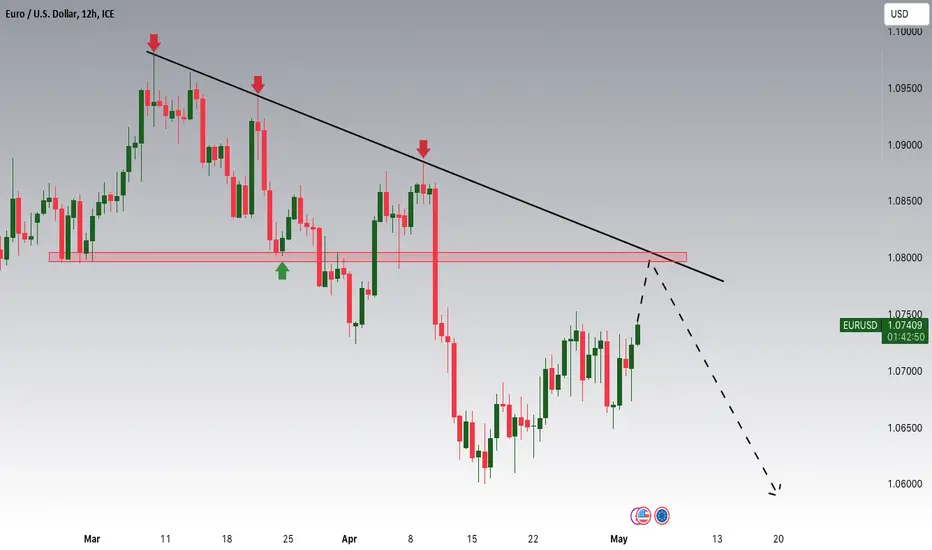
EURUSD Channel Top and Fib Resistance. Time to turn bearish.The EURUSD pair gave us an excellent pull-back buy entry last week (April 30, see chart below) and has almost reached our 1.08300 Target, which was the 0.618 Fibonacci retracement level:
We now turn bearish as not only is the price near the 0.618 Fib but also hit on Friday and gor rejected on the 1D MA50 (blue trend-line)/ 1D MA200 (orange trend-line) cluster. Above all, we are near the top (Lower Highs trend-line) of the 2024 Channel Down.
The last Lower Low was priced just above the 1.236 Fib extension, which on the current Leg happens to be exactly on the 1.05175 Support. As a result our new Target for the medium-term is 1.05350 (just above the 1.236 Fib ext).
-------------------------------------------------------------------------------
** Please LIKE 👍, FOLLOW ✅, SHARE 🙌 and COMMENT ✍ if you enjoy this idea! Also share your ideas and charts in the comments section below! This is best way to keep it relevant, support us, keep the content here free and allow the idea to reach as many people as possible. **
-------------------------------------------------------------------------------
💸💸💸💸💸💸
👇 👇 👇 👇 👇 👇
EURUSD 6 May 2024 W19 - Intraday Analysis - EU PMIThis is my Intraday analysis on EURUSD for 6 May 2024 W19 based on Smart Money Concept (SMC) which includes the following:
Market Sentiment
4H Chart Analysis
15m Chart Analysis
Market Sentiment
Nothing changed from Friday, the EUR/USD surged to reach a new high for the week, surpassing recent congestion levels. This uptick followed a significant shortfall in the US Nonfarm Payrolls (NFP) data regarding labor and wages. The disappointing figures revived expectations across the market for a quicker pace of Federal Reserve (Fed) rate reductions.
4H Chart Analysis
1.
Swing Bearish
Internal Bullish
Reached Swing EQ
INT Structure Pullback Phase
2.
Swing continuing bearish following the HTF Bearish Trend. Expectations is set for the Swing to stay bearish to fulfill the HTF targets.
3.
INT Structure turned Bullish signaling a complex pullback phase with deep pullback that reached the Swing EQ and tapped into the Daily Supply.
Currently with INT Structure is Bullish we don't have a solid confirmation that the Swing PB is over and we will continue Bearish. Instead, INT structure could continue Bullish.
More Price development required from LTF in order to play the INT Structure PB or the INT structure Bullish continuation.
15m Chart Analysis
1.
Swing Bullish
Internal Bullish
Long : Phase A2
Short : Phase D
2.
Swing failed to continue Bearish and with NFP we created a Bullish BOS which reached the Daily Supply Zone.
After a BOS we expect a Pullback. INT structure is Bullish which means we still in Bullish continuation.
With the 4H created a Bullish iBOS and requesting a Pullback, i prefer to look for Shorts after a Bearish iBOS.
Longs will be ideal for me when we reach the 4H demand zone within the 15m Swing.
3.
15m/4H Demand zones for possible longs one reached.
Bullish bounce off 50% Fibonacci support?The Fiber (EUR/USD) is falling towards the pivot and could potentially bounce to the 1st resistance.
Pivot: 1.07298
1st Support: 1.06919
1st Resistance: 1.08100
Risk Warning:
Trading Forex and CFDs carries a high level of risk to your capital and you should only trade with money you can afford to lose. Trading Forex and CFDs may not be suitable for all investors, so please ensure that you fully understand the risks involved and seek independent advice if necessary.
Disclaimer:
The above opinions given constitute general market commentary, and do not constitute the opinion or advice of IC Markets or any form of personal or investment advice.
Any opinions, news, research, analyses, prices, other information, or links to third-party sites contained on this website are provided on an "as-is" basis, are intended only to be informative, is not an advice nor a recommendation, nor research, or a record of our trading prices, or an offer of, or solicitation for a transaction in any financial instrument and thus should not be treated as such. The information provided does not involve any specific investment objectives, financial situation and needs of any specific person who may receive it. Please be aware, that past performance is not a reliable indicator of future performance and/or results. Past Performance or Forward-looking scenarios based upon the reasonable beliefs of the third-party provider are not a guarantee of future performance. Actual results may differ materially from those anticipated in forward-looking or past performance statements. IC Markets makes no representation or warranty and assumes no liability as to the accuracy or completeness of the information provided, nor any loss arising from any investment based on a recommendation, forecast or any information supplied by any third-party.
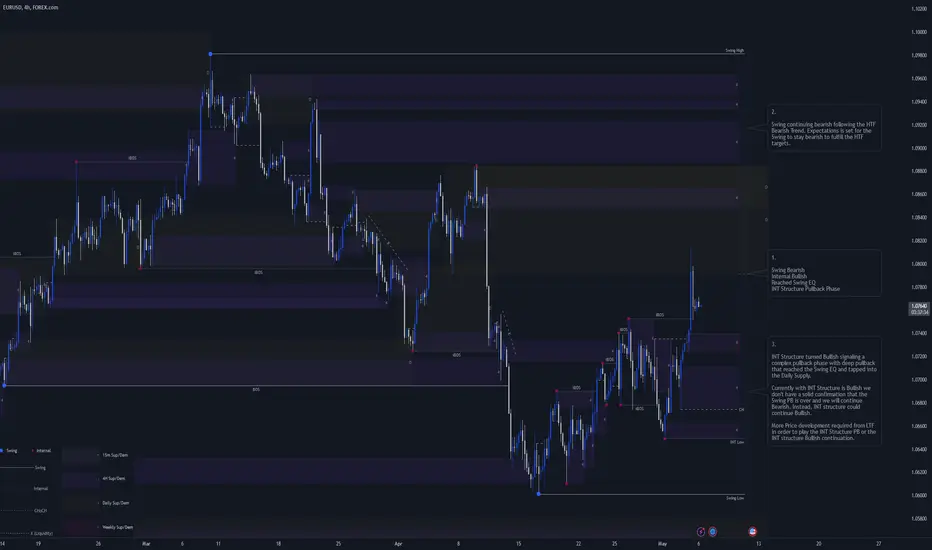
EURUSD 6-10 May 2024 W19 Weekly AnalysisThis is my Weekly analysis on EURUSD for 6-10 May 2024 W19 based on Smart Money Concept (SMC) which includes the following:
Market Sentiment
Weekly Chart Analysis
Daily Chart Analysis
4H Chart Analysis
Economic Events for the Week
Market Sentiment
On Friday, the EUR/USD surged to reach a new high for the week, surpassing recent congestion levels. This uptick followed a significant shortfall in the US Nonfarm Payrolls (NFP) data regarding labor and wages. The disappointing figures revived expectations across the market for a quicker pace of Federal Reserve (Fed) rate reductions.
Weekly Chart Analysis
1.
Swing Bearish
Internal Bearish
Reached Swing EQ
Swing Continuation Phase (Pro Swing + Pro Internal)
2.
After the Bearish iBOS we confirmed that the Swing Pullback is over and we will target the Weak INT Low and the Weak Swing Low.
3.
Price had reached the Bearish INT Structure extreme and initiated the Bearish Internal Structure Continuation.
Expectation is to continue bearish and target he Weak INT Low.
4.
Price tapped into a Weekly demand zone that is currently providing Pullback for the continuation down to the Weak INT Low.
Daily Chart Analysis
1.
Swing Bearish
INT Bearish
Swing Continuation Phase (Pro Swing + Pro Internal)
2.
Internal Structure continuing bearish following the Bearish Swing.
3.
After the Bearish iBOS we expect a Pullback.
Price in a clear corrective move to the upside after tapping the Weekly Demand Zone which initiated the Bearish iBOS Pullback Phase.
As expected last week with the probability of a deep pullback, price reached the Daily Supply. With that deep Pullback, there is a HP that we can continue the Bearish INT Structure with expectation to target the Weak INT Low and possibly the Weak Swing Low.
More development required on LTF to show signs of Bearish Structure to validate the expectations.
4.
Daily and Weekly demand zones for reactions to fulfill the INT Pullback Phase.
4H Chart Analysis
1.
Swing Bearish
Internal Bullish
Reached Swing EQ
INT Structure Pullback Phase
2.
Swing continuing bearish following the HTF Bearish Trend. Expectations is set for the Swing to stay bearish to fulfill the HTF targets.
3.
INT Structure turned Bullish signaling a complex pullback phase with deep pullback that reached the Swing EQ and tapped into the Daily Supply.
Currently with INT Structure is Bullish we don't have a solid confirmation that the Swing PB is over and we will continue Bearish. Instead, INT structure could continue Bullish.
More Price development required from LTF in order to play the INT Structure PB or the INT structure Bullish continuation.
Economic Events for the Week
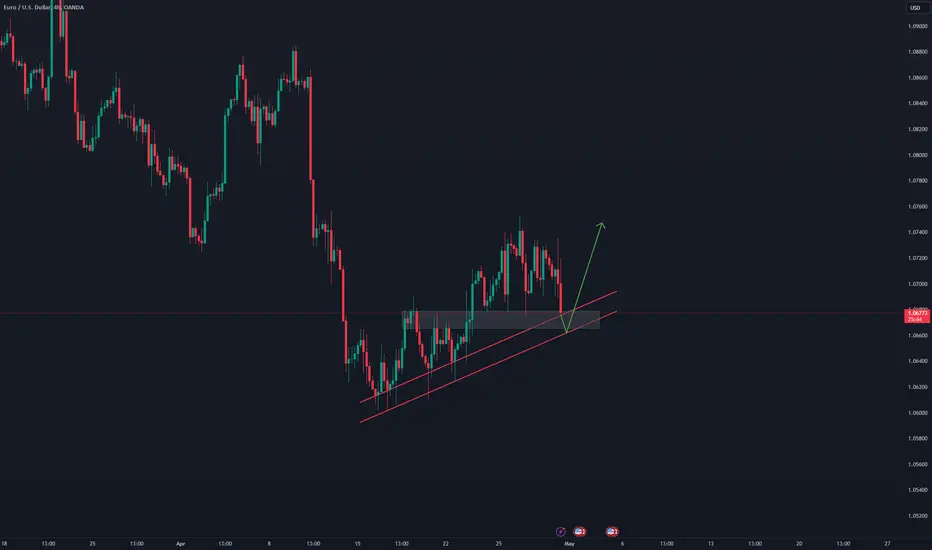
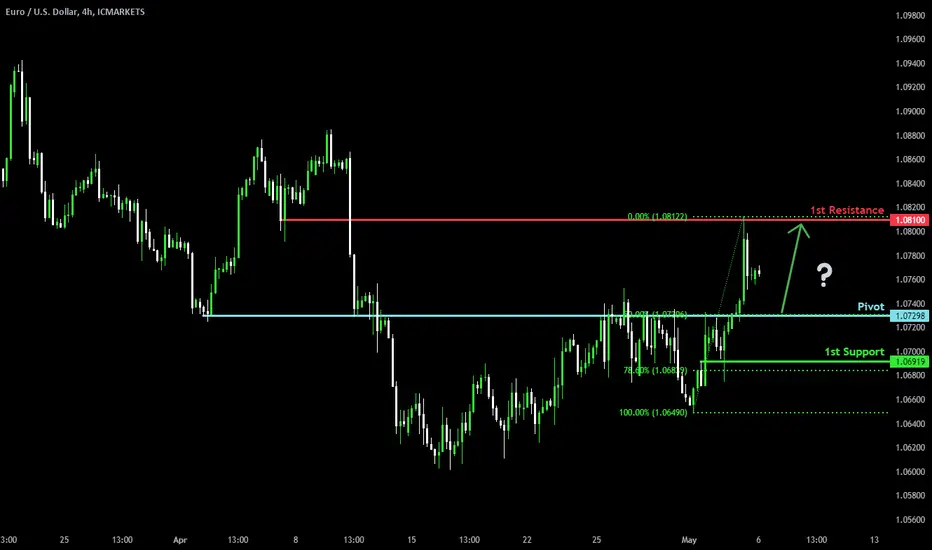
Falling towards 50% Fibonacci support, could it bounce?EUR/USD is falling toward the support level, which is a pullback support that aligns with the 50% Fibonacci retracement, and could bounce from this level to our take profit.
Entry: 1.07341
Why we like it:
There is a pullback support level which aligns with the 50% Fibonacci retracement.
Stop loss: 1.06753
Why we like it:
There is a pullback support level which aligns with the 88% Fibonacci retracement.
Take profit: 1.08082
Why we like it:
There is a pullback resistance level.
Please be advised that the information presented on TradingView is provided to Vantage (‘Vantage Global Limited’, ‘we’) by a third-party provider (‘Everest Fortune Group’). Please be reminded that you are solely responsible for the trading decisions on your account. There is a very high degree of risk involved in trading. Any information and/or content is intended entirely for research, educational and informational purposes only and does not constitute investment or consultation advice or investment strategy. The information is not tailored to the investment needs of any specific person and therefore does not involve a consideration of any of the investment objectives, financial situation or needs of any viewer that may receive it. Kindly also note that past performance is not a reliable indicator of future results. Actual results may differ materially from those anticipated in forward-looking or past performance statements. We assume no liability as to the accuracy or completeness of any of the information and/or content provided herein and the Company cannot be held responsible for any omission, mistake nor for any loss or damage including without limitation to any loss of profit which may arise from reliance on any information supplied by Everest Fortune Group.
EURUSD:
A bearish channel is evident on the daily chart.
There's a clear zone marked on the daily chart.
Additionally, a short-term bullish channel is noticeable on the daily chart.
Upon examining the 1-hour chart, we identify another broken zone, indicating a potential entry point for the trade
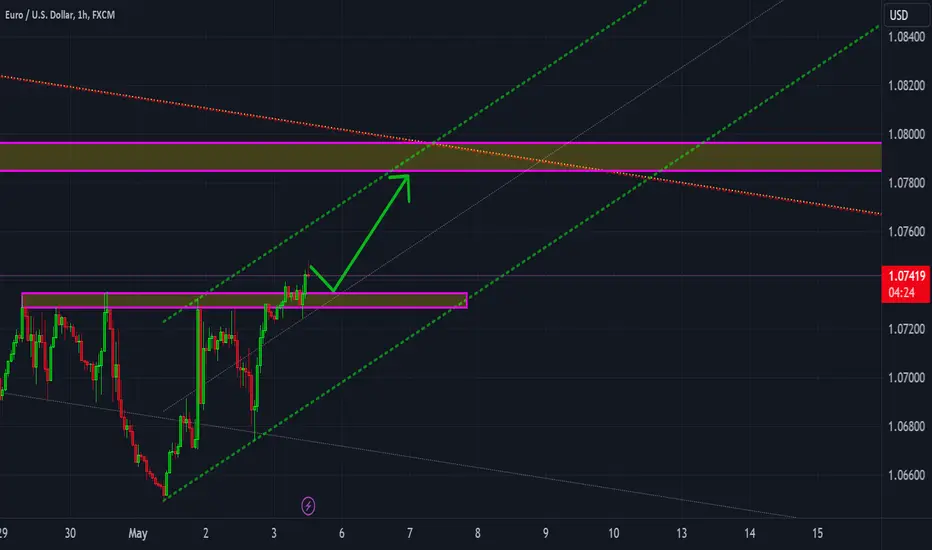
EURUSD is approaching the daily trendHey Traders, in today's trading session we are monitoring EURUSD for a selling opportunity around 1.08000, EURUSD is trading in a downtrend and currently is in a correction phase in which it is approaching the trend at 1.08000 support and resistance area.
Trade safe, Joe.
Analysis on EUR | Time to Buy? EURUSD is moving above an ascending trendline on the 4-hour timeframe and currently retesting this trendline.
Considering the situation of the Dollar index and the possibility of a downward movement in the Dollar index, we can expect a bullish move from this range. 📈💶