EURUSD 22-26 Apr 2024 W17 Weekly Analysis – EU PMI / US PCEThis is my Weekly analysis on EURUSD for 22-26 Apr 2024 W16 based on Smart Money Concept (SMC) which includes the following:
Market Sentiment
Weekly Chart Analysis
Daily Chart Analysis
4H Chart Analysis
Economic Events for the Week
Market Sentiment
In light of the recent passage of an aid bill for Ukraine, Israel, and Taiwan by the U.S. House of Representatives, it is anticipated that this could escalate geopolitical tensions. This, in turn, may prompt investors to seek refuge in safe-haven assets, thereby bolstering the strength of the U.S. dollar. This trend is likely to be further reinforced by the divergent monetary policies of the Federal Reserve and the European Central Bank.
The market will also be looking at the release of the Personal Consumption Expenditures (PCE) index, which is the Fed’s preferred measure of inflation.
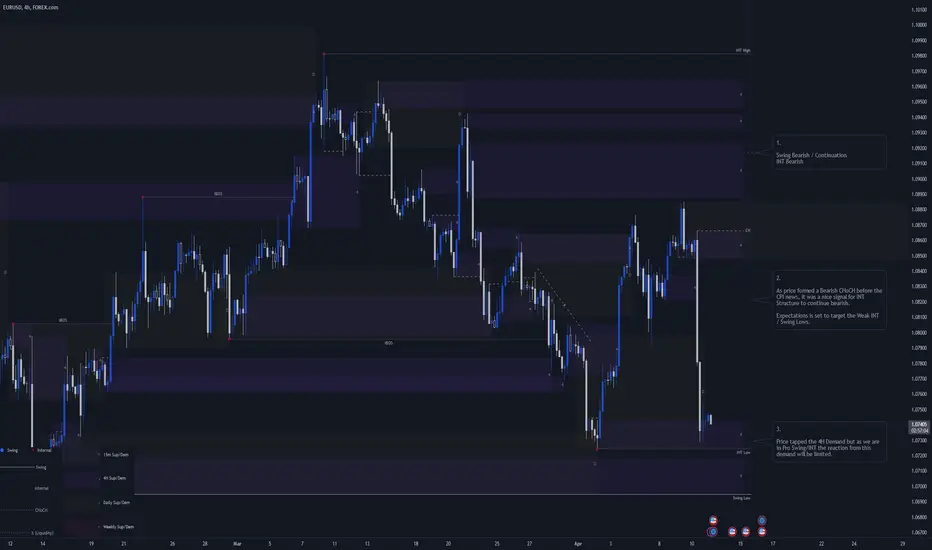
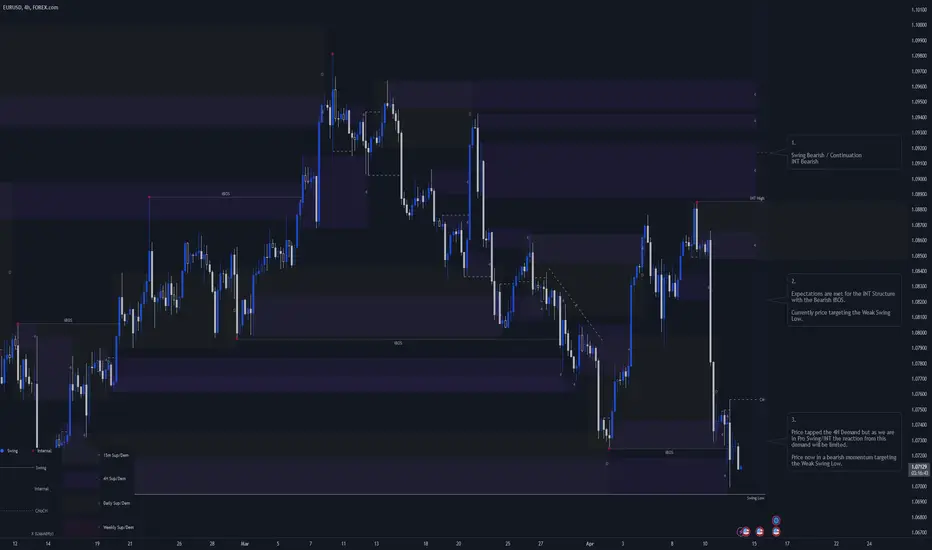
Weekly Chart Analysis
1.
Swing Bearish
Internal Bearish
Reached Swing EQ
Swing Continuation Phase (Pro Swing + Pro Internal)
2.
After the Bearish iBOS we confirmed that the Swing Pullback is over and we will target the Weak INT Low and the Weak Swing Low.
3.
Price had reached the Bearish INT Structure extreme and initiated the Bearish Internal Structure Continuation.
Expectation is to continue bearish and target he Weak INT Low.
Daily Chart Analysis
1.
Swing Bearish
INT Bearish
Swing Continuation Phase (Pro Swing + Pro Internal)
2.
Internal Structure continuing bearish following the Bearish Swing.
3.
After the Bearish iBOS we expect a Pullback.
Currently price is within the Weekly Demand and swept Liq from the left.
Price could initiate a PB at anytime or after reaching the Daily Extreme Demand.
CHoCH is currently away from current price so maybe we can create a new low before we initiate the INT PB Phase.
More price development required.
4.
Daily and Weekly demand zones for reactions to fulfill the INT Pullback Phase.
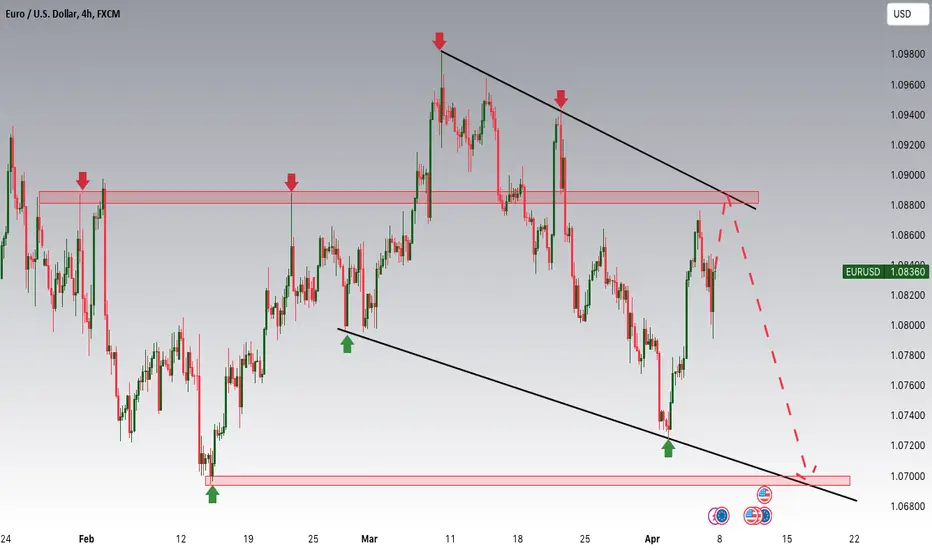
4H Chart Analysis
1.
Swing Bearish
Internal Bearish
INT / Swing Pullback Phase
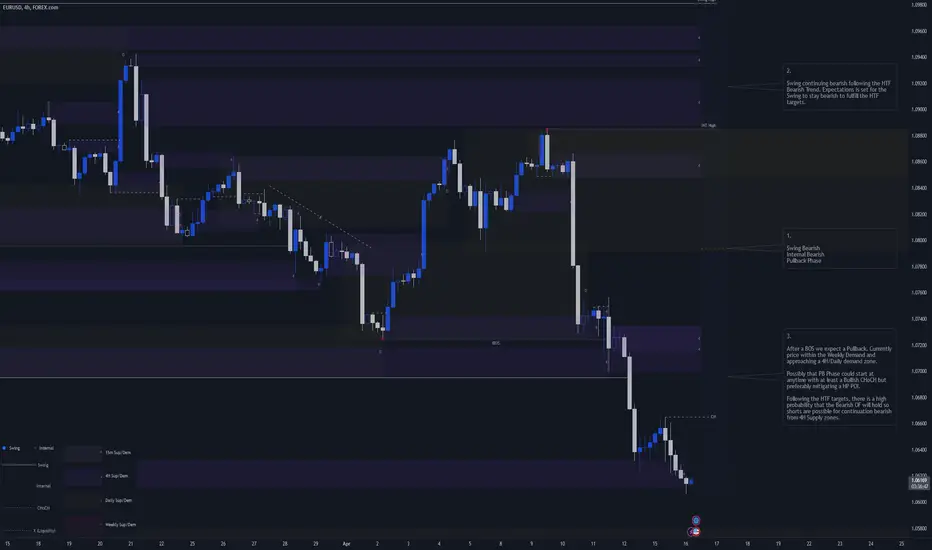
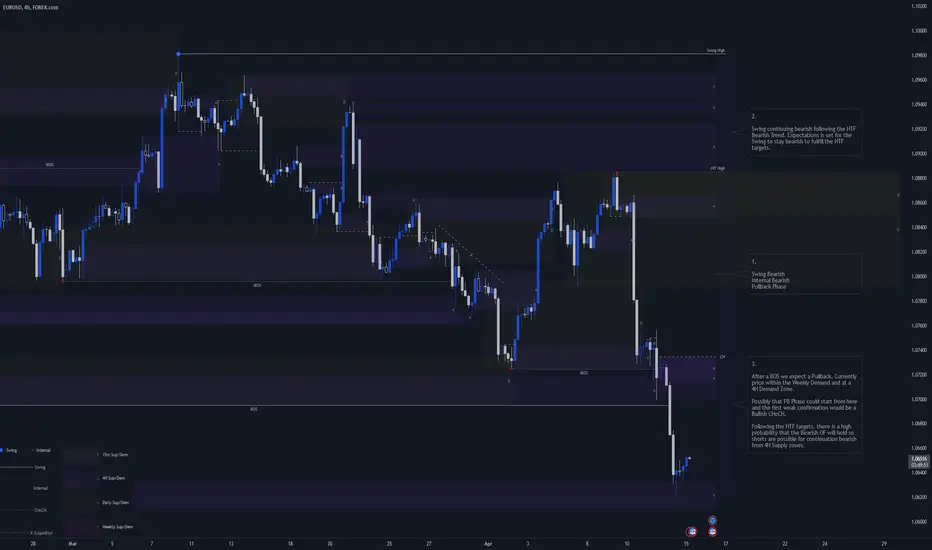
2.
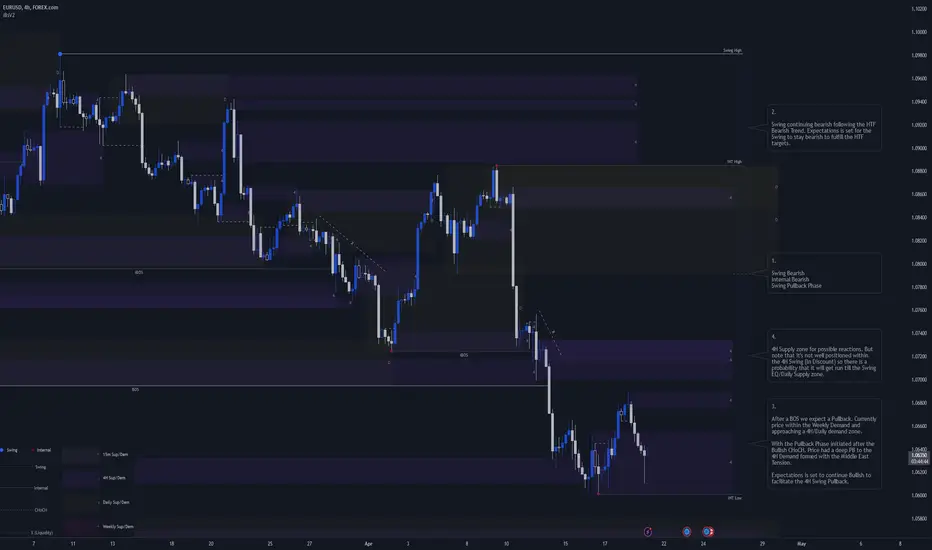
Swing continuing bearish following the HTF Bearish Trend. Expectations is set for the Swing to stay bearish to fulfill the HTF targets.
3.
After a BOS we expect a Pullback. Currently price within the Weekly Demand and approaching a 4H/Daily demand zone.
With the INT Structure Pullback Phase initiated after the Bullish CHoCH. Price had a deep PB to the 4H Demand formed.
Expectations is set to continue Bullish to facilitate the 4H INT and Swing Pullback Phases.
4.
4H Supply zone for possible reactions. But note that it's not well positioned within the 4H Swing (In Discount) so there is a probability that it will get run till the Swing EQ/Daily Supply zone.
Economic Events for the Week
Eur-usd
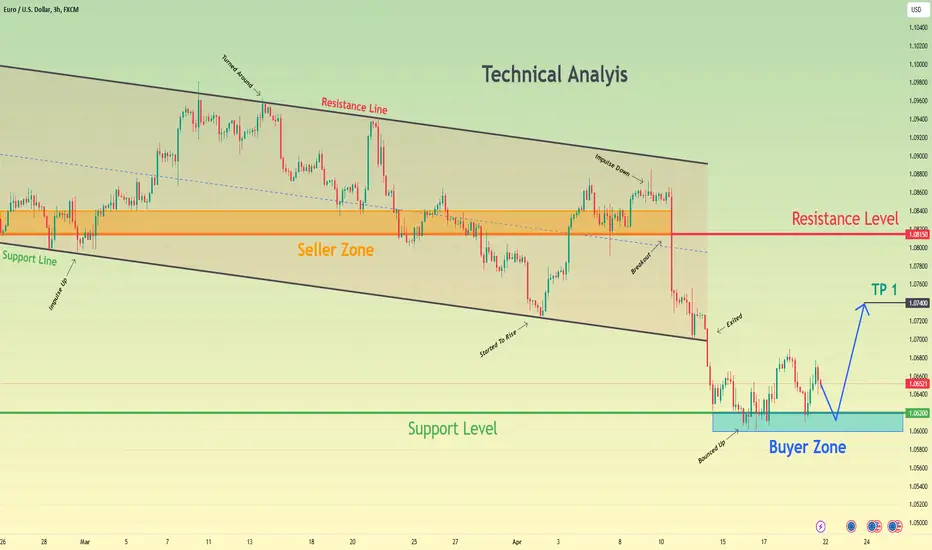
Euro can decline to buyer zone again and then start to riseHello traders, I want share with you my opinion about Euro. By observing the chart, we can see that the price a not long time ago entered to downward channel, where firstly it broke the resistance level, which coincided with the seller zone and rose to the resistance line of the channel. Next, the price turned around and soon fell to the seller zone, but later price tried to back up and failed, after which in a short time Euro declined to support line of the downward channel, breaking the 1.0815 level. But then, the price started to rise and soon backed up to the seller zone, after which it some time traded near this area, and then made a strong downward impulse to support level, exiting from the channel and breaking the 1.08150 level one more time. Price started to trades near the 1.0620 support level, which coincided with the buyer zone and sometimes it even declined to this area, but a not long time ago EUR rebounded up. So, in my opinion, the Euro can decline to the buyer zone again, and then repeat movement up higher current location. For this case, my 1st TP is located at the 1.0740 points. Please share this idea with your friends and click Boost 🚀
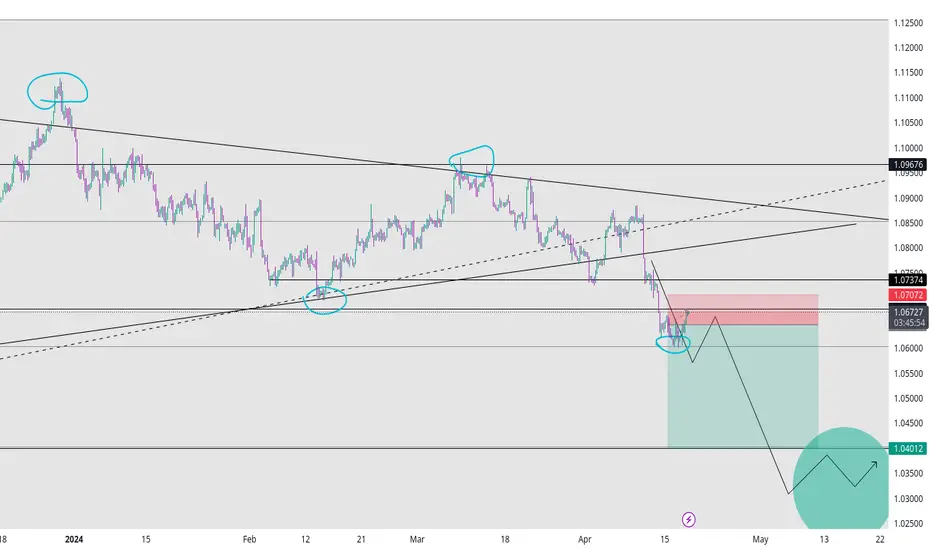
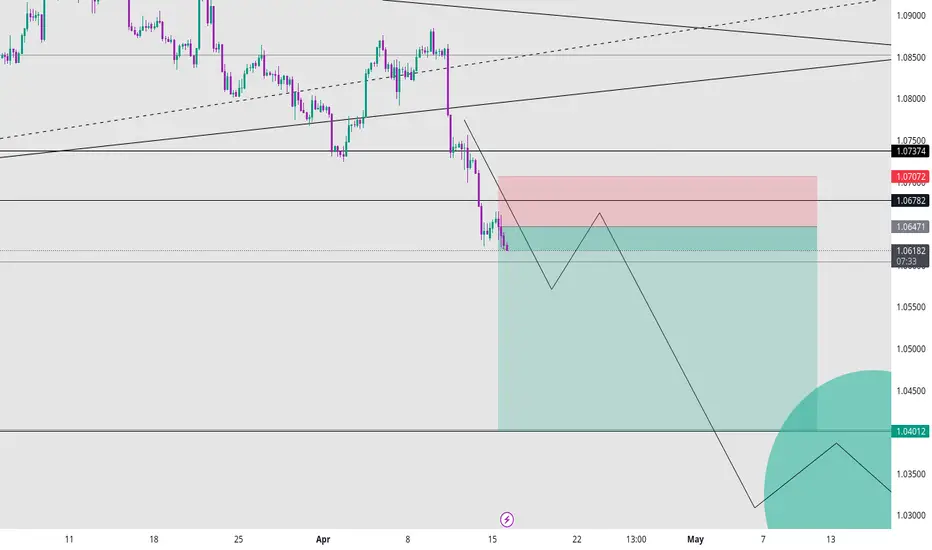
EURUSD One last dump before the pump?The EURUSD pair is approaching the 1.05500 Target that we called on April 02 (see chart below), which is at the bottom of the 4-month Channel Down:
That will form the new Lower Low of the pattern, completing a -4.00% decline from the Lower High, which is 100% symmetrical with the previous Low. The structure of the Legs is very symmetrical so after the Low we expect the pair to turn bullish on the medium-term again. Our Target will be 1.0800 (just below the 0.618 Fibonacci retracement level).
-------------------------------------------------------------------------------
** Please LIKE 👍, FOLLOW ✅, SHARE 🙌 and COMMENT ✍ if you enjoy this idea! Also share your ideas and charts in the comments section below! This is best way to keep it relevant, support us, keep the content here free and allow the idea to reach as many people as possible. **
-------------------------------------------------------------------------------
💸💸💸💸💸💸
👇 👇 👇 👇 👇 👇
EURUSD 19 Apr 2024 W16 - Intraday Analysis - Middle East TensionThis is my Intraday analysis on EURUSD for 19 Apr 2024 W16 based on Smart Money Concept (SMC) which includes the following Time Frames:
4H
15m
Prior to delving into the Intraday Analysis, I emphasized the significance of the ongoing Weekly Analysis, particularly in light of heightened tensions in the Middle East following Iran's strike on Israel. Monitoring these tensions and the subsequent reports from Israel regarding a response to Iran's strike, it's crucial to anticipate the potential for another volatile weekend, prompting investors to seek refuge in safe havens such as the US Dollar, GOLD, JPY, and CHF. Stay alert to any shifts towards safe havens today amid the uncertain situation in the Middle East leading into the weekend.
4H Chart Analysis
1.
Swing Bearish
Internal Bearish
Swing Pullback Phase
2.
Swing continuing bearish following the HTF Bearish Trend. Expectations is set for the Swing to stay bearish to fulfill the HTF targets.
3.
After a BOS we expect a Pullback. Currently price within the Weekly Demand and approaching a 4H/Daily demand zone.
With the Pullback Phase initiated after the Bullish CHoCH. Price had a deep PB to the 4H Demand formed with the Middle East Tension.
Expectations is set to continue Bullish to facilitate the 4H Swing Pullback.
4.
4H Supply zone for possible reactions. But note that it's not well positioned within the 4H Swing (In Discount) so there is a probability that it will get run till the Swing EQ/Daily Supply zone.
15m Chart Analysis
1.
Swing Bullish
Internal Bullish / Sub Internal Bearish
Swing Continuation
2.
After a BOS we expect a PB. INT Structure turned Bearish to facilitate the Swing Pullback.
3.
With the tension in Middle East. Pulled back to the Swing extreme mitigating the last 15m Demand zone within the 4H Demand.
Expectation is set to the 15m Swing Low to hold and target the Weak Swing High to facilitate the 4H Pullback Phase.
EURUSD 18 Apr 2024 W16 - Intraday Analysis - US Jobless ClaimsThis is my Intraday analysis on EURUSD for 18 Apr 2024 W16 based on Smart Money Concept (SMC) which includes the following Time Frames:
4H
15m
4H Chart Analysis
1.
Swing Bearish
Internal Bearish
Swing Pullback Phase
2.
Swing continuing bearish following the HTF Bearish Trend. Expectations is set for the Swing to stay bearish to fulfill the HTF targets.
3.
After a BOS we expect a Pullback. Currently price within the Weekly Demand and approaching a 4H/Daily demand zone.
As expected the PB started after the Bullish CHoCH forming a new Demand Zone and confirming the Bearish INT Structure Low.
Expectations is set for continuing Bullish till a HP POI.
4.
4H Supply zone for possible reactions. But note that it's not well positioned within the 4H Swing (In Discount) so there is a probability that it will get run till the Swing EQ/Daily Supply zone.
15m Chart Analysis
1.
Swing Bullish
Internal Bullish
Swing Pullback Phase
2.
As expected, price created a Bullish BOS based on the 4H/Daily need for a Pullback.
After a BOS we expect a PB. As INT structure is Bullish, a Bearish iBOS will be the confirmation that the 15m Swing PB is starting. But be mindful that price in a Bullish momentum and a deep Swing PB is not often happen on the start of the move.
Following the Bullish Phase we are in, looking for longs is the best option till the mitigation of the close 4H Supply zone.
3.
Extreme Demand zone within the 15m Swing for possible Longs if reached.
But be mindful if we reached this Demand, PA is not looking in Bullish momentum and there will be a HP that the Swing low will be run.

EURUSD | APR 17 2024Still holding my shorts on EU patiently, as the general price action has not violated the underlying confluences. Keeping all posted
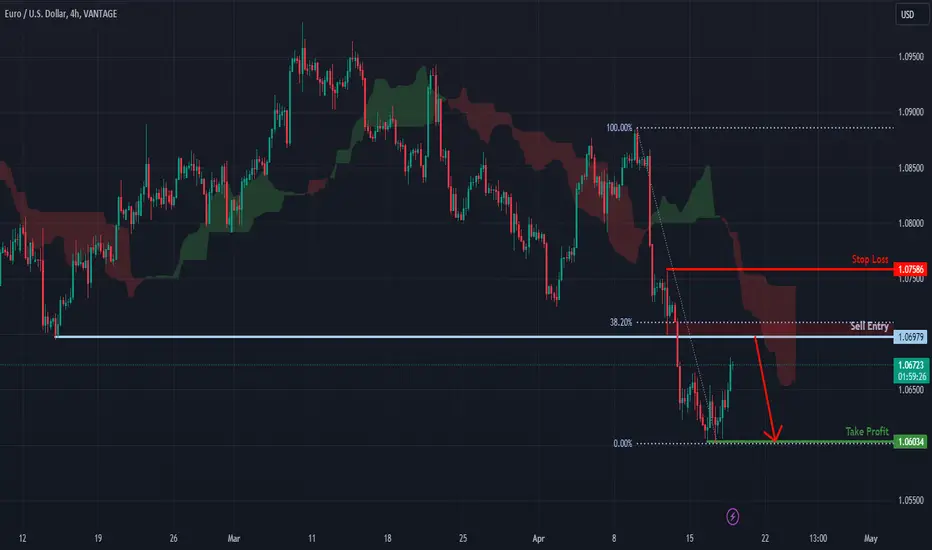
EUR/USD has a strong bearish momentum, could it fall further?Price is rising towards a resistance level, which serves as a pullback resistance aligning with the 38.2% Fibonacci retracement. A reversal from this level could cause the price to fall to our take profit target.
Entry: 1.06979
Why we like it:
There is a pullback resistance level which aligns with the 38.2% Fibonacci retracement
Stop loss: 1.07586
Why we like it:
There is a pullback resistance level
Take profit: 1.06034
Why we like it:
There is a pullback support level
Please be advised that the information presented on TradingView is provided to Vantage (‘Vantage Global Limited’, ‘we’) by a third-party provider (‘Everest Fortune Group’). Please be reminded that you are solely responsible for the trading decisions on your account. There is a very high degree of risk involved in trading. Any information and/or content is intended entirely for research, educational and informational purposes only and does not constitute investment or consultation advice or investment strategy. The information is not tailored to the investment needs of any specific person and therefore does not involve a consideration of any of the investment objectives, financial situation or needs of any viewer that may receive it. Kindly also note that past performance is not a reliable indicator of future results. Actual results may differ materially from those anticipated in forward-looking or past performance statements. We assume no liability as to the accuracy or completeness of any of the information and/or content provided herein and the Company cannot be held responsible for any omission, mistake nor for any loss or damage including without limitation to any loss of profit which may arise from reliance on any information supplied by Everest Fortune Group.
EURUSD 17 Apr 2024 W16 - Intraday Analysis - EU CPIThis is my Intraday analysis on EURUSD for 17 Apr 2024 W16 based on Smart Money Concept (SMC) which includes the following Time Frames:
4H
15m
4H Chart Analysis
1.
Swing Bearish
Internal Bearish
Pullback Phase
2.
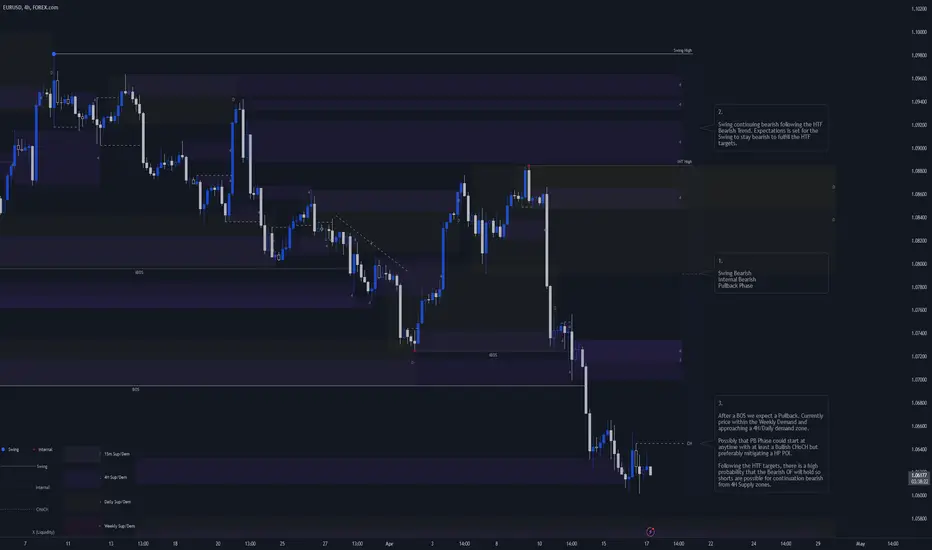
Swing continuing bearish following the HTF Bearish Trend. Expectations is set for the Swing to stay bearish to fulfill the HTF targets.
3.
After a BOS we expect a Pullback. Currently price within the Weekly Demand and approaching a 4H/Daily demand zone.
Possibly that PB Phase could start at anytime with at least a Bullish CHoCH but preferably mitigating a HP POI.
Following the HTF targets, there is a high probability that the Bearish OF will hold so shorts are possible for continuation bearish from 4H Supply zones.
15m Chart Analysis
1.
Swing Bearish
Internal Bullish
Swing Pullback Phase
2.
After BOS we expected a pullback. INT Structure turned Bullish to initiate the 15m Swing Pullback.
3.
As price reached the 15m Swing Premium and mitigated the 1H/15m Supply, Price initiated the Swing Bearish continuation and INT Structure Pullback.
Price reached the Swing Low and failed to break. So current PA is ranging.
I'll wait for Bullish BOS to confirm that the 4H Swing PB started instead of following the Shorts which could end at anytime.
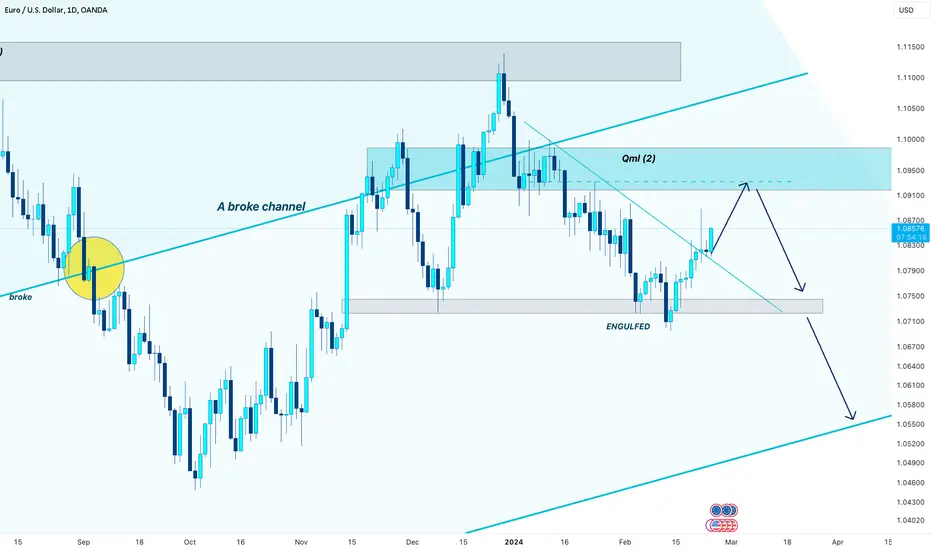
eurusd 📉 signal 📈hello guys...
as I said before:
from my point of view, this pair is bearish!
why?! you can see the ascending channel broke! the price formed a QM pattern twice!
the first QML(1) was touched and if the blue trenline breaks up the QML(2) will be touched too!
so I believe this coin wanna touch the QML area and then start the downward movement due to engulfing the last lower low!
___________________________
💻📞☎️ always do your research.
💌📫📃 If you have any questions, you can write them in the comments below, and I will answer them.
📊📌❤️And please don't forget to support this idea with your likes and comment
EURUSD 16 Apr 2024 W16 - Intraday Analysis - EU ZEW / US PowellThis is my Intraday analysis on EURUSD for 16 Apr 2024 W16 based on Smart Money Concept (SMC) which includes the following Time Frames:
4H
15m
4H Chart Analysis
1.
Swing Bearish
Internal Bearish
Pullback Phase
2.
Swing continuing bearish following the HTF Bearish Trend. Expectations is set for the Swing to stay bearish to fulfill the HTF targets.
3.
After a BOS we expect a Pullback. Currently price within the Weekly Demand and approaching a 4H/Daily demand zone.
Possibly that PB Phase could start at anytime with at least a Bullish CHoCH but preferably mitigating a HP POI.
Following the HTF targets, there is a high probability that the Bearish OF will hold so shorts are possible for continuation bearish from 4H Supply zones.
15m Chart Analysis
1.
Swing Bearish
Internal Bearish
Pullback Phase
2.
After BOS we expect a pullback. Bullish iBOS will be the first sign that Swing Pullback maybe starting.
But as we didn't mitigate any HTF POI any PB could be limited.
Also the 4H Swing requires a Pullback so there is a HP that the 15m will be run at least as a 4H CHoCH.
EURUSD | APR 15 2024Entered the shorts here as per the explanation yesterday. Shooting for 4 RR on it, but lets see what the price action decides to develop into. Will be moving my SL alongisde the LL & LH formation, nothing crazy
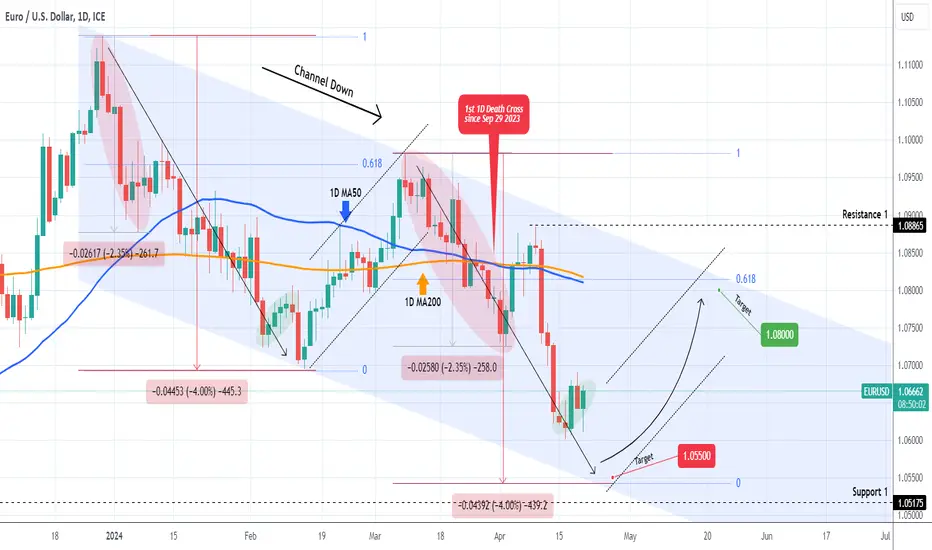
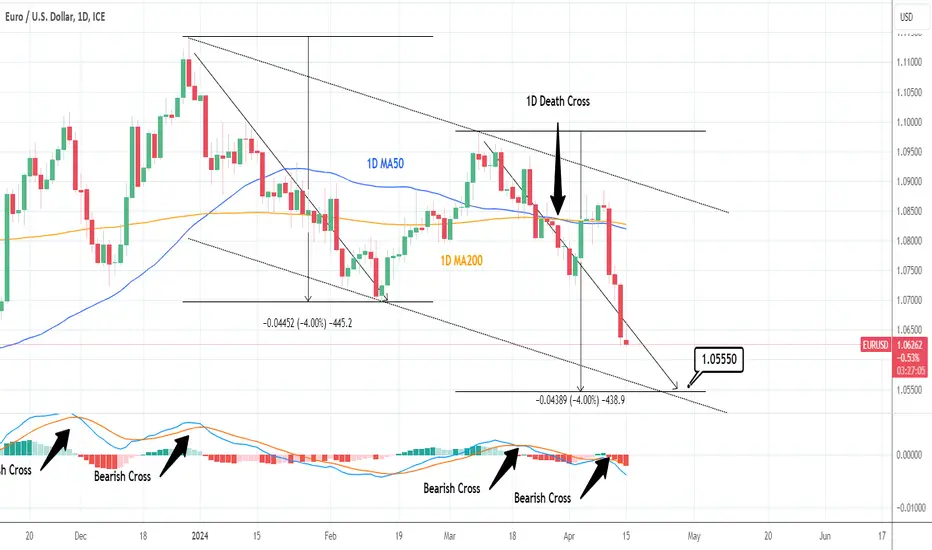
EURUSD: Oversold on 1D but still bearish long-term.EURUSD turned oversold today on its 1D technical outlook (RSI = 29.517, MACD = -0.004, ADX = 31.573) as it failed to sustain the rebound during the early session. The long term pattern is a Channel Down since the start of the year and this is the second bearish wave for a LL. The 1D MACD is on the second Bearish Cross inside 30 days and even though a short term rebound might be possible, we expect a test of the Channel Down's bottom by the end of the month (TP = 1.05550). That would be on a perfect -4.00% symmetry with the decline of the previous bearish wave.
See how our prior idea has worked out:
## If you like our free content follow our profile to get more daily ideas. ##
## Comments and likes are greatly appreciated. ##
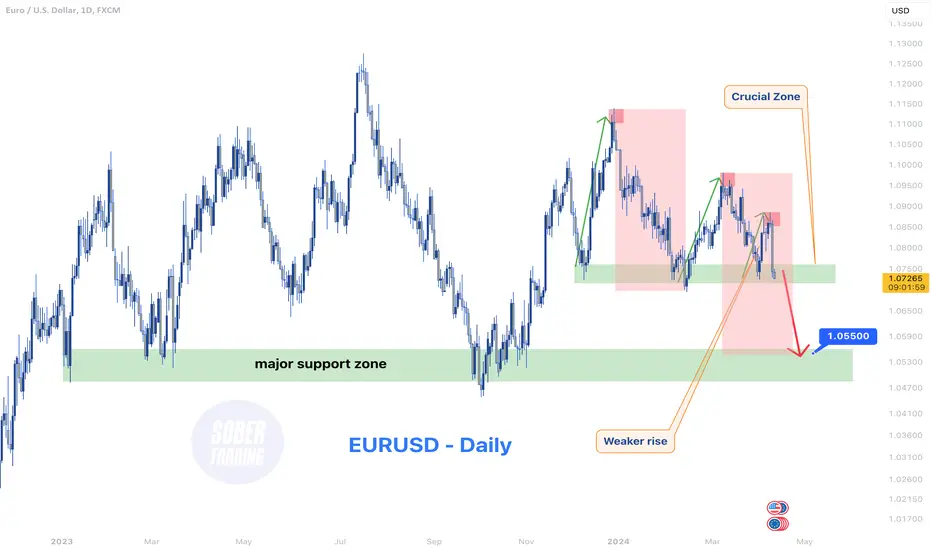
EURUSD - Daily fallThe EURUSD pair has been consistently making lower highs, indicating a loss of bullish momentum.
This pattern suggests the potential for a breakdown below the current support, eyeing a move towards the major support zone.
Traders should watch these levels closely for signs of continued bearish movement.
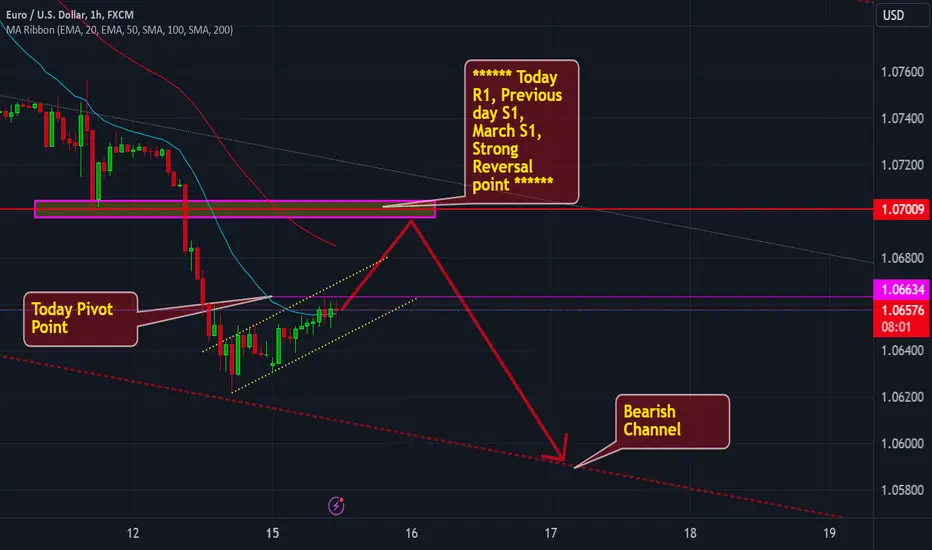
EURUSD: Overall view
Greetings Traders,
Key Levels Around 1.0700: Today's R1, Previous Day's S1, March S1, and a strong reversal point all converge around 1.0700, indicating significant levels to monitor.
Yellow Bullish Channel: It's imperative to watch for any breaks below the yellow bullish channel, as this could invalidate our current analysis.
Take Profit Targets: TPs are set at the bottom of the channel and today's pivot around 1.0665.
Upcoming Events: Keep an eye out for surprises in today's retail sales announcement and tomorrow's Federal Reserve Chair Jerome Powell speech, as these could potentially alter market direction or affect optimal entry levels.
Short-Term Trading Strategy: Short-term traders may consider taking long trades if the price surpasses 1.0670.
Best regards,
EURUSD 15 Apr 2024 W16 - Intraday Analysis - US Retail SalesThis is my Intraday analysis on EURUSD for 15 Apr 2024 W16 based on Smart Money Concept (SMC) which includes the following Time Frames:
4H
15m
4H Chart Analysis
1.
Swing Bearish
Internal Bearish
Pullback Phase
2.
Swing continuing bearish following the HTF Bearish Trend. Expectations is set for the Swing to stay bearish to fulfill the HTF targets.
3.
After a BOS we expect a Pullback. Currently price within the Weekly Demand and at a 4H Demand Zone.
Possibly that PB Phase could start from here and the first weak confirmation would be a Bullish CHoCH.
Following the HTF targets, there is a high probability that the Bearish OF will hold so shorts are possible for continuation bearish from 4H Supply zones.
15m Chart Analysis
1.
Swing Bearish
Internal Bullish - Pullback Phase
2.
After the Bearish iBOS, price continued bearish till the 4H Demand.
With the mitigation of the 4H Demand we formed a Bullish iBOS which confirmed the Swing Low and the initiation of the 15m Swing Pullback Phase.
Expectations is set for price to continue bullish to facilitate the PB till a HP 4H Supply Zone.
3.
4H Supply zone for possible Shorts.
Be mindful that the 4H supply is having Liq above it so there is a HP that this supply will fail to sweep the Liq above.
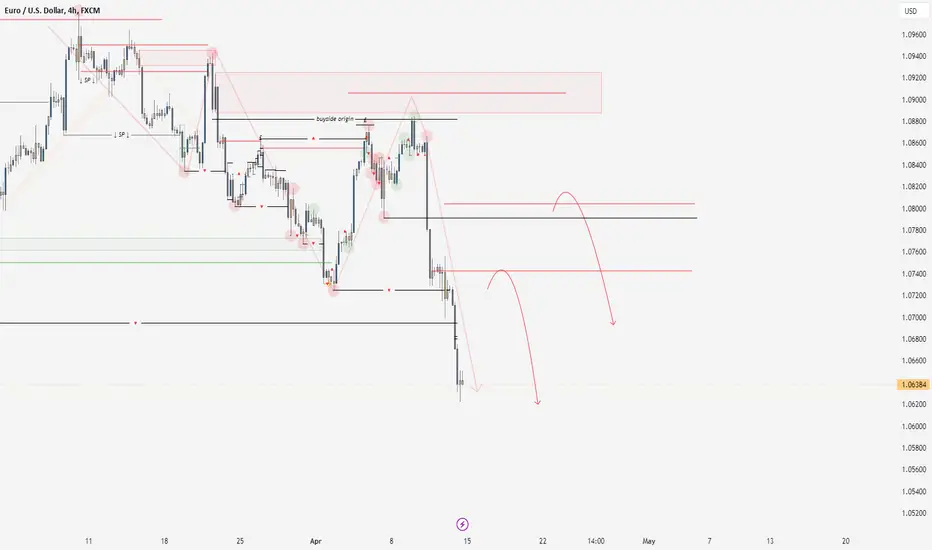
EURUSD 14/4/24EU here with another pretty clean cut move! As we called from the start of this year we are seeing that new daily low placed into the market here with a clear direction as to what we want to see follow this, iam now looking for a low to confirm, this will require price pulling back to produce a low structure point this will then allow the market to make another deeper push for a new bearish structure to form, the points i am watching for this are the OB that caused the BOS of the major low, this is the first red line shown on our chart (50%) and then we have our higher zone which is a daily order block that we responsible for the structure shift and lower prices in the first place! bearish is the trend and bearish is the bias!
Follow what price is showing you and dont count on a pullback!
trade safe and trade your plan!
EURUSD 15-19 Apr 2024 W16 Weekly Analysis - Middle East Tension!This is my Weekly analysis on EURUSD for 5-19 Apr 2024 W16 based on Smart Money Concept (SMC) which includes the following Time Frames:
Weekly
Daily
4H
Economic Events
Weekly Chart Analysis
1.
Swing Bearish
Internal Bearish
Reached Swing EQ
Swing Continuation (Pro Swing + Pro Internal)
2.
After the Bearish iBOS we confirmed that the Swing Pullback is over and we will target the Weak Swing Low.
3.
Price had reached the Bearish INT Structure extreme and initiated the Bearish Internal Structure Continuation.
Expectation is to continue bearish and target he Weak INT Low.
Daily Chart Analysis
1.
Swing Bearish
INT Bearish
Swing Continuation (Pro Swing + Pro Internal)
2.
Internal Structure continuing bearish following the Bearish Swing.
3.
After the Bearish iBOS we expect a pullback.
Currently price is within the Weekly Demand and swept Liq from the left.
Price could initiate a PB at anytime or after reaching the Daily Extreme Demand.
More price development required.
4.
Daily and Weekly demand zones for reactions to fulfill a Pullback Phase.
4H Chart Analysis
1.
Swing Bearish
Internal Bearish
Pullback Phase
2.
Swing continuing bearish following the HTF Bearish Trend. Expectations is set for the Swing to stay bearish to fulfill the HTF targets.
3.
After a BOS we expect a Pullback. Currently price within the Weekly Demand and at a 4H Demand Zone.
Possibly that PB Phase could start from here and the first weak confirmation would be a Bullish CHoCH.
Following the HTF targets, there is a high probability that the Bearish OF will hold so shorts are possible for continuation bearish from 4H Supply zones.
Economic Events for the Week

EURUSD: Fed Grapples with Surging CPI and NFP FiguresDear Traders,
As we gear up for the week ahead, our attention zeroes in on EURUSD, where we anticipate a selling opportunity to manifest around the 1.06600 zone. EURUSD continues its downward trajectory, presently navigating a correction phase as it approaches the pivotal support and resistance area at 1.06600.
Delving into the fundamental underpinnings, recent economic indicators paint a picture of USD strength. The latest Non-Farm Payrolls (NFP) data revealed robust job creation, with March recording an impressive increase of 303k jobs compared to the previous month's 212k, surpassing market expectations. This surge in employment underscores the resilience of the US economy.
Furthermore, examining the Consumer Price Index (CPI) trend reveals a consistent uptick in inflationary pressures. Over recent months, CPI data has shown a steady climb:
Mar 12, 2024: 3.5%
Feb 13, 2024: 3.2%
Jan 11, 2024: 3.0%
Dec 12, 2023: 2.8%
Nov 14, 2023: 2.5%
This sustained inflationary trend has heightened concerns and could prompt a more hawkish stance from the Federal Reserve as policymakers aim to curb inflation risks by tightening monetary policy.
Considering these developments, the Federal Reserve might pivot towards a more hawkish stance in response to the buoyant US economy and escalating inflation. Such a stance could further bolster the US dollar, exerting downward pressure on EURUSD.
Therefore, as we monitor EURUSD for a potential selling opportunity around 1.06600, it's imperative to remain vigilant of the numerical metrics and their implications on market sentiment and direction.
Wishing you prudent and prosperous trading,
Joe
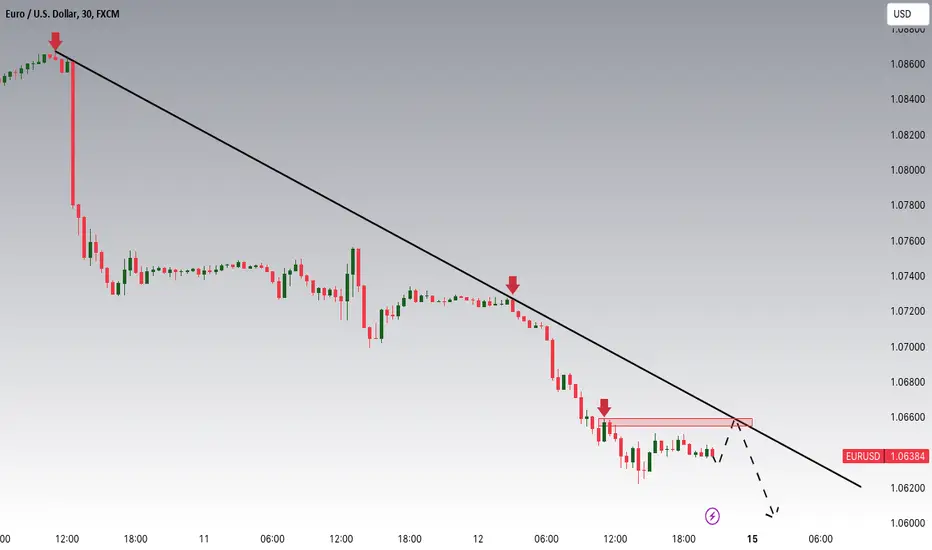
EURUSD 12 Apr 2024 W15 - Intraday Analysis This is my Intraday analysis on EURUSD for 12 Apr 2024 W15 based on Smart Money Concept (SMC) which includes the following Time Frames:
4H
15m
4H Chart Analysis
1.
Swing Bearish / Continuation
INT Bearish
2.
Expectations are met for the INT Structure with the Bearish iBOS.
Currently price targeting the Weak Swing Low.
3.
Price tapped the 4H Demand but as we are in Pro Swing/INT the reaction from this demand will be limited.
Price now in a bearish momentum targeting the Weak Swing Low.
15m Chart Analysis
1.
Swing Bearish
2.
Considered this as Swing due to the Bullish iBOS.
With the Swing bearish, expectations is set for bearish continuation.
This 15m Supply is the only clear supply for Shorts.
3.
Following the 4H Swing, expectation is set to continue bearish and the 15m Swing will hold bearish to fulfill the 4H Swing targets.
EURUSD is looking for better selling zoensHey Traders, in the coming week we are monitoring EURUSD for a selling opportunity around 1.08800 zone, EURUSD is trading in a downtrend and currently is in a correction phase in which it is approaching the trend at 1.08800 support and resistance area.
Trade safe, Joe.
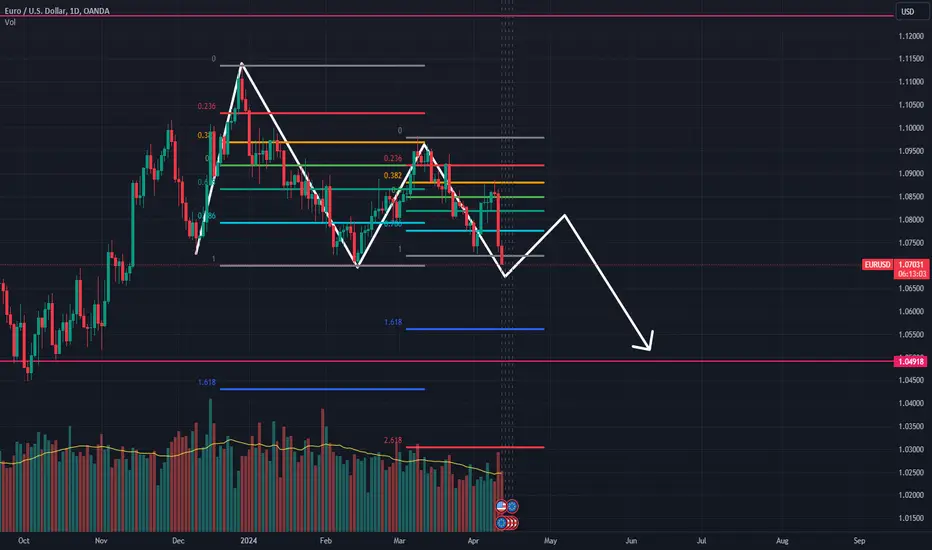
Where EURUSD is heading in the upcoming week?After the cpi report yesterday the price has broken its somewhat pretty respectable support according to me and now it seems to be heading towards its daily support near 1.0675.
As I have marked the downtrend I think price might even go further down the weekly support but you never know what can happen in forex market so I will take my profits near weekly support areas and wait for a reversal or if the price continues to go further down then I will open a new trade.
HOW AM I SURE THAT IT IS A DOWN TREND?
I am sure becuase as you can see both of the times price bounced back from the golden level of FIB and when it first happend it made a lower low and now the second time when it bounced back from the golden fib level it has already made a new lower low.
EURUSD - Bearish => Bullish 🎯Hello TradingView Family / Fellow Traders. This is Richard, also known as theSignalyst.
📉 As per my last analysis , attached on the chart, EURUSD rejected the upper red circle zone and traded lower.
Currently, EURUSD is approaching the lower bound of the red wedge pattern.
Moreover, the $1.07 is a strong support.
🏹 Thus, the highlighted red circle with the blue arrow is a strong area to look for buy setups as it is the intersection of the blue support and lower red trendline.
📚 As per my trading style:
As #EURUSD approaches the blue circle zone, I will be looking for bullish reversal setups (like a double bottom pattern, trendline break , and so on...)
📚 Always follow your trading plan regarding entry, risk management, and trade management.
Good luck!
All Strategies Are Good; If Managed Properly!
~Rich

EURUSD 11 Apr 2024 W15 - Intraday Analysis - EU Rate / US PPIThis is my Intraday analysis on EURUSD for 11 Apr 2024 W15 based on Smart Money Concept (SMC) which includes the following Time Frames:
4H
15m
4H Chart Analysis
1.
Swing Bearish / Continuation
INT Bearish
2.
As price formed a Bearish CHoCH before the CPI news, it was a nice signal for INT Structure to continue bearish.
Expectations is set to target the Weak INT / Swing Lows.
3.
Price tapped the 4H Demand but as we are in Pro Swing/INT the reaction from this demand will be limited.
15m Chart Analysis
1.
Swing Bearish
Swing Pullback Phase
2.
CPI news had a solid push causing a bearish BOS.
No HP POI except the 4H Supply with a 15m nested within it.
IMO i've doubts that price will pullback to this supply.
Expectations is set to continue bearish to fulfill the 4H INT/Swing continuation phase.
3.
After a BOS, we expect a pullback.
Price is currently within the 4H Demand but no momentum.
CHoCH will be the first sign that Swing Pullback maybe starting but be mindful that we are not well positioned within the HTF structure.
Following the bearish move would be the optimum decision.