EURUSD 4-8 Mar 2024 W10 Weekly Analysis - EU Rate / US NFP WeekThis is my Weekly analysis on EURUSD for 4-8 Mar 2024 W10 based on Smart Money Concept (SMC) which includes the following Time Frames:
Weekly
Daily
4H
Economic Events
Weekly Chart Analysis
1.
Swing Bearish
Internal Bearish
Reached Swing EQ
(Pro Swing + Pro Internal)
2.
After the Bearish iBOS we expected pullback, price tapped into Liq on the lift and a Weekly demand zone which provided a pullback and formed a bullish CHoCH confirming INT Low.
Price reached the INT Extreme and tapped the Weekly Supply Zone and as expected we are targeting at least the CHoCH and then the Weak INT Low.
Price did the Bearish ChoCH and formed a fresh Supply zone which will be potential for shorts once reached to continue the Bearish INT structure and Swing too.
3.
With the Bearish INT Structure we have the confirmation that the Swing Pullback is over and we are currently in the Swing Continuation Phase.
Price had reached the Bearish INT Structure extreme and showed reaction from which resulted in a Bearish CHoCH.
Expectation now set to see price continuing bearish.
Daily Chart Analysis
1.
Swing Bearish
INT Bearish
Swing Continuation / INT Pullback
2.
Within the Daily Bearish Swing we reached the Swing extreme area and mitigated a Weekly Supply zone and formed a bearish iBOS confirming the Swing Pullback is over and we are Pro Bearish Swing and starting the Continuation Phase targeting the Weak Swing Low.
3.
After the Bearish iBOS we expected a Pullback.
After mitigating the Daily Demand zone we formed a Bullish CHoCH which confirmed the INT Structure Pullback Phase started.
Expectations is set now for the INT Structure Pullback Phase to continue to the INT EQ up to the Daily/Weekly Supply. But be mindful that the Swing Bearish continuation can continue at any time.
There is no HP POI for Shorts up to the Daily/Weekly Supply Zones.
IMO Price could continue up to sweep LIQ from the INT Momentum Phase that leaded to the iBOS before we continue down.
4.
Daily and Weekly demand zones for reactions once reached.
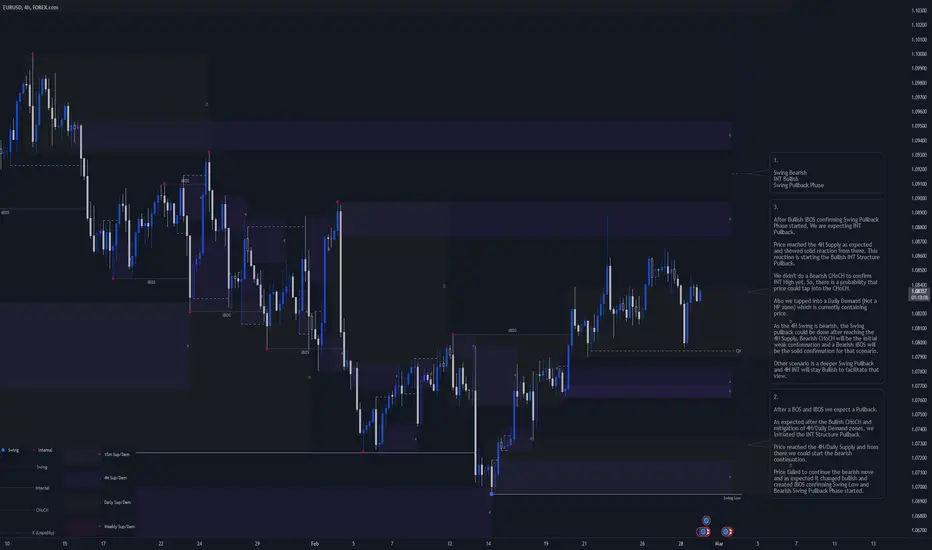
4H Chart Analysis
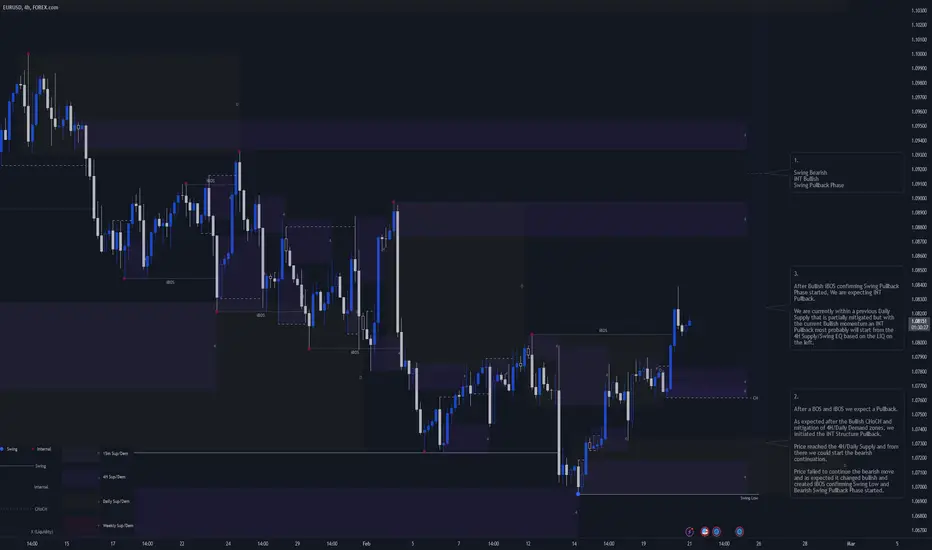
1.
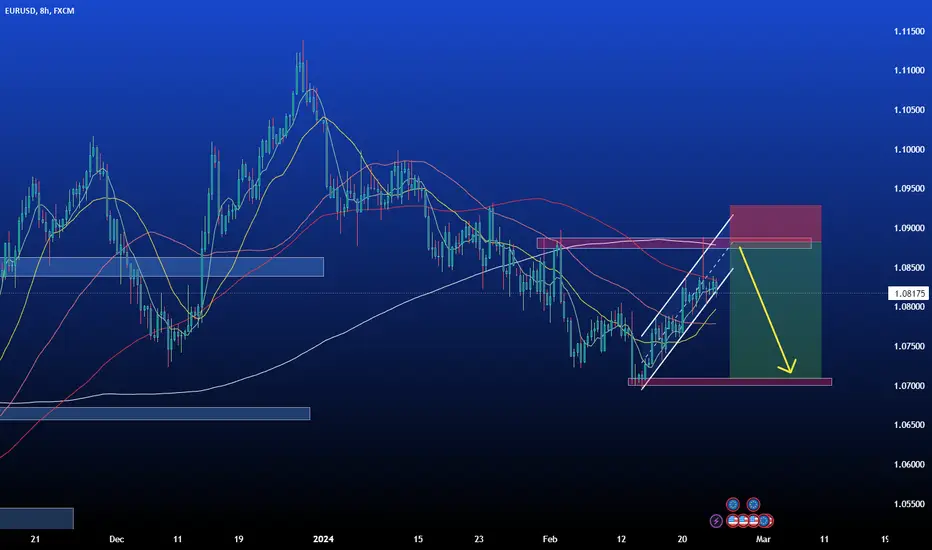
Swing Bearish
INT Bullish
Swing Pullback Phase
2.
After a BOS and iBOS we expect a Pullback.
As expected after the Bullish CHoCH and mitigation of 4H/Daily Demand zones, we initiated the INT Structure Pullback.
Price reached the 4H/Daily Supply and from there we could start the bearish continuation.
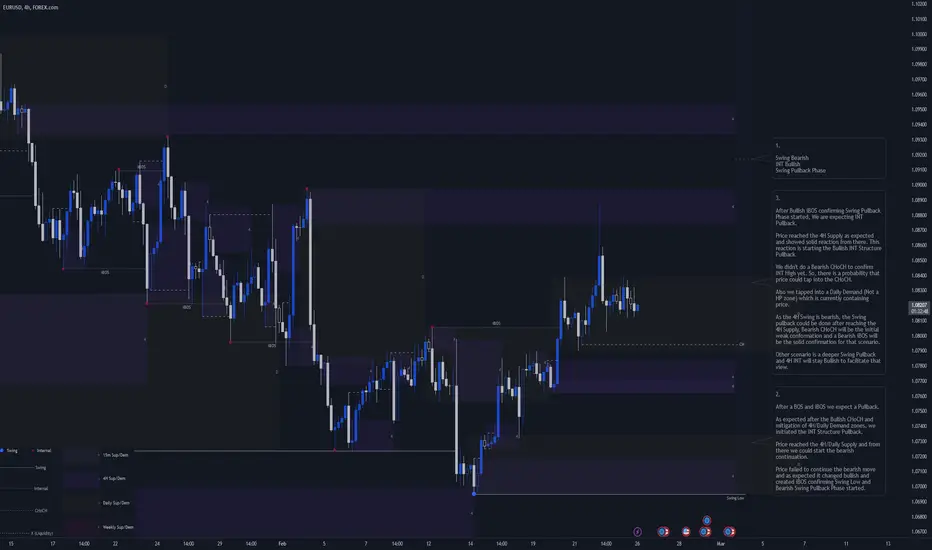
Price failed to continue the bearish move and as expected it changed bullish and created iBOS confirming Swing Low and Bearish Swing Pullback Phase started.
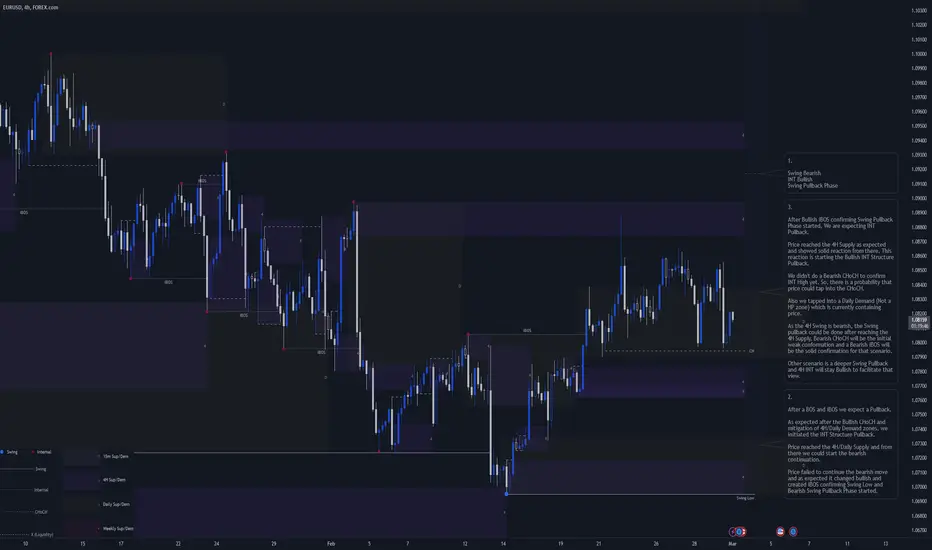
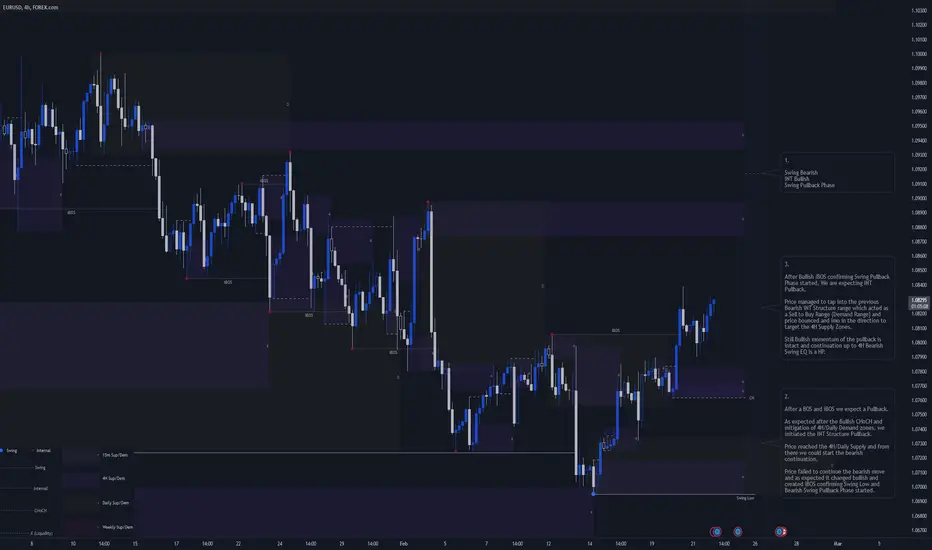
3.
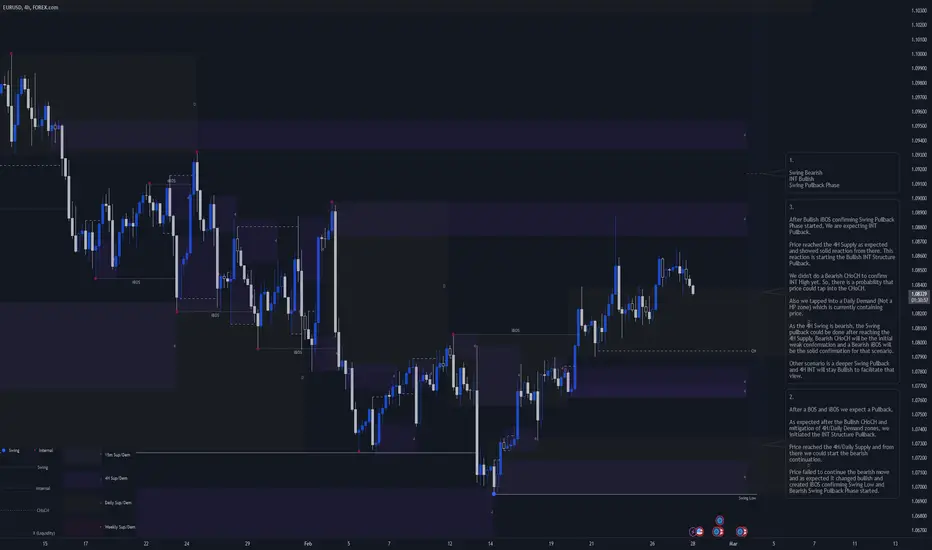
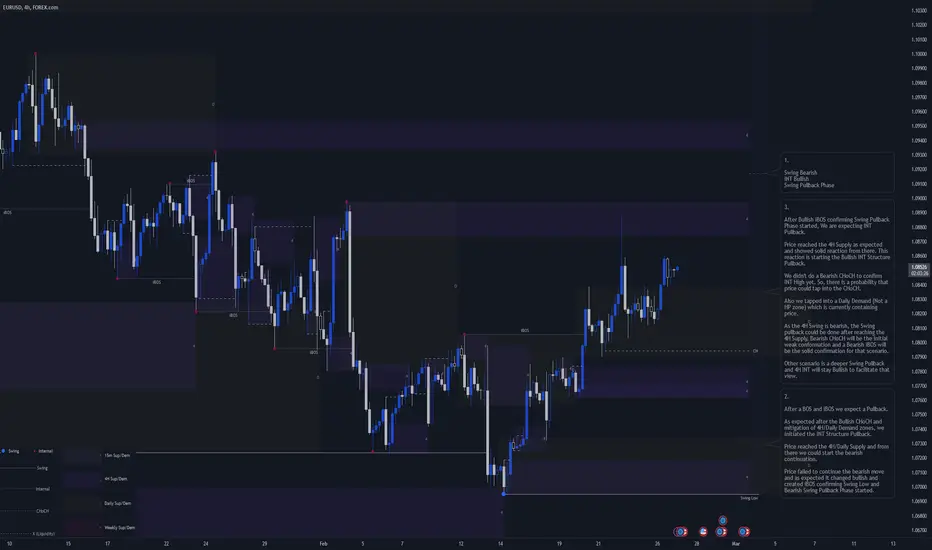
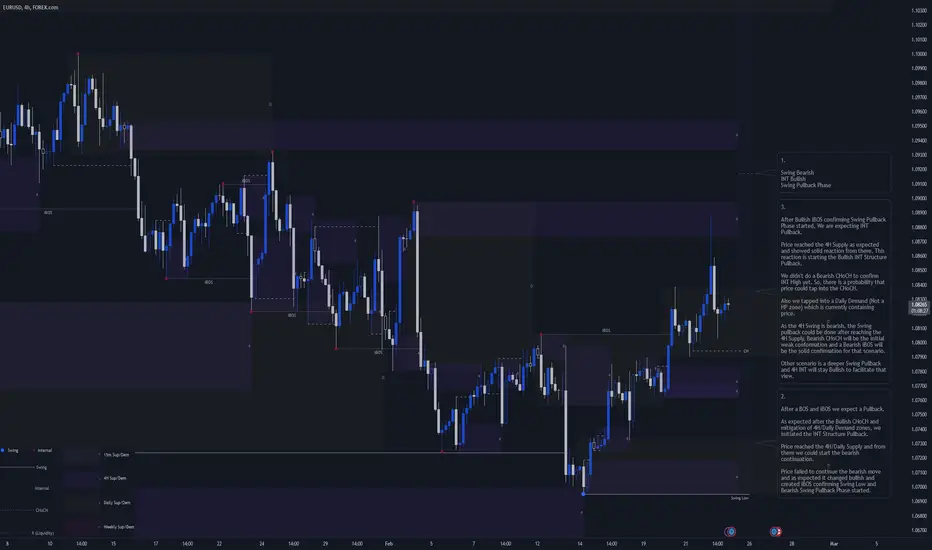
After Bullish iBOS confirming Swing Pullback Phase started, We are expecting INT Pullback.
Price reached the 4H Supply as expected and showed solid reaction from there. This reaction is starting the Bullish INT Structure Pullback.
We didn't do a Bearish CHoCH to confirm INT High yet. So, there is a probability that price could tap into the CHoCH.
Also we tapped into a Daily Demand (Not a HP zone) which is currently containing price.
As the 4H Swing is bearish, the Swing pullback could be over after reaching the 4H Supply, Bearish CHoCH will be the initial weak conformation and a Bearish iBOS will be the solid confirmation for that scenario.
Other scenario is a deeper Swing Pullback and 4H INT will stay Bullish to facilitate that view.
Economic Events for the Week
Eur-usd
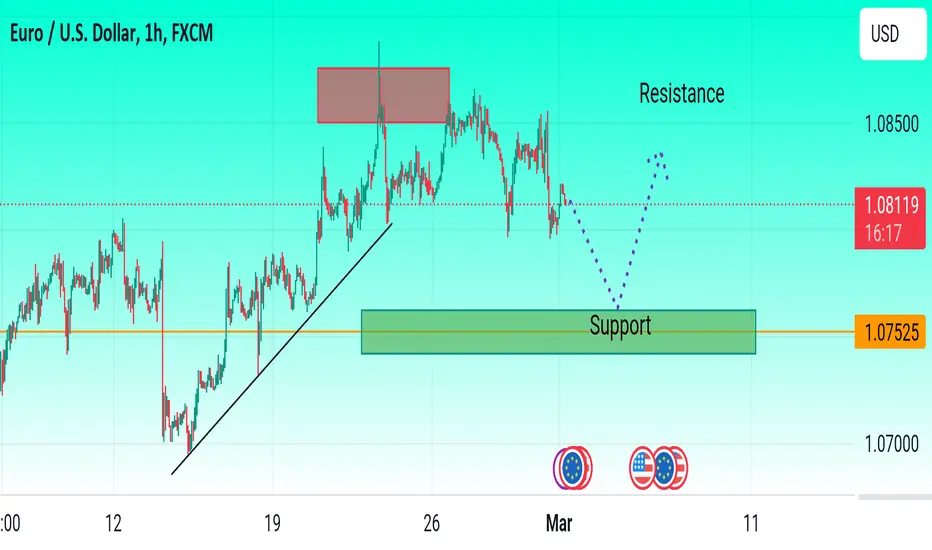
EUR USD support zone EUR/USD holds positive ground near 1.0811 during the early European session on Friday. The major pair recovers despite the renewed US Dollar demand. Market players will take more cues from the Eurozone inflation data due later in the day.
Wage data is pretty high up on the ECB’s list of concerns with its members opting to view Q1 wage data before indicating when exactly it may be appropriate to cut rates. Then later today EUR/USD is likely to see an uptick in intra-day volatility when US PCE data comes out 30 minutes after the inflation print.
Confirm Chart
EURUSD 1 Mar 2024 W9 - Intraday Analysis - EU PMI/CPI - US PMIThis is my Intraday analysis on EURUSD for 1 Mar 2024 W9 based on Smart Money Concept (SMC) which includes the following Time Frames:
4H
15m
NOTE: Nothing changed again from yesterday, 4H no changes and 15m just within the INT to INT Structure.
4H Chart Analysis
1.
Swing Bearish
INT Bullish
Swing Pullback Phase
2.
After a BOS and iBOS we expect a Pullback.
As expected after the Bullish CHoCH and mitigation of 4H/Daily Demand zones, we initiated the INT Structure Pullback.
Price reached the 4H/Daily Supply and from there we could start the bearish continuation.
Price failed to continue the bearish move and as expected it changed bullish and created iBOS confirming Swing Low and Bearish Swing Pullback Phase started.
3.
After Bullish iBOS confirming Swing Pullback Phase started, We are expecting INT Pullback.
Price reached the 4H Supply as expected and showed solid reaction from there. This reaction is starting the Bullish INT Structure Pullback.
We didn't do a Bearish CHoCH to confirm INT High yet. So, there is a probability that price could tap into the CHoCH.
Also we tapped into a Daily Demand (Not a HP zone) which is currently containing price.
As the 4H Swing is bearish, the Swing pullback could be done after reaching the 4H Supply, Bearish CHoCH will be the initial weak conformation and a Bearish iBOS will be the solid confirmation for that scenario.
Other scenario is a deeper Swing Pullback and 4H INT will stay Bullish to facilitate that view.
15m Chart Analysis
1.
Swing Bullish
INT Bullish
INT INT Bearish
INT Continuation Phase
2.
Swing turned bullish to facilitate the 4H Swing Pullback.
After BOS we expect a pullback. Price reached the 4H Supply as expected and from there started the 15m INT Structure Pullback.
With the ranging behavior of price we created INT to INT Structure which turned bearish and currently challenging to maybe targeting the INT Structure Pullback low (ii Low @ 1.0803).
Price is currently bearish within the Bullish INT/Swing structure. Expectations was set to target the INT to INT Structure and we did that yesterday.
With the current price behavior, i'm expecting price to challenge the INT Structure Low which will confirm 15m Swing High and possible continuation bearish to continue the 4H Bearish INT Structure.
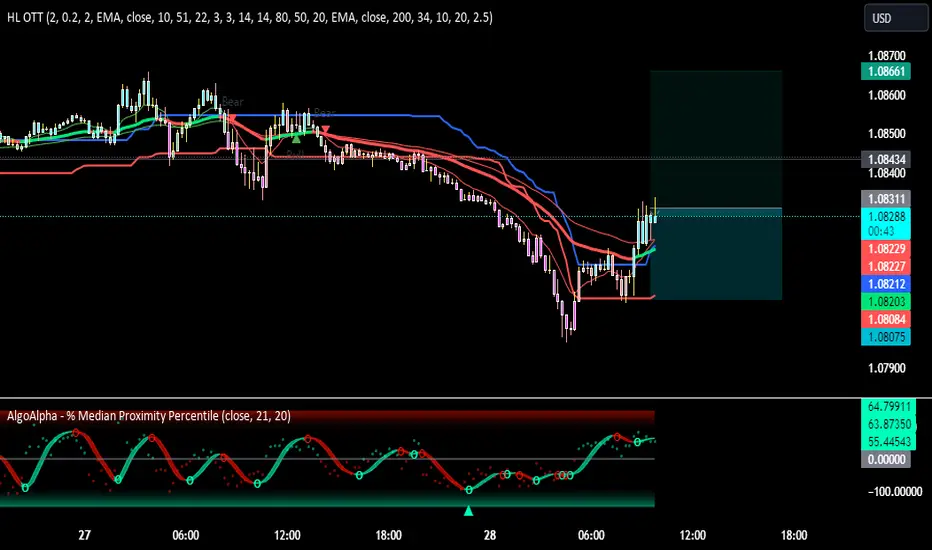
Eurusd buyIndicator will print bull signal if close above 1.08300 on the 15m
it would be cosidered a high probability trade
1.ema cross
2.bullish on rsi
3. above hll
4.above blue line
5. ema retest
?6. bullish signal print?
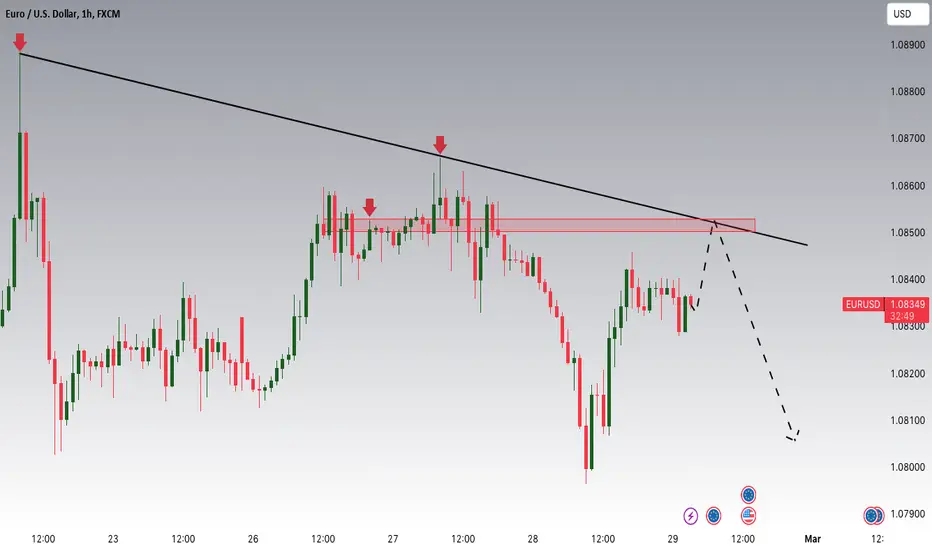
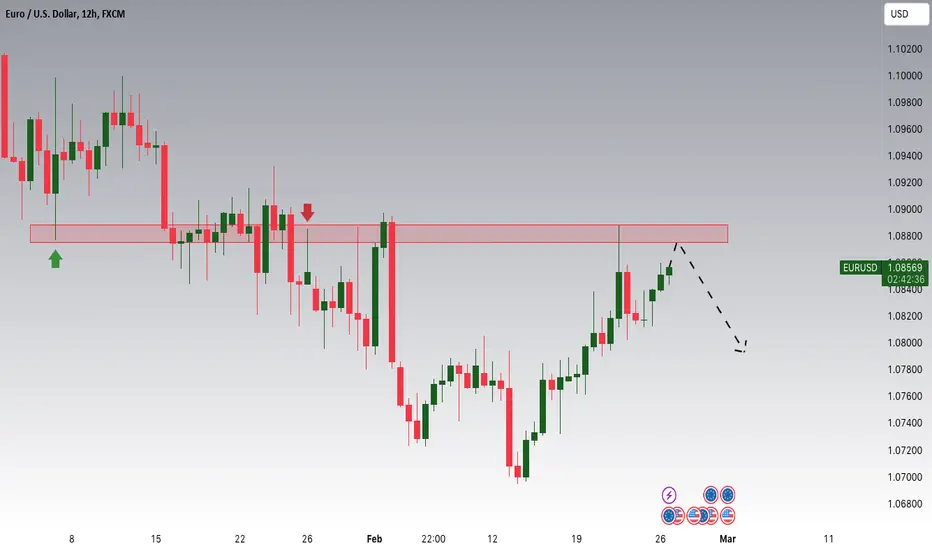
EURUSD is approaching a significant Resistance areaHey Traders, in today's trading session we are monitoring EURUSD for a selling opportunity around 1.08500 zone, EURUSD is trading in a downtrend and currently is in a correction phase in which it is approaching the trend at 1.08500 support and resistance area.
One other factor that i will be keeping an eye too is PCE that should give an extra boost and give confirmation on the dollars long!
Trade safe, Joe.
EURUSD - Trade Idea (ICT)Intraday trade idea on the EURUSD.
I see a reaction off a signature 2-day R2F Gap to give me a bullish bias to take price possibly to the highs.
For narrative, I see a signature 30m R2F Gap as a possible entry to take me up to the relative equal highs where my "low hanging fruit" objective lies. I have added confidence for the 2nd objective due to the trendline buyside liquidity on GBPUSD. However, this bias/narrative is still not ironclad as there have been a lot of N(D/W)OGs on the chart, at least for the FXCM data which I usually use.
Trade with caution.
- R2F

EURUSD 29 Feb 2024 W9 - Intraday Analysis - US PCE/JoblessThis is my Intraday analysis on EURUSD for 29 Feb 2024 W9 based on Smart Money Concept (SMC) which includes the following Time Frames:
4H
15m
NOTE: Nothing changed again from yesterday, 4H no changes and 15m just created INT to INT Structure.
4H Chart Analysis
1.
Swing Bearish
INT Bullish
Swing Pullback Phase
2.
After a BOS and iBOS we expect a Pullback.
As expected after the Bullish CHoCH and mitigation of 4H/Daily Demand zones, we initiated the INT Structure Pullback.
Price reached the 4H/Daily Supply and from there we could start the bearish continuation.
Price failed to continue the bearish move and as expected it changed bullish and created iBOS confirming Swing Low and Bearish Swing Pullback Phase started.
3.
After Bullish iBOS confirming Swing Pullback Phase started, We are expecting INT Pullback.
Price reached the 4H Supply as expected and showed solid reaction from there. This reaction is starting the Bullish INT Structure Pullback.
We didn't do a Bearish CHoCH to confirm INT High yet. So, there is a probability that price could tap into the CHoCH.
Also we tapped into a Daily Demand (Not a HP zone) which is currently containing price.
As the 4H Swing is bearish, the Swing pullback could be done after reaching the 4H Supply, Bearish CHoCH will be the initial weak conformation and a Bearish iBOS will be the solid confirmation for that scenario.
Other scenario is a deeper Swing Pullback and 4H INT will stay Bullish to facilitate that view.
15m Chart Analysis
1.
Swing Bullish
INT Bullish
INT INT Bearish
INT Continuation Phase
2.
Swing turned bullish to facilitate the 4H Swing Pullback.
After BOS we expect a pullback. Price reached the 4H Supply as expected and from there started the 15m INT Structure Pullback.
With the ranging behavior of price we created INT to INT Structure which turned bearish and currently challenging to maybe targeting the INT Structure Pullback low (ii Low @ 1.0803).
Price is currently bearish within the Bullish INT/Swing structure. Expectations that the INT to INT Structure will continue bearish and target the INT to INT Low.
But be mindful that there is a HP that price can create a bullish iiBOS to continue the Bullish INT Structure.
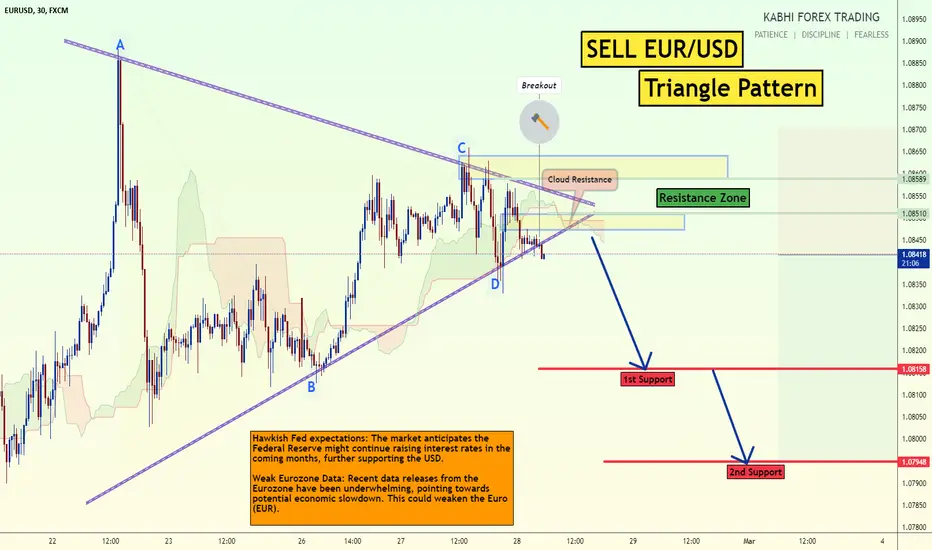
Sell EURUSD Triangle BreakoutThe EUR/USD pair on the M30 timeframe presents a potential selling opportunity due to a recent downward breakout from a triangle pattern.
Sell Entry: Consider entering a short position around the current price of 1.0842, positioned close to the breakout level. This offers an entry point near the perceived shift in momentum.
Target Levels: Initial bearish targets lie at the following levels: 1.0815 and 1.0795.
These targets act as potential support zones that could see selling pressure.
Stop-Loss: To manage risk, place a stop-loss order above the broken resistance line of the triangle, ideally around 1.0870. This helps limit potential losses if the price reverses and breaks back upwards.
Thank you.
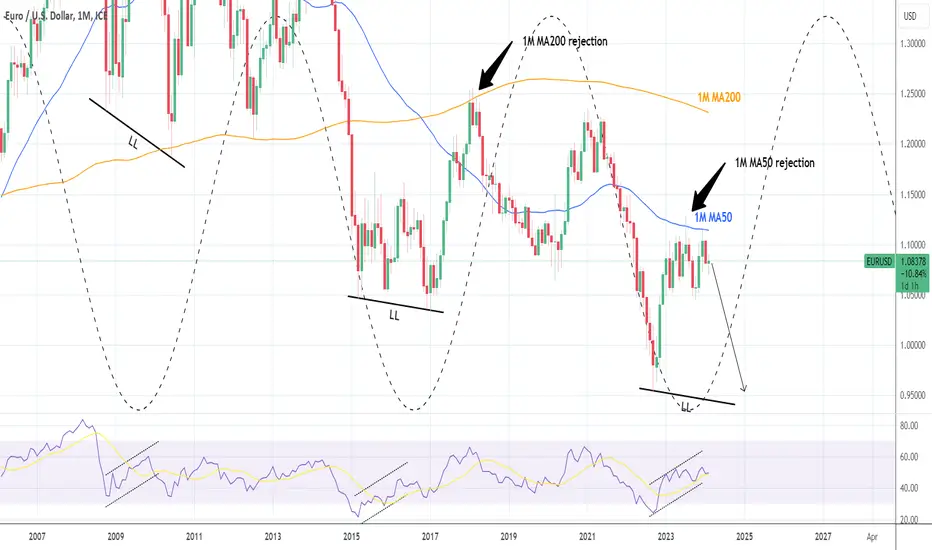
EURUSD: Is parity a realistic scenario?EURUSD is technically neutral both on the 1W and 1M timeframes (RSI = 50.883 and 49.520 respectively), which indicates a lack of trend currently. This is justified technically as the late 2022 - early 2023 rally stopped on an emphatic July 2023 rejection on the 1M MA50. December 2023 gave a second rejection on the trendline, which makes for a technical Double Top. As the 1M RSI is about to cross under its MA trendline whilst on a Channel Up, it resembles December 2009 and October 2016.
This is a cyclical behavior, accurately displayed by the wave tool and indicates that as long as the price gets rejected on the 1M MA50, the downside is significant in size aiming not just for a parity again but for a new LL below 0.9500. A 1M candle close over the 1M MA50 negates this pattern and starts a new one, bullish breakout aimed at the 1M MA200 (last rejection there in March 2018).
See how our prior idea has worked out:
## If you like our free content follow our profile to get more daily ideas. ##
## Comments and likes are greatly appreciated. ##
EURUSD: Looking to resume downtrendThis current bullish move looks to be running its course, resembling a bull flag.
Will be waiting for a confirmation on LTF's to get in short, hopefully before the big news on Friday, which I expect to confirm interest rates staying as they are for longer, and a hawkish fed.
EURUSD 28 Feb 2024 W9 - Intraday Analysis - US GDPThis is my Intraday analysis on EURUSD for 28 Feb 2024 W9 based on Smart Money Concept (SMC) which includes the following Time Frames:
4H
15m
NOTE: Nothing changed again from yesterday, 4H no changes and 15m just created INT to INT Structure.
4H Chart Analysis
1.
Swing Bearish
INT Bullish
Swing Pullback Phase
2.
After a BOS and iBOS we expect a Pullback.
As expected after the Bullish CHoCH and mitigation of 4H/Daily Demand zones, we initiated the INT Structure Pullback.
Price reached the 4H/Daily Supply and from there we could start the bearish continuation.
Price failed to continue the bearish move and as expected it changed bullish and created iBOS confirming Swing Low and Bearish Swing Pullback Phase started.
3.
After Bullish iBOS confirming Swing Pullback Phase started, We are expecting INT Pullback.
Price reached the 4H Supply as expected and showed solid reaction from there. This reaction is starting the Bullish INT Structure Pullback.
We didn't do a Bearish CHoCH to confirm INT High yet. So, there is a probability that price could tap into the CHoCH.
Also we tapped into a Daily Demand (Not a HP zone) which is currently containing price.
As the 4H Swing is bearish, the Swing pullback could be done after reaching the 4H Supply, Bearish CHoCH will be the initial weak conformation and a Bearish iBOS will be the solid confirmation for that scenario.
Other scenario is a deeper Swing Pullback and 4H INT will stay Bullish to facilitate that view.
15m Chart Analysis
1.
Swing Bullish
INT Bullish
INT INT Bearish
INT Continuation Phase
2.
Swing turned bullish to facilitate the 4H Swing Pullback.
After BOS we expect a pullback. No HTF POI price tapped into yet to start the pullback.
Price reached the 4H Supply as expected and from there started the 15m INT Structure Pullback.
We reached the INT Structure extreme and price started a bounce.
Price created a Bullish CHoCH after ranging which indicates that the INT Pullback is over and expectation is to target the Weak INT High.
With the ranging behavior of price we created INT to INT Structure which turned bearish and currently challenging to maybe targeting the INT Structure Pullback low (ii Low @ 1.0803).
EURUSD is Approaching a key levelHey Traders, in today's trading session we are monitoring EURUSD for a selling opportunity around 1.08900 zone, EURUSD is trading in a downtrend and currently is in a correction phase in which it is approaching a key level of 1.08900 support and resistance area.
Trade safe, Joe.
EURUSD 27 Feb 2024 W9 - Intraday Analysis - US Cons. ConfidenceThis is my Intraday analysis on EURUSD for 27 Feb 2024 W9 based on Smart Money Concept (SMC) which includes the following Time Frames:
4H
15m
4H Chart Analysis
1.
Swing Bearish
INT Bullish
Swing Pullback Phase
2.
After a BOS and iBOS we expect a Pullback.
As expected after the Bullish CHoCH and mitigation of 4H/Daily Demand zones, we initiated the INT Structure Pullback.
Price reached the 4H/Daily Supply and from there we could start the bearish continuation.
Price failed to continue the bearish move and as expected it changed bullish and created iBOS confirming Swing Low and Bearish Swing Pullback Phase started.
3.
After Bullish iBOS confirming Swing Pullback Phase started, We are expecting INT Pullback.
Price reached the 4H Supply as expected and showed solid reaction from there. This reaction is starting the Bullish INT Structure Pullback.
We didn't do a Bearish CHoCH to confirm INT High yet. So, there is a probability that price could tap into the CHoCH.
Also we tapped into a Daily Demand (Not a HP zone) which is currently containing price.
As the 4H Swing is bearish, the Swing pullback could be done after reaching the 4H Supply, Bearish CHoCH will be the initial weak conformation and a Bearish iBOS will be the solid confirmation for that scenario.
Other scenario is a deeper Swing Pullback and 4H INT will stay Bullish to facilitate that view.
15m Chart Analysis
1.
Swing Bullish
INT Bullish
INT Continuation Phase
2.
Swing turned bullish to facilitate the 4H Swing Pullback.
After BOS we expect a pullback. No HTF POI price tapped into yet to start the pullback.
Price reached the 4H Supply as expected and from there started the 15m INT Structure Pullback.
We reached the INT Structure extreme and price started a bounce.
Price created a Bullish CHoCH after ranging which indicates that the INT Pullback is over and expectation is to target the Weak INT High.
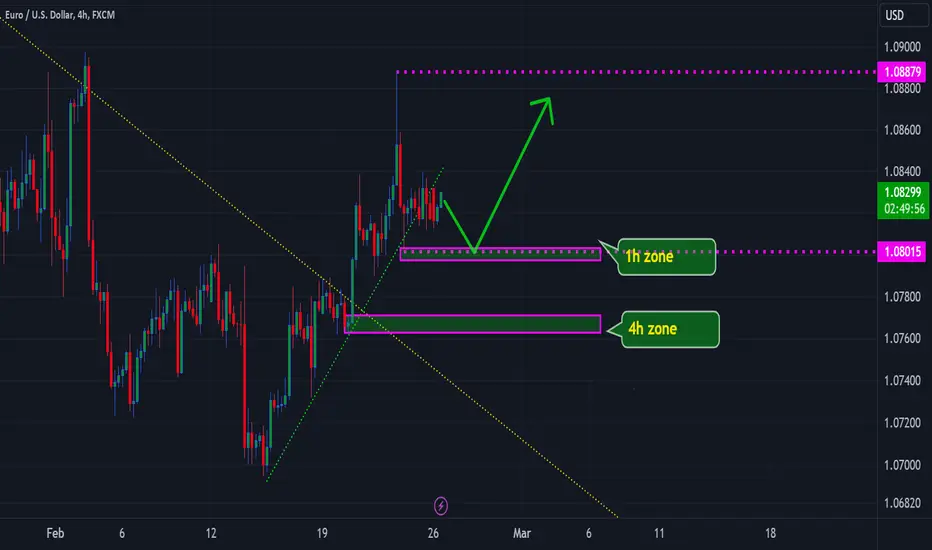
EURUSD: Long options A daily bearish strong candle and a break over trend line mean that we should expect a reversal!
I'm considering a long position within the 1-hour zone. However, I believe it's prudent to await confirmation within the 4-hour zone, which also presents a promising opportunity to long the pair.
Presently, shorting the pair doesn't seem viable to me. I'll remain cautious until there's clear evidence of a continuation of the bearish trend.
Stay tuned for updates as the situation evolves.
Best regards,
EURUSD 26 Feb 2024 W9 - Intraday AnalysisThis is my Intraday analysis on EURUSD for 26 Feb 2024 W9 based on Smart Money Concept (SMC) which includes the following Time Frames:
4H
15m
NOTE: Nothing major changed since last Friday analysis. Price still within a tide range.
4H Chart Analysis
1.
Swing Bearish
INT Bullish
Swing Pullback Phase
2.
After a BOS and iBOS we expect a Pullback.
As expected after the Bullish CHoCH and mitigation of 4H/Daily Demand zones, we initiated the INT Structure Pullback.
Price reached the 4H/Daily Supply and from there we could start the bearish continuation.
Price failed to continue the bearish move and as expected it changed bullish and created iBOS confirming Swing Low and Bearish Swing Pullback Phase started.
3.
After Bullish iBOS confirming Swing Pullback Phase started, We are expecting INT Pullback.
Price reached the 4H Supply as expected and showed solid reaction from there. This reaction is starting the Bullish INT Structure Pullback.
We didn't do a Bearish CHoCH to confirm INT High yet. So, there is a probability that price could tap into the CHoCH.
Also we tapped into a Daily Demand (Not a HP zone) which is currently containing price.
As the 4H Swing is bearish, the Swing pullback could be done after reaching the 4H Supply, Bearish CHoCH will be the initial weak conformation and a Bearish iBOS will be the solid confirmation for that scenario.
Other scenario is a deeper Swing Pullback and 4H INT will stay Bullish to facilitate that view.
15m Chart Analysis
1.
Swing Bullish
INT Bullish
INT Continuation Phase
2.
Swing turned bullish to facilitate the 4H Swing Pullback.
After BOS we expect a pullback. No HTF POI price tapped into yet to start the pullback.
Price reached the 4H Supply as expected and from there started the 15m INT Structure Pullback.
We reached the INT Structure extreme and price started a bounce.
Still we are in Bearish Fractal and the CHoCH is high and this will lead to 2 scenarios,
Scenario 1: Price respecting the 15m INT Structure and continue up.
Scenario 2: Price will target the 4H CHoCH (15m INT Low) initiate a move to the up side from the 4H Demand. (Bearish iBOS, 4H Demand will initiate a Pullback)
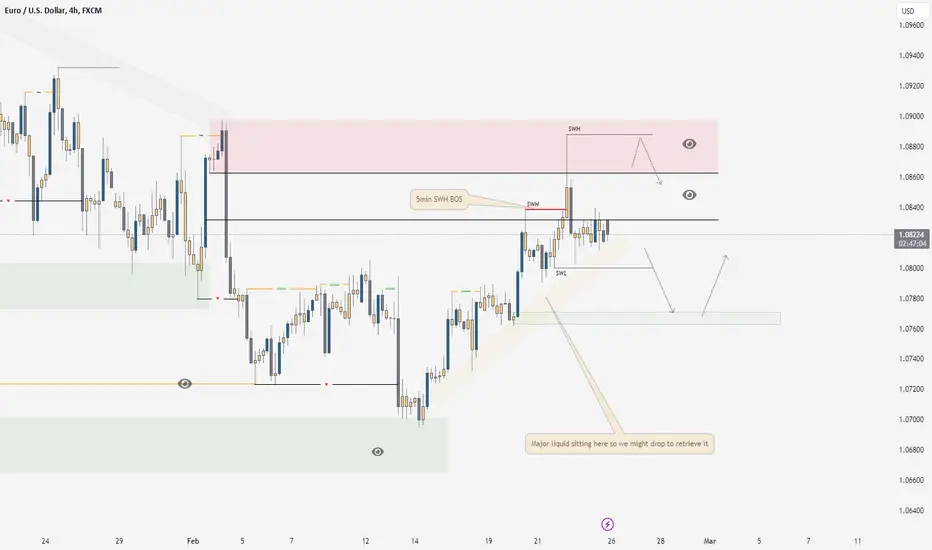
EURUSD 25/2/24EU is doing also the exact same thing as GU in which we have run higher into our supply as we called for our very first higher timeframe markup a few weeks back, following on from this idea we have also built liquid as we thought we would during our pullback stage for price, iam now looking for it to shift bearish within our 5min swing range as we are currently still sitting in a bullish range. iam looking into a long from market open ultimately leading us into a shift for major order flow into a sell move to sweep our liquid from the lows this in turn will then give us good reason to look for longs out of the lows and back into the highs!
track what price gives you and always trade safe!
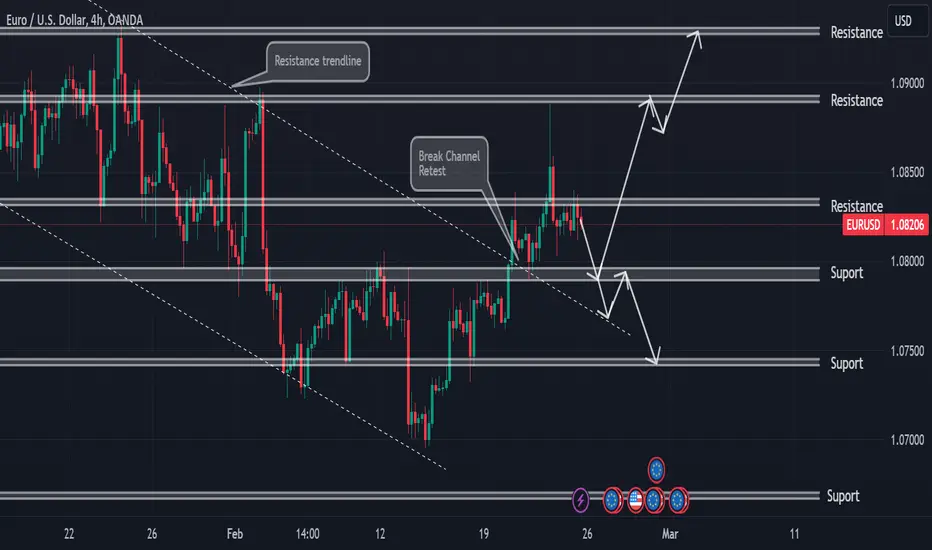
EUR/USD ready for further grow?eurusd has broke outside the bearish channel and the retest already happend. In my opinion we have 2 scenerio's.
1. Price stays above 1.07937 support zone and seeks higher levels. 1.0888 already tested so expecting it to break above toward 1.0930.
2. if price breaks below 1.0787 we can expect a downwards movement again.
Resitance: 1.0833, 1.0860, 1.0888
Support: 1.0787, 1.0755
EURUSD 26-1 Mar 2024 W9 Weekly Analysis - US PCE/GDP WeekThis is my Weekly analysis on EURUSD for 26-1 Mar 2024 W8 based on Smart Money Concept (SMC) which includes the following Time Frames:
Weekly
Daily
4H
Economic Events
Weekly Chart Analysis
1.
Swing Bearish
Internal Bearish
Reached Swing EQ
(Pro Swing + Pro Internal)
2.
After the Bearish iBOS we expected pullback, price tapped into Liq on the lift and a Weekly demand zone which provided a pullback and formed a bullish CHoCH confirming INT Low.
Price reached the INT Extreme and tapped the Weekly Supply Zone and as expected we are targeting at least the CHoCH and then the Weak INT Low.
Price did the Bearish ChoCH and formed a fresh Supply zone which will be potential for shorts once reached to continue the Bearish INT structure and Swing too.
3.
With the Bearish INT Structure we have the confirmation that the Swing Pullback is over and we are currently in the Swing Continuation Phase.
Price had reached the Bearish INT Structure extreme and showed reaction from which resulted in a Bearish CHoCH.
Expectation now set to see price continuing bearish.
Daily Chart Analysis
1.
Swing Bearish
INT Bearish
Swing Continuation / INT Pullback
2.
Within the Daily Bearish Swing we reached the Swing extreme area and mitigated a Weekly Supply zone and formed a bearish iBOS confirming the Swing Pullback is over and we are Pro Bearish Swing and starting the Continuation Phase targeting the Weak Swing Low.
3.
After the iBOS we expect a Pullback.
After mitigating the Daily Demand zone we formed a Bullish CHoCH which confirmed the INT Structure Pullback Phase started.
Expectations is set now for the INT Structure Pullback Phase to continue to the INT EQ up to the Daily/Weekly Supply. But be mindful that the Swing continuation can continue at any time.
There is no HP POI for Shorts up to the Daily/Weekly Supply Zones.
IMO Price could continue up to sweep LIQ from the INT Momentum Phase that leaded to the iBOS before we continue down.
4.
Daily and Weekly demand zones for reactions once reached.
4H Chart Analysis
1.
Swing Bearish
INT Bullish
Swing Pullback Phase
2.
After a BOS and iBOS we expect a Pullback.
As expected after the Bullish CHoCH and mitigation of 4H/Daily Demand zones, we initiated the INT Structure Pullback.
Price reached the 4H/Daily Supply and from there we could start the bearish continuation.
Price failed to continue the bearish move and as expected it changed bullish and created iBOS confirming Swing Low and Bearish Swing Pullback Phase started.
3.
After Bullish iBOS confirming Swing Pullback Phase started, We are expecting INT Pullback.
Price reached the 4H Supply as expected and showed solid reaction from there. This reaction is starting the Bullish INT Structure Pullback.
We didn't do a Bearish CHoCH to confirm INT High yet. So, there is a probability that price could tap into the CHoCH.
Also we tapped into a Daily Demand (Not a HP zone) which is currently containing price.
As the 4H Swing is bearish, the Swing pullback could be done after reaching the 4H Supply, Bearish CHoCH will be the initial weak conformation and a Bearish iBOS will be the solid confirmation for that scenario.
Other scenario is a deeper Swing Pullback and 4H INT will stay Bullish to facilitate that view.
Economic Events for the Week
EURUSD 23 Feb 2024 W8 - Intraday Analysis - German GDP/IFOThis is my Intraday analysis on EURUSD for 23 Feb 2024 W8 based on Smart Money Concept (SMC) which includes the following Time Frames:
4H
15m
4H Chart Analysis
1.
Swing Bearish
INT Bullish
Swing Pullback Phase
2.
After a BOS and iBOS we expect a Pullback.
As expected after the Bullish CHoCH and mitigation of 4H/Daily Demand zones, we initiated the INT Structure Pullback.
Price reached the 4H/Daily Supply and from there we could start the bearish continuation.
Price failed to continue the bearish move and as expected it changed bullish and created iBOS confirming Swing Low and Bearish Swing Pullback Phase started.
3.
After Bullish iBOS confirming Swing Pullback Phase started, We are expecting INT Pullback.
Price reached the 4H Supply as expected and showed solid reaction from there. This reaction is starting the Bullish INT Structure Pullback.
We didn't do a Bearish CHoCH to confirm INT High yet. So, there is a probability that price could tap into the CHoCH.
Also we tapped into a Daily Demand (Not a HP zone) which is currently containing price.
As the 4H Swing is bearish, the Swing pullback could be done after reaching the 4H Supply, Bearish CHoCH will be the initial weak conformation and a Bearish iBOS will be the solid confirmation for that scenario.
Other scenario is a deeper Swing Pullback and 4H INT will stay Bullish to facilitate that view.
15m Chart Analysis
1.
Swing Bullish
INT Bullish
INT Continuation Phase
2.
Swing turned bullish to facilitate the 4H Swing Pullback.
After BOS we expect a pullback. No HTF POI price tapped into yet to start the pullback.
Price reached the 4H Supply as expected and from there started the 15m INT Structure Pullback.
We reached the INT Structure extreme and price started a bounce.
Still we are in Bearish Fractal and the CHoCH is high and this will lead to 2 scenarios,
Scenario 1: Price respecting the 15m INT Structure and continue up.
Scenario 2: Price will target the 4H CHoCH (15m INT Low) initiate a move to the up side from the 4H Demand. (Bearish iBOS, 4H Demand will initiate a Pullback)
3.
15m/4H Demand to initiate a bullish continuation after sweeping the 4H LIQ (CHoCH) if we didn't confirm Bearish 15m iBOS.
If Bearish iBOS confirmed, it will be risky and the 4H Demand will provide imo a pullback only.
Waiting for more price development.
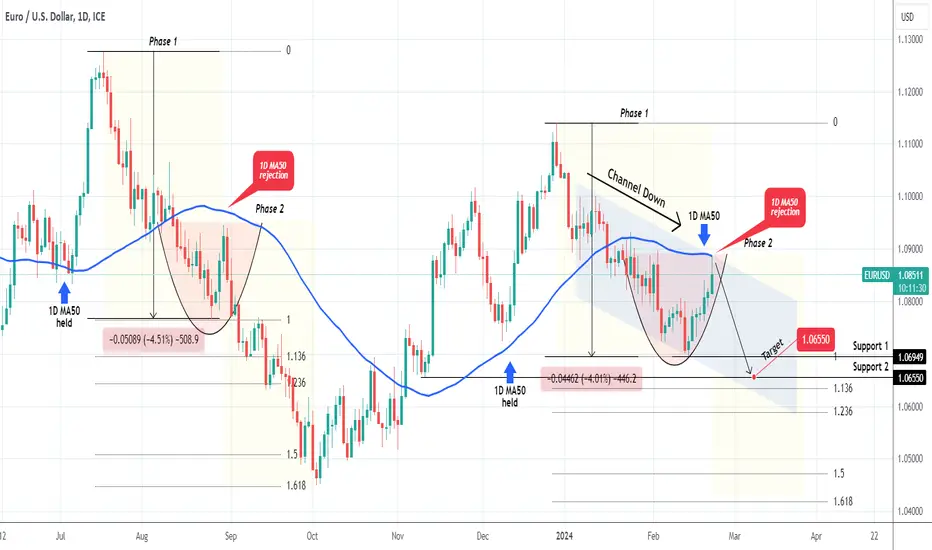
EURUSD 1st hit on the 1D MA50 after a month. Rejection or not?The EURUSD pair hit today the 1D MA50 (blue trend-line) for the first time in almost 1 month (since January 24) and immediately retraced. Will this level provide a full technical rejection? Well at first glance, this is also the top (Lower Highs trend-line) of the nearly 2-month Channel Down. In addition, last time the 1D MA50 was tested (Jan 24) or nearly tested (February 02), it was emphatically rejected.
A similar development took place on the pair's previous long-term correction (July 18 - October 03 2023). After it broke below the 1D MA50, the first counter trend rally was rejected just below it (August 30 2023). That was the start of the Phase 2 of that correction leg, which extended to the 1.136, 1.236, 1.6 and 1.618 Fibonacci extension levels in succession. As long as the 1D candle keeps closing below the 1D MA50, we will remain bearish, targeting Support 2 at 1.06550.
-------------------------------------------------------------------------------
** Please LIKE 👍, FOLLOW ✅, SHARE 🙌 and COMMENT ✍ if you enjoy this idea! Also share your ideas and charts in the comments section below! This is best way to keep it relevant, support us, keep the content here free and allow the idea to reach as many people as possible. **
-------------------------------------------------------------------------------
💸💸💸💸💸💸
👇 👇 👇 👇 👇 👇
EURUSD 22 Feb 2024 W8 - Intraday Analysis - EU CPI / US JoblessThis is my Intraday analysis on EURUSD for 21 Feb 2024 W8 based on Smart Money Concept (SMC) which includes the following Time Frames:
4H
15m
4H Chart Analysis
1.
Swing Bearish
INT Bullish
Swing Pullback Phase
2.
After a BOS and iBOS we expect a Pullback.
As expected after the Bullish CHoCH and mitigation of 4H/Daily Demand zones, we initiated the INT Structure Pullback.
Price reached the 4H/Daily Supply and from there we could start the bearish continuation.
Price failed to continue the bearish move and as expected it changed bullish and created iBOS confirming Swing Low and Bearish Swing Pullback Phase started.
3.
After Bullish iBOS confirming Swing Pullback Phase started, We are expecting INT Pullback.
Price managed to tap into the previous Bearish INT Structure range which acted as a Sell to Buy Range (Demand Range) and price bounced and imo in the direction to target the 4H Supply Zones.
Still Bullish momentum of the pullback is intact and continuation up to 4H Bearish Swing EQ is a HP.
15m Chart Analysis
1.
Swing Bullish
INT Bullish
INT Continuation Phase
2.
Swing turned bullish to facilitate the 4H Swing Pullback.
After BOS we expect a pullback. No HTF POI price tapped into yet to start the pullback.
Most probably price will continue bullish till the 4H Supply zone.
Bearish iBOS will confirm 15m Swing High and Start of Swing Pullback.
Continuing my bullish Bias on EURUSD till we reach the 4H Swing EQ/HP Supply zones.
EURUSD 21 Feb 2024 W8 - Intraday Analysis - EU Conf. US FOMCThis is my Intraday analysis on EURUSD for 21 Feb 2024 W8 based on Smart Money Concept (SMC) which includes the following Time Frames:
4H
15m
4H Chart Analysis
1.
Swing Bearish
INT Bullish
Swing Pullback Phase
3.
After Bullish iBOS confirming Swing Pullback Phase started, We are expecting INT Pullback.
We are currently within a previous Daily Supply that is partially mitigated but with the current Bullish momentum an INT Pullback most probably will start from the 4H Supply/Swing EQ based on the LIQ on the left.
2.
After a BOS and iBOS we expect a Pullback.
As expected after the Bullish CHoCH and mitigation of 4H/Daily Demand zones, we initiated the INT Structure Pullback.
Price reached the 4H/Daily Supply and from there we could start the bearish continuation.
Price failed to continue the bearish move and as expected it changed bullish and created iBOS confirming Swing Low and Bearish Swing Pullback Phase started.
15m Chart Analysis
1.
Swing Bullish
INT Bullish
INT Pullback Phase
2.
Swing turned bullish to facilitate the 4H Swing Pullback.
After BOS we expect a pullback. No HTF POI price tapped into yet to start the pullback.
Most probably price will continue bullish till the 4H Supply zone.
Bearish iBOS will confirm 15m Swing High and Start of Swing Pullback.
Continuing my bullish Bias on EURUSD till we reach the 4H Swing EQ/HP Supply zones.
EURUSD: Triple rejection on 4H MA200, 1D MA200 and Channel Down.EURUSD turned neutral technically on the 1D timeframe (RSI = 49.576, MACD = -0.003, ADX = 24.613) for the first time since February 1st which was the previous LH of the two month Channel Down pattern. It hit today the 1D MA50 in the process and got just pips away from a 4H MA200 test, a trendline that has been intact as a Resistance for almost 1 month (since January 24th when it made a strong LH rejection).
This is a potential Triple Rejection (4H MA200, 1D MA200 and top of Channel Down). As long as the 1D technical outlook remains neutral, it favors the bearish trend. We are opening a short here, targeting the 1.236 Fibonacci extension (TP = 1.0661), which is a level that was hit on every LL inside this Channel Down.
See how our prior idea has worked out:
## If you like our free content follow our profile to get more daily ideas. ##
## Comments and likes are greatly appreciated. ##
