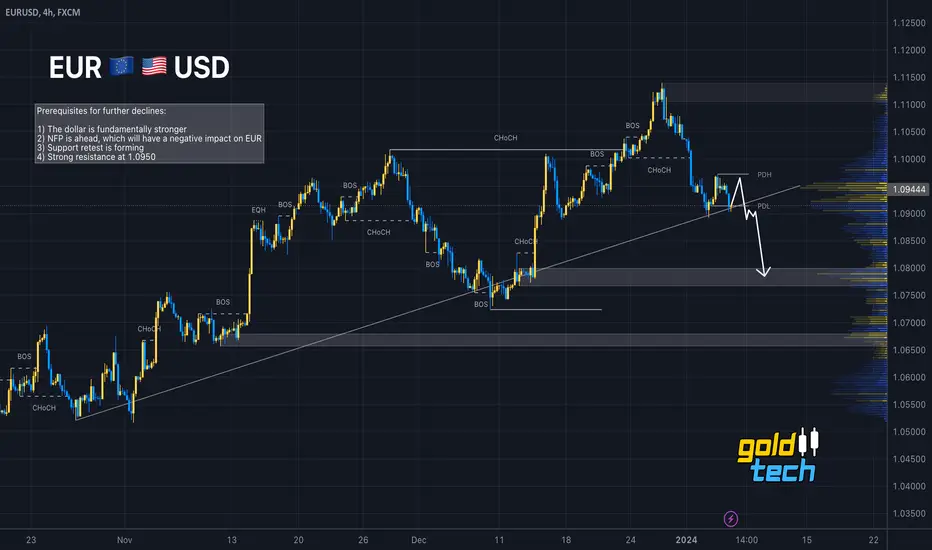
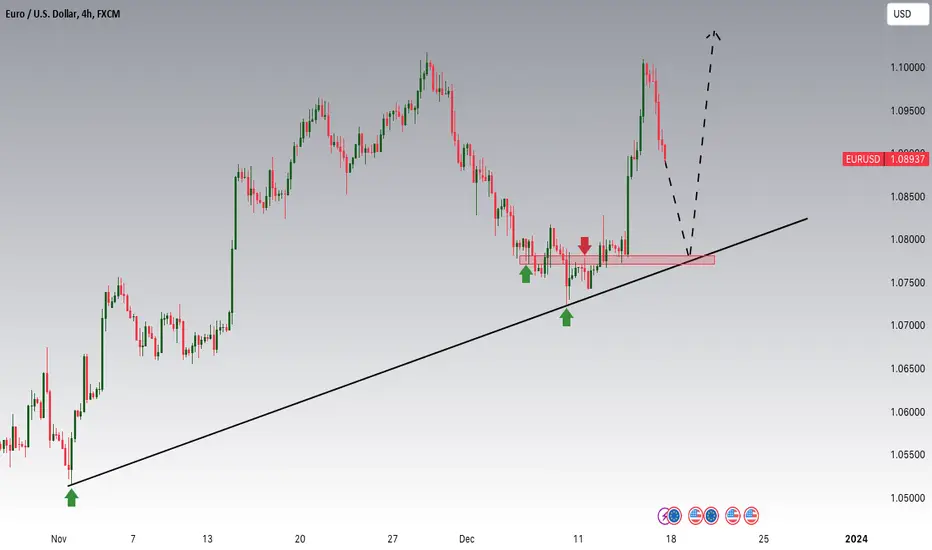
🇪🇺 EURUSD 🇺🇸 - Support retest before the news EURUSD is testing trend support, a second retest is formed and the chances of breaking this line are increasing. There is news ahead and if the market gets bad news for the euro, the price may break this area and fall to 1.075 on the background of the dollar growth
Prerequisites for further declines:
1) The dollar is fundamentally stronger
2) NFP is ahead, which will have a negative impact on EUR
3) Support retest is forming
4) Strong resistance at 1.0950
Eur-usd
EURUSD | Long trade idea!I expect eurusd to bounce from this zone and possibly make a new high to continue its uptrend this year!
Let me know what you think!

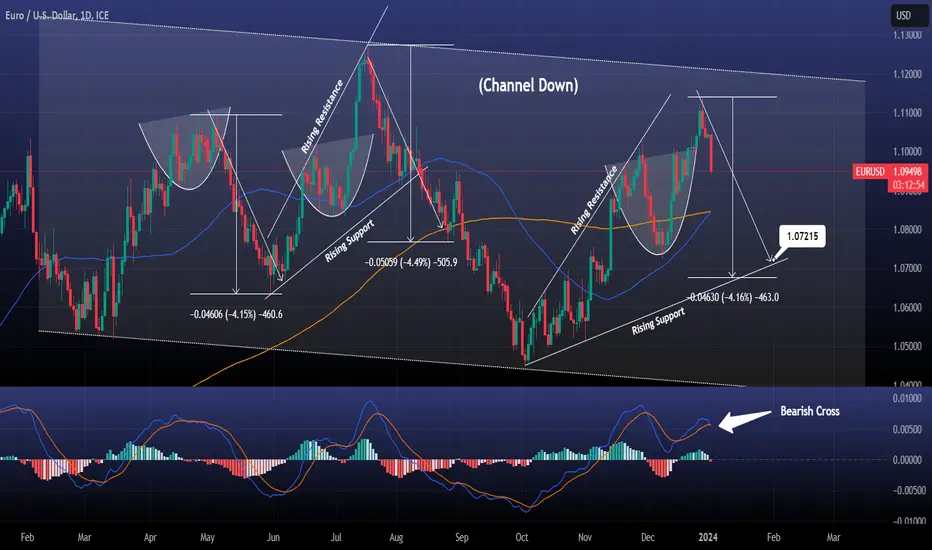
EURUSD Strong decline has started.EURUSD has almost hit the top of the 12 month Channel Down and started to pull back with today's 1day candle being the strongest daily selling since November 30th.
The 1day MACD has formed a Bearish Cross and the downside potential inside this Channel Down is seizeable.
For now sell and target 'just' 1.07215 (bottom of the Megaphone and Rising Support).
If the Rising Support breaks, we will update with a new target, close to the bottom of the Channel Down, but with an entry near the 1day MA50.
Follow us, like the idea and leave a comment below!!
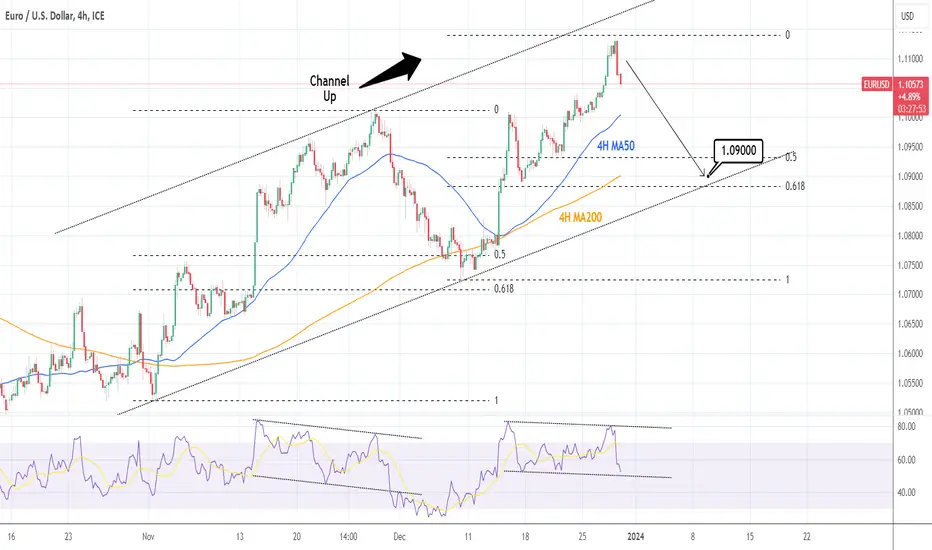
EURUSD: Waiting for the 4h MA50 to act.The EURUSD pair has made a top on the 4h Channel Up and is approaching the 4h MA50.
This is a very important level as when it broke during November's rise, it initiated the Channel's correction to the bottom and the 0.618 Fibonacci level.
Sell if broken and target 1.0900.
Follow, Like, Comment below!

EURUSD: Channel Up started its pull back.EURUSD is about to turn neutral again on its 4H technical outlook (RSI = 55.947, MACD = 0.003, ADX = 54.703) as the uptrend got rejected today near the top of the two month Channel Up. As the 1D RSI is forming the same Bearish Divergence as the November 28th HH, we turn to selling again as this is technically the Bearish Wave of the Channel Up.
The previous HL was formed marginally over the 0.618 Fibonacci level, we aim at a similar symmetrical target (TP = 1.0900).
See how our prior idea has worked:
## If you like our free content follow our profile to get more daily ideas. ##
## Comments and likes are greatly appreciated. ##
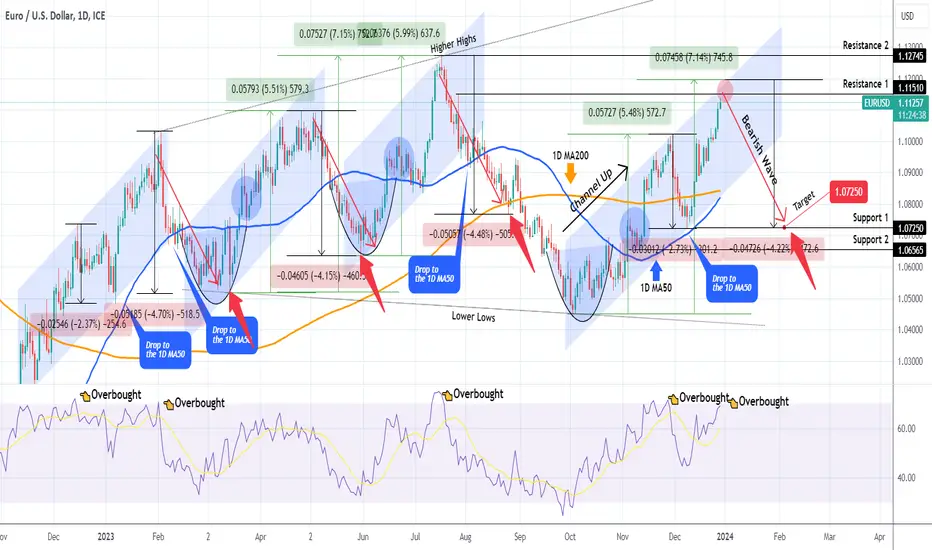
EURUSD Bearish Wave about to start. RSI overbought.The EURUSD pair easily hit our 1.10500 target, which we set on the previous analysis (see chart below) on December 19:
We now shift back again to the 1D time-frame where the 1D RSI is about to hit the 70.00 level and turn overbought, while the price being near the top of the 3-month Channel Up. As you can see, similar Channel Up patterns have existed since November of 2022 and all broke downwards to at least a -4.15% decline, below the 1D MA50 (blue trend-line).
On the current pattern, the 1D MA5 has not been touched since the November 03 break-out. With Resistance 1 waiting at 1.11510 and the maximum total rise we have seen in the past 1 year without a -4% decline being +7.15%, currently being at 1.1200, we treat the current zone as the most efficient Sell Entry since July 18.
A new -4.22% decline would test Support 1 at 1.7250 and that is our medium-term target.
-------------------------------------------------------------------------------
** Please LIKE 👍, FOLLOW ✅, SHARE 🙌 and COMMENT ✍ if you enjoy this idea! Also share your ideas and charts in the comments section below! This is best way to keep it relevant, support us, keep the content here free and allow the idea to reach as many people as possible. **
-------------------------------------------------------------------------------
💸💸💸💸💸💸
👇 👇 👇 👇 👇 👇
EURUSD Potential UpsidesIn anticipation of tomorrow's trading session, our primary focus centers on EURUSD, where we are actively monitoring a potential buying opportunity around the 1.09800 zone. Presently engaged in an uptrend, EURUSD showcases a sustained upward trajectory. Simultaneously, the currency pair is navigating a correction phase, gradually converging towards the trend at the pivotal 1.09800 support and resistance area. This numerical level holds significance as both a historical support point and a crucial juncture where the correction may intersect with substantial market forces.
Our strategic approach for tomorrow involves a meticulous assessment of optimal entry points within the identified 1.09800 zone. Aligning our trading decisions with the ongoing uptrend and the potential market dynamics at the critical support and resistance area is crucial. Navigating the correction phase with precision is key as we aim to capitalize on the identified buying opportunity within the broader context of EURUSD's current trend.
EURUSD 22 Dec 2023 Intraday Analysis - US PCE / Last Post 2023This is my Intraday analysis on EURUSD for 22 Dec 2023 based on Smart Money Concept (SMC) which includes the following Time Frames:
4H
15m
4H Chart Analysis
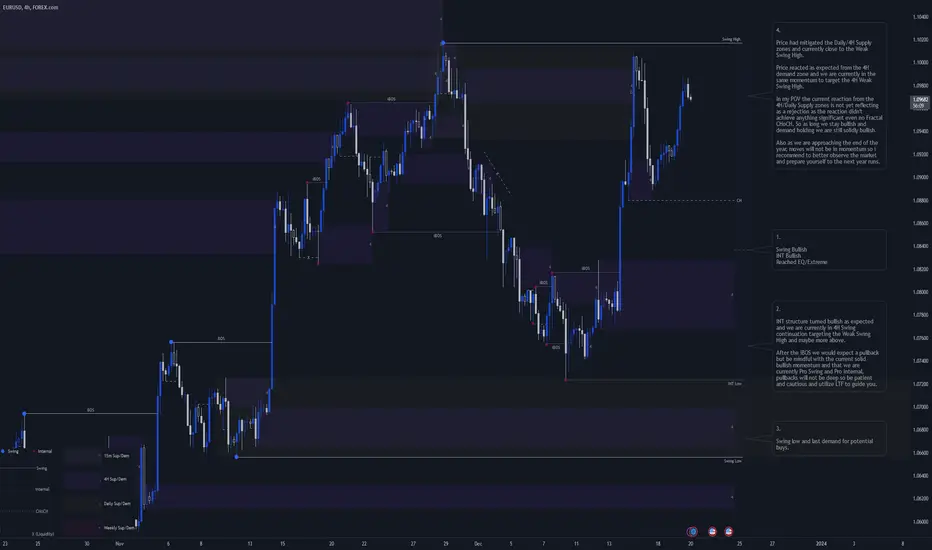
1.
Swing Bullish
INT Bullish
Reached EQ/Extreme
2.
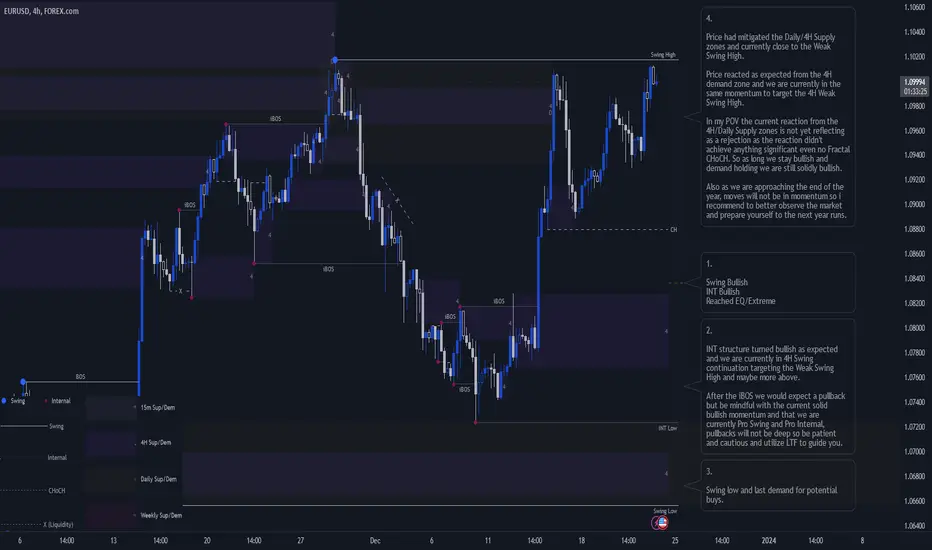
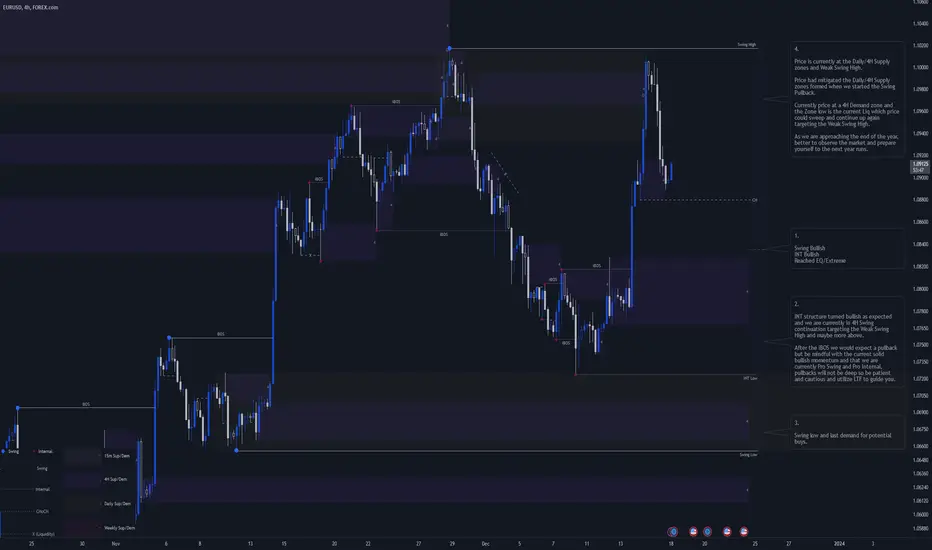
INT structure turned bullish as expected and we are currently in 4H Swing continuation targeting the Weak Swing High and maybe more above.
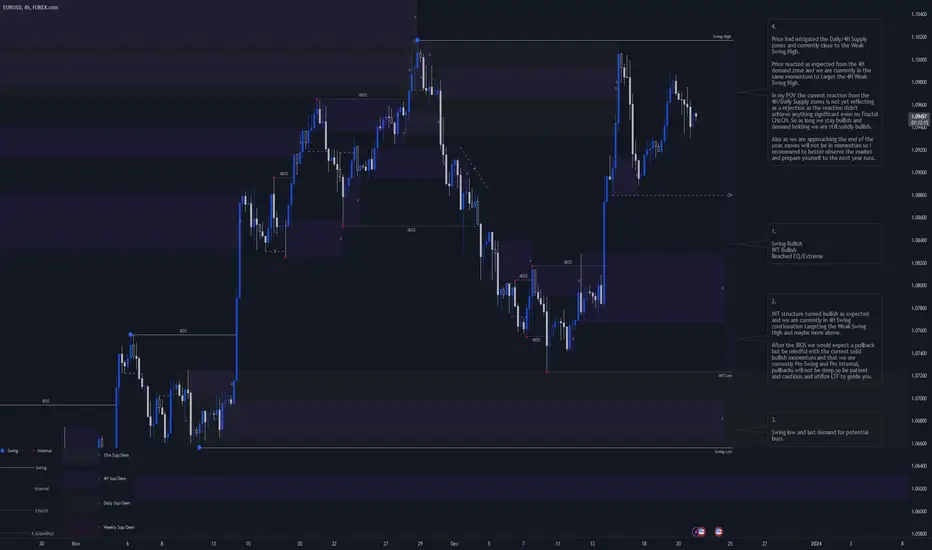
After the iBOS we would expect a pullback but be mindful with the current solid bullish momentum and that we are currently Pro Swing and Pro Internal, pullbacks will not be deep so be patient and cautious and utilize LTF to guide you.
3.
Swing low and last demand for potential buys.
4.
Price had mitigated the Daily/4H Supply zones and currently close to the Weak Swing High.
Price reacted as expected from the 4H demand zone and we are currently in the same momentum to target the 4H Weak Swing High.
In my POV the current reaction from the 4H/Daily Supply zones is not yet reflecting as a rejection as the reaction didn't achieve anything significant even no Fractal CHoCH. So as long we stay bullish and demand holding we are still solidly bullish.
Also as we are approaching the end of the year, moves will not be in momentum so i recommend to better observe the market and prepare yourself to the next year runs.
15m Chart Analysis
1.
Swing Bullish
Internal Bullish
2.
We created a BOS as expected and we are in the Swing continuation to target the 4H Weak Swing High.
After a BOS we expect a pullback and first sign will be a Bearish CHoCH to confirm the INT High. But be mindful that we are in 4H Swing Continuation to i don't expect much pullback before we take out the 4H Weak Swing High.
A note from yesterday that the Internal to Internal Structure (Was mapped in Green) became now the Internal Structure.
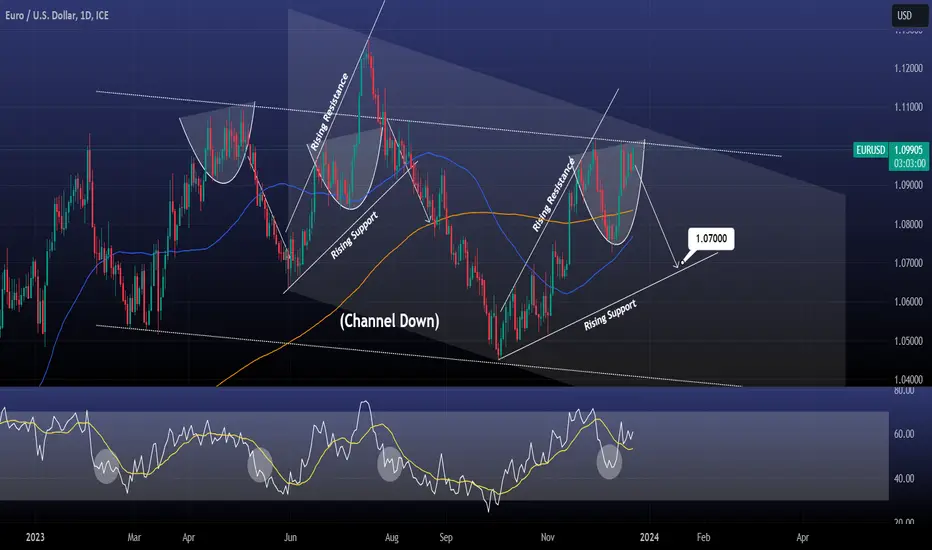
EURUSD Repeatedly rejected on the Channel's top. SELL.The EURUSD pair is testing and so far has been rejected twice, the top of the Channel Down pattern.
The Fed fueled rebound on the 1day MA50 has delayed the decline but the selling pressure at the top of two Channel Down patterns, is expected to do the trick by next week.
Sell and target the Rising Support, which is the bottom of the Megaphone pattern at 1.0700.
Previous chart:
Follow us, like the idea and leave a comment below!!
EURUSD 21 Dec 2023 Intraday Analysis - US GDPThis is my Intraday analysis on EURUSD for 21 Dec 2023 based on Smart Money Concept (SMC) which includes the following Time Frames:
4H
15m
NOTE
Nothing changed much. Price still ranging without any clear momentum. It's the end of the year and with thin liquidity we will have such behaviors.
4H Chart Analysis
1.
Swing Bullish
INT Bullish
Reached EQ/Extreme
2.
INT structure turned bullish as expected and we are currently in 4H Swing continuation targeting the Weak Swing High and maybe more above.
After the iBOS we would expect a pullback but be mindful with the current solid bullish momentum and that we are currently Pro Swing and Pro Internal, pullbacks will not be deep so be patient and cautious and utilize LTF to guide you.
3.
Swing low and last demand for potential buys.
4.
Price had mitigated the Daily/4H Supply zones and currently close to the Weak Swing High.
Price reacted as expected from the 4H demand zone and we are currently in the same momentum to target the 4H Weak Swing High.
In my POV the current reaction from the 4H/Daily Supply zones is not yet reflecting as a rejection as the reaction didn't achieve anything significant even no Fractal CHoCH. So as long we stay bullish and demand holding we are still solidly bullish.
Also as we are approaching the end of the year, moves will not be in momentum so i recommend to better observe the market and prepare yourself to the next year runs.
15m Chart Analysis
1.
Swing Bullish
Internal Bearish
INT INT Bullish
2.
After the Swing BOS price is currently in a Pullback Phase. INT structure turned bearish to facilitate the Swing Pullback.
Price currently is ranging due to the Pullback Phase and the Bullish Continuation.
Still our expectations is that price going to target the 15m / 4H Weak Swing High. This view will be invalidated temporarily if we created a bearish iBOS (Break of INT Low) which will lead to a deep pullback.
As i'm expecting price will not be clear as we are close to year end and liquidity becoming thin. Observation and working on personal improvements is the best practice currently.
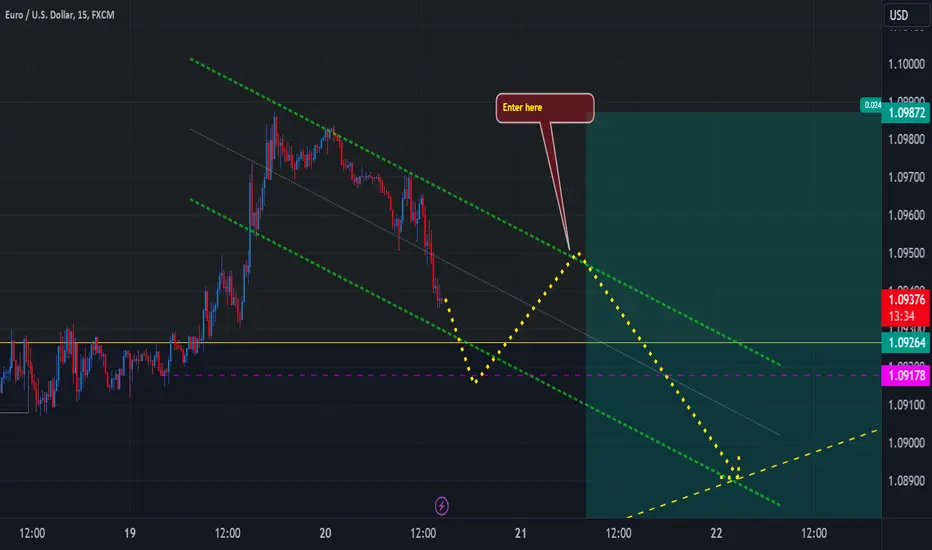
EUR/USD Predicted Market Path:
Greetings traders,
Let's explore the anticipated market path for EUR/USD. As you observe the charts, pay close attention to the dynamics.
This is the mid-term analysis
Key Level:
A break below the critical level of 1.09178 could act as a trigger, activating a sell setup approximately around 1.0950.
This level is strategically chosen to align with the bearish channel, enhancing its significance in the analysis.
Market movements can be influenced by a variety of factors, so it's crucial to remain vigilant and adapt to changing conditions. Integrate your risk management strategies for a well-rounded approach.
Trade wisely and stay informed!
EURUSD Potential UpsidesIn today's trading session, our primary focus is on EURUSD, where we are actively monitoring a potential buying opportunity around the 1.08900 zone. Presently engaged in an uptrend, EURUSD showcases a sustained upward trajectory. Simultaneously, the currency pair is navigating a correction phase, gradually converging towards the trend at the critical 1.08900 support and resistance area. This numerical level holds significance as both a historical support point and a pivotal juncture where the correction may intersect with substantial market forces.
Our strategic approach for today involves a meticulous assessment of optimal entry points within the identified 1.08900 zone. Aligning our trading decisions with the ongoing uptrend and the potential market dynamics at the critical support and resistance area is crucial. Navigating the correction phase with precision is key as we aim to capitalize on the identified buying opportunity within the broader context of EURUSD's current trend.
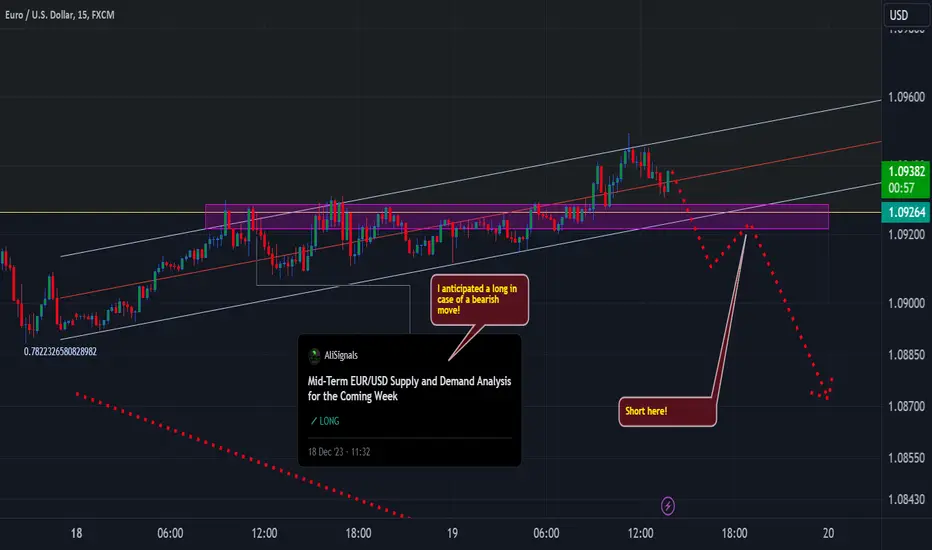
This is the EUR/USD INTRADAY analysis!Hello traders,
Regarding the mid-term analysis any breaks below the purple zone and breaking below the upward channel would make a bearish setup available!
Try to take a look at Mid-term setup
EURUSD 20 Dec 2023 Intraday Analysis - EU/US Consumer ConfidenceThis is my Intraday analysis on EURUSD for 20 Dec 2023 based on Smart Money Concept (SMC) which includes the following Time Frames:
4H
15m
4H Chart Analysis
1.
Swing Bullish
INT Bullish
Reached EQ/Extreme
2.
INT structure turned bullish as expected and we are currently in 4H Swing continuation targeting the Weak Swing High and maybe more above.
After the iBOS we would expect a pullback but be mindful with the current solid bullish momentum and that we are currently Pro Swing and Pro Internal, pullbacks will not be deep so be patient and cautious and utilize LTF to guide you.
3.
Swing low and last demand for potential buys.
4.
Price had mitigated the Daily/4H Supply zones and currently close to the Weak Swing High.
Price reacted as expected from the 4H demand zone and we are currently in the same momentum to target the 4H Weak Swing High.
In my POV the current reaction from the 4H/Daily Supply zones is not yet reflecting as a rejection as the reaction didn't achieve anything significant even no Fractal CHoCH. So as long we stay bullish and demand holding we are still solidly bullish.
Also as we are approaching the end of the year, moves will not be in momentum so i recommend to better observe the market and prepare yourself to the next year runs.
15m Chart Analysis
1.
Swing Bullish
Internal Bearish
INT INT Bullish
2.
Price created a bearish iBOS which confirms a Swing High.
We are currently in the Swing pullback phase which means we are in a short term bearish momentum to facilitate the Swing pullback.
We have some potential supply zones for Shorts to play the Swing Pullback as long we didn't reach the Swing EQ/Discount.
We had mitigated the extreme supply withing the INT structure but the INT INT Structure is Still Solid Bullish. We need an iiBOS to confirm that the INT pullback is over and we can look for Shorts to play the 15m Swing Pullback.
But be mindful that we are in the 4H Bullish Continuation Phase and we are targeting the Weak Swing High on 4H and also on 15m, so Shorts are risky that's why we need a solid structure breaks to confirm the bearish move.
EURUSD: The picture is very clear on the 1w chart.The EURUSD pair had been going up and down the 1w MA50 lately, being higly volatile especially after the Fed meeting last week.
This can be confusing on smaller time frames like 4h or 1h (even 1d) but on the 1w the situation is pretty clear technically.
The long term trend is bearish inside a Bearish Megaphone since 2017.
After a Channel Up pushed the price upwards, the pair tops when the 1w RSI forms Lower Highs.
Then when the price crosses under the 1w MA50, a strong downtrend begins, the previous two have been -22.80% and -15.65% respectively.
This time the Fed has distorted this but the effect shouldn't last for long.
This is a strong sell signal and the target can be any price within the 1.000 - 0.9500 range.
Follow, Like, Comment below!

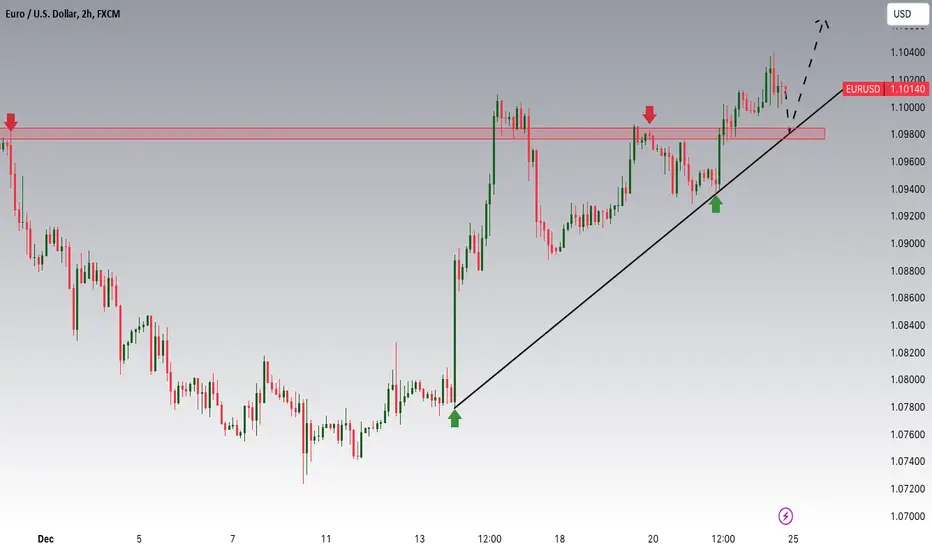
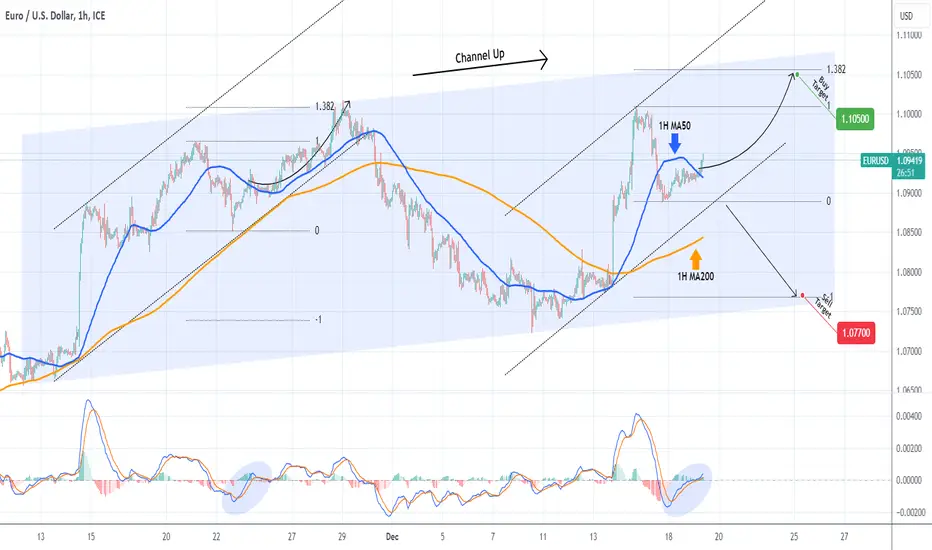
EURUSD Blow-off top incomingThe EURUSD pair broke again above the 1H MA50 (blue trend-line) and is trading within two Channel Up patterns: a wider (blue) one and the shorter term dotted one. The 1H MACD indicates that we are on the same level as the November 23 MA50 break-out that peaked on the 1.382 Fibonacci.
As a result, as long as the dotted Channel Up holds, we are bullish short-term, targeting 1.10500 (1.382 Fibonacci extension). If the pattern breaks, we will sell and target the -1.00 Fibonacci extension at 1.07700.
Related material (previous trade):
-------------------------------------------------------------------------------
** Please LIKE 👍, FOLLOW ✅, SHARE 🙌 and COMMENT ✍ if you enjoy this idea! Also share your ideas and charts in the comments section below! This is best way to keep it relevant, support us, keep the content here free and allow the idea to reach as many people as possible. **
-------------------------------------------------------------------------------
💸💸💸💸💸💸
👇 👇 👇 👇 👇 👇
EURUSD 19 Dec 2023 Intraday Analysis - EUR CPI This is my Intraday analysis on EURUSD for 19 Dec 2023 based on Smart Money Concept (SMC) which includes the following Time Frames:
4H
15m
NOTE:
Nothing changed since yesterday, price is ranging within a tide range and maybe with CPI today we can see some movement.
4H Chart Analysis
1.
Swing Bullish
INT Bullish
Reached EQ/Extreme
2.
INT structure turned bullish as expected and we are currently in 4H Swing continuation targeting the Weak Swing High and maybe more above.
After the iBOS we would expect a pullback but be mindful with the current solid bullish momentum and that we are currently Pro Swing and Pro Internal, pullbacks will not be deep so be patient and cautious and utilize LTF to guide you.
3.
Swing low and last demand for potential buys.
4.
Price is currently at the Daily/4H Supply zones and Weak Swing High.
Price had mitigated the Daily/4H Supply zones formed when we started the Swing Pullback.
Currently price at a 4H Demand zone and the Zone low is the current Liq which price could sweep and continue up again targeting the Weak Swing High.
As we are approaching the end of the year, better to observe the market and prepare yourself to the next year runs.
15m Chart Analysis
1.
Swing Bullish
Internal Bearish
2.
Price created a bearish iBOS which confirms a Swing High.
We are currently in the Swing pullback phase which means we are in a short term bearish momentum to facilitate the Swing pullback.
We have some potential supply zones for Shorts to play the Swing Pullback as long we didn't reach the Swing EQ/Discount.
I prefer the upper 2 zones as they are positioned in the Premium and they can potentially categorized as FLIP zones.
For Swing bullish continuation, I'm looking on the 4H/15m Demand zone to look for reaction from for Longs as long the Strong Swing Low will Hold.

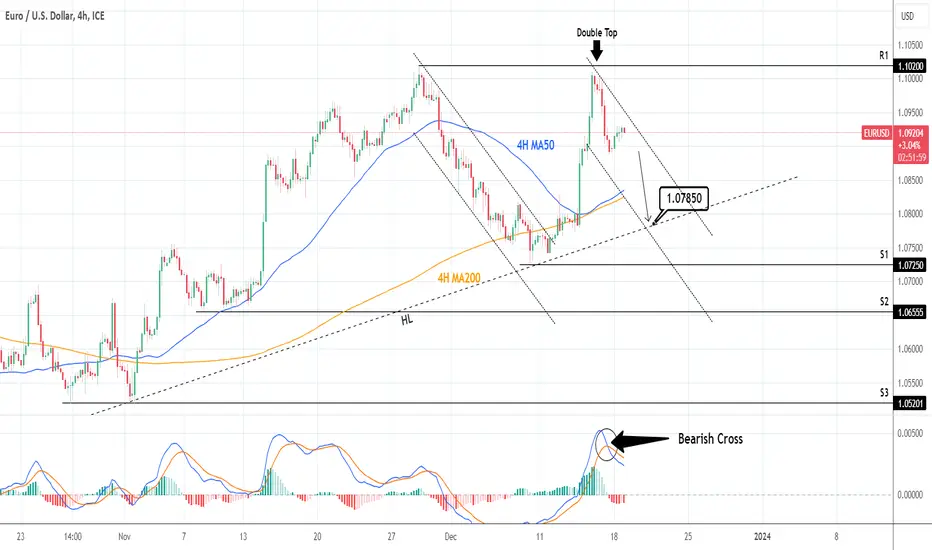
EURUSD: Confirmed Sell signal.EURUSD is technicall bullish on the 4H outlook (RSI = 59.390, MACD = 0.002, ADX = 51.118) but had a Double Top rejection on the R1 level (1.10200) on Thursday and is pulling back. The 4H MACD Bearish Cross is validation of the the short signal and the immediate target is the HL trend-line (TP = 1.07850). If the price crosses under the S1 level (1.07250), we will sell again and target the S2, even S3 levels.
See how our prior idea has worked:
## If you like our free content follow our profile to get more daily ideas. ##
## Comments and likes are greatly appreciated. ##
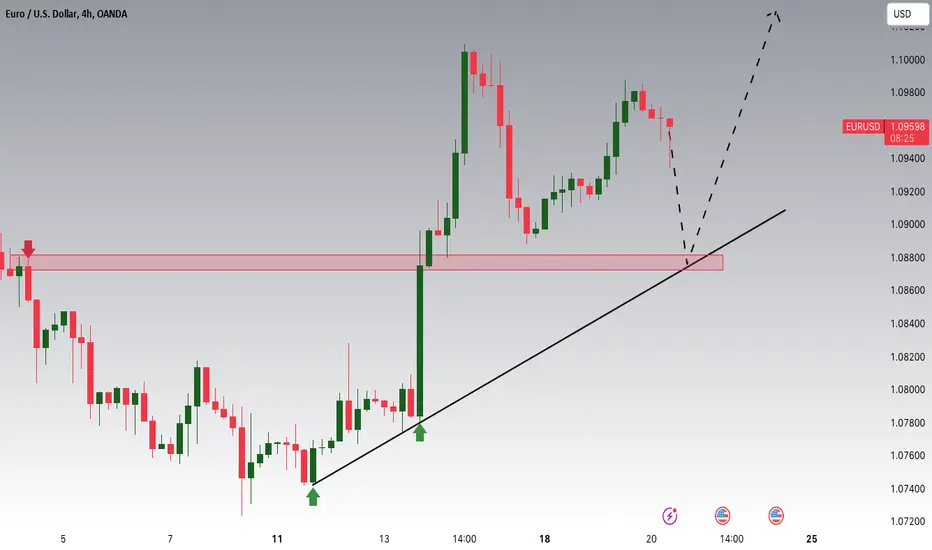
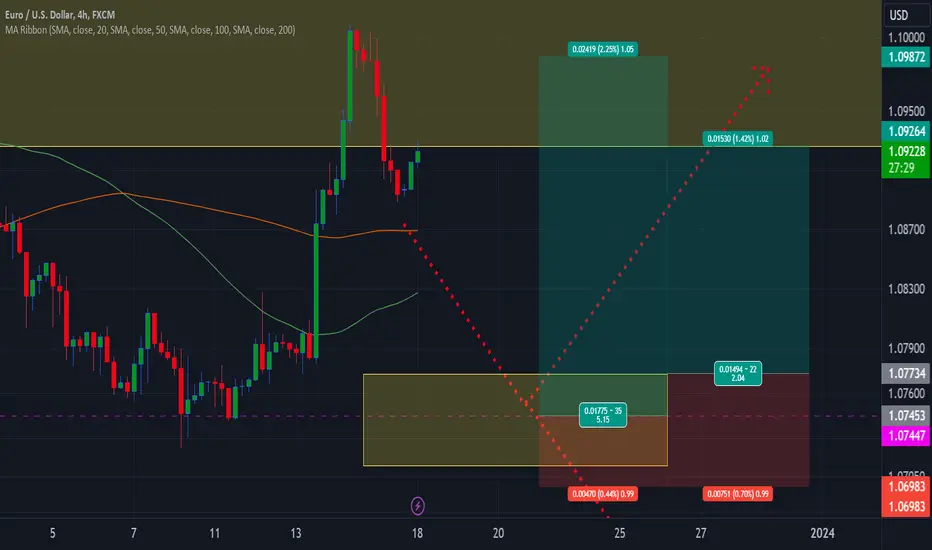
Mid-Term EUR/USD Supply and Demand Analysis for the Coming WeekHello fellow traders,
Take a look at the Daily chart!
While the bullish momentum encountered resistance around a robust zone, there's an intriguing tug-of-war with the bulls demonstrating resilience.
Introduction:
This analysis delves into the mid-term outlook for EUR/USD, navigating through the intricacies of supply and demand dynamics. Stay alert for intraday updates throughout the week, and be prepared for potential market responses to the upcoming USA Gross Domestic Product (GDP) release on Thursday.
Technical Analysis:
Supply and Demand Levels:
Distilled key supply and demand zones for strategic entry and exit points.
Notable supply zone: Above 1.07725
Dynamic demand zone: Spanning 1.07450 to 1.07125
Trade Setup:
Entry:
Explore a long position between 1.07725 and 1.07450, encapsulating the resilient demand zone.
Stop-Loss (SL):
Safeguard the position with a stop-loss strategically below the demand zone, residing beneath 1.07125.
Take Profit (TP):
A phased approach to taking profits, commencing between 1.09250 and 1.09875, mindful of potential resistance.
Note on Short Position:
While taking a short position is possible, it comes with heightened risk, given the prevailing demand zone. Consider shorting cautiously, aware of potential challenges reaching the aim of the zone.
Fundamental Consideration:
Exercise caution in light of the impending USA Gross Domestic Product (GDP) release on Thursday. Expect possible impacts on the currency market, necessitating adjustments in positions.
Risk Management:
Calibrate position sizes based on individual risk tolerance and uphold a favorable risk-reward ratio.
Keep an eye on the economic calendar for additional fundamental events with the potential to sway the trade.
Intraday Updates:
Stay tuned for real-time intraday updates, shaping the analysis in response to dynamic market conditions.
EURUSD 18 Dec 2023 Intraday AnalysisThis is my Intraday analysis on EURUSD for 18 Dec 2023 based on Smart Money Concept (SMC) which includes the following Time Frames:
4H
15m
4H Chart Analysis
1.
Swing Bullish
INT Bullish
Reached EQ/Extreme
2.
INT structure turned bullish as expected and we are currently in 4H Swing continuation targeting the Weak Swing High and maybe more above.
After the iBOS we would expect a pullback but be mindful with the current solid bullish momentum and that we are currently Pro Swing and Pro Internal, pullbacks will not be deep so be patient and cautious and utilize LTF to guide you.
3.
Swing low and last demand for potential buys.
4.
Price is currently at the Daily/4H Supply zones and Weak Swing High.
Price had mitigated the Daily/4H Supply zones formed when we started the Swing Pullback.
Currently price at a 4H Demand zone and the Zone low is the current Liq which price could sweep and continue up again targeting the Weak Swing High.
As we are approaching the end of the year, better to observe the market and prepare yourself to the next year runs.
15m Chart Analysis
1.
Swing Bullish
Internal Bearish
2.
Price created a bearish iBOS which confirms a Swing High.
We are currently in the Swing pullback phase which means we are in a short term bearish momentum to facilitate the Swing pullback.
We have some potential supply zones for Shorts to play the Swing Pullback as long we didn't reach the Swing EQ/Discount.
I prefer the upper 2 zones as they are positioned in the Premium and they can potentially categorized as FLIP zones.
For Swing bullish continuation, I'm looking on the 4H/15m Demand zone to look for reaction from for Longs as long the Strong Swing Low will Hold.
3.
Potential Demand Zone within the current internal and in the Swing Discount.
4.
Extreme Demand zone to hold if the 15m Swing will continue Bullish.
EURUSD 18 - 22 Dec 2023 Weekly Analysis - 2 Weeks for 2023 End!This is my Weekly analysis on EURUSD for 18 - 22 Dec 2023 based on Smart Money Concept (SMC) which includes the following Time Frames:
Weekly
Daily
4H
Economic Events
Weekly Chart Analysis
1.
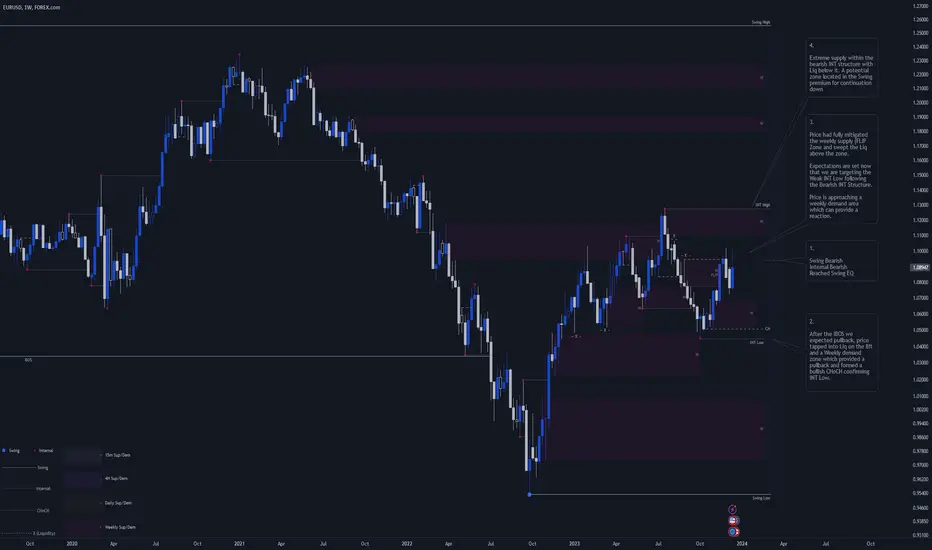
Swing Bearish
Internal Bearish
Reached Swing EQ
2.
After the iBOS we expected pullback, price tapped into Liq on the lift and a Weekly demand zone which provided a pullback and formed a bullish CHoCH confirming INT Low.
3.
Price had fully mitigated the weekly supply (FLIP Zone and swept the Liq above the zone.
Expectations are set now that we are targeting the Weak INT Low following the Bearish INT Structure.
Price is approaching a weekly demand area which can provide a reaction.
4.
Extreme supply within the bearish INT structure with Liq below it. A potential zone located in the Swing premium for continuation down
Daily Chart Analysis
1.
Swing Bearish
INT Bullish
OF Bearish
Reached EQ
2.
After BOS we expect a pullback
OF turned bullish to facilitate the Swing pullback and we formed bullish iBOS to confirm the Swing Low and the pullback.
With that pullback we formed Weekly and Daily demand zones which are potential for longs after confirmation on LTFs.
3.
After the Bullish iBOS we are expecting a pullback. First sign of the pullback maybe starting is a CHoCH which price did and confirmed INT High.
Price reached a daily demand zone where we have seen a solid reaction from to target the Weak INT High.
The mitigation of this daily demand zone could be the start of the Bullish continuation of the Daily INT Structure. But be mindful that the Daily Swing is Bearish, Reached the EQ and mitigated Daily/Weekly Supply zones, So we may have finished the Swing pullback and we are in the Swing bearish continuation to target the Weak Swing Low.
Let's watch LTF to guide us.
4H Chart Analysis
1.
Swing Bullish
INT Bullish
Reached EQ/Extreme
2.
INT structure turned bullish as expected and we are currently in 4H Swing continuation targeting the Weak Swing High and maybe more above.
After the iBOS we would expect a pullback but be mindful with the current solid bullish momentum and that we are currently Pro Swing and Pro Internal, pullbacks will not be deep so be patient and cautious and utilize LTF to guide you.
3.
Swing low and last demand for potential buys.
4.
Price is currently at the Daily/4H Supply zones and Weak Swing High.
Price had mitigated the Daily/4H Supply zones formed when we started the Swing Pullback.
Currently price at a 4H Demand zone and the Zone low is the current Liq which price could sweep and continue up again targeting the Weak Swing High.
As we are approaching the end of the year, better to observe the market and prepare yourself to the next year runs.
Economic Events for the Week
EURUSD Potential UpsidesHey Traders, in the coming week we are monitoring EURUSD for a buying opportunity around 1.07900 zone, EURUSD is trading in an uptrend and currently is in a correction phase in which it is approaching the trend at 1.07900 support and resistance area.
Trade safe, Joe.
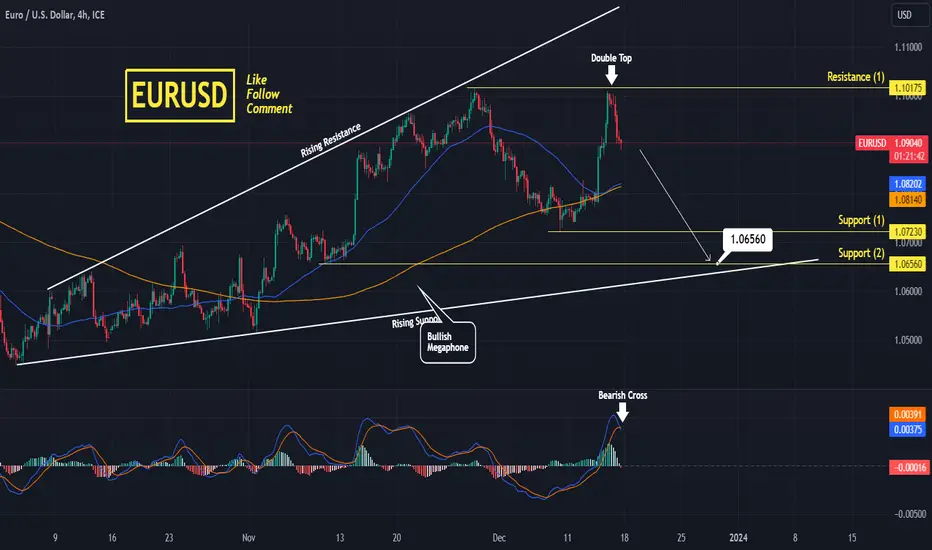
EURUSD Double Top formed.EURUSD got rejected on Resistance (1) forming a Double Top.
With the medium term pattern being a Bullish Megaphone, this rejection technically aims at the bottom of the pattern.
Trading Plan:
1. Sell on the current market price.
Targets:
1. 1.0650 (Support 2 and bottom of Bullish Megaphone).
Tips:
1. The MACD (4h) just formed a Bearish Cross, which is a confirmation of the sell signal.
Please like, follow and comment!!
Notes:
Past trading plan: