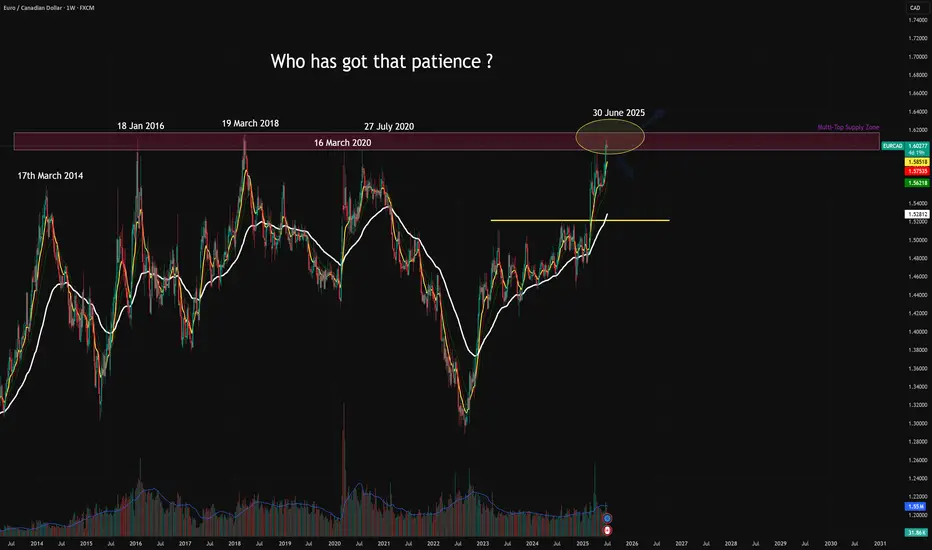
EURCAD – Over a Decade of Rejections Finally Breaking the Cycle?EURCAD is once again testing the legendary multi-year resistance between 1.60 and 1.6150, a zone that has caused at least 5 major rejections since 2014. Each of those led to significant drawdowns — yet this time, price is pressing deeper into it, potentially signaling a macro regime shift if bulls follow through.
Key Technical Observations
Timeframe: 1W
“Multi-Year Supply Zone” or “Overhead Resistance Zone”: 1.60 – 1.6150
Historical Reaction Dates:
🔸 17 Mar 2014
🔸 18 Jan 2016
🔸 19 Mar 2018
🔸 16 Mar 2020
🔸 27 Jul 2020
Current Candle (30 Jun 2025):
Pierced the zone briefly — now hovering just inside
Volume: Noticeable uptick in the last few weeks — interest is real
Structure Below: Strong accumulation base breakout around 1.5280, serving as major support now
TLDR
EURCAD is testing a monster historical supply zone (1.60–1.6150) for the 6th time in 11 years. This could be the breakout that changes the macro trend, but without confirmation, it's still a zone to respect.
Disclaimer
This is for educational purposes only. Not financial advice.
Euradushort
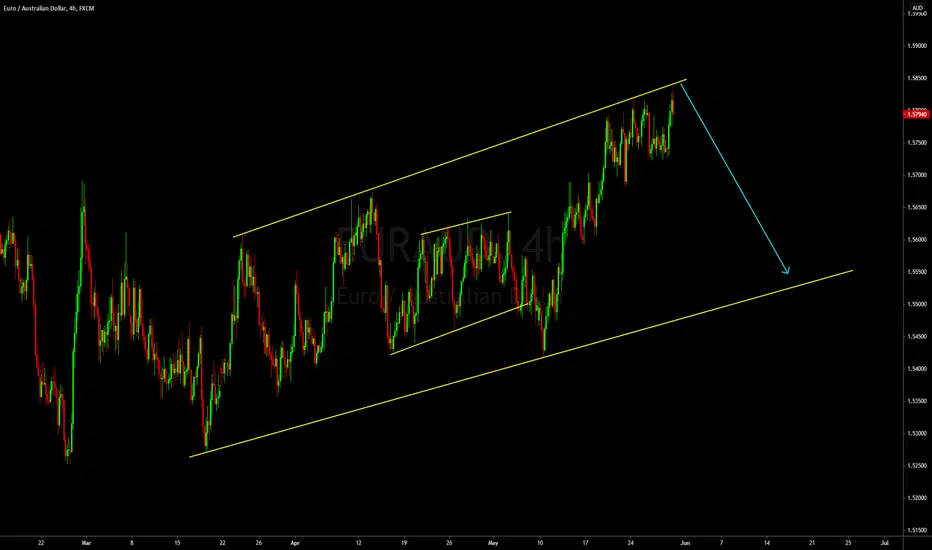
Possible Sell Trade Setup On EURAUDHey Traders,
Check EURAUD out, the pair has been on a very tight uptrend after breaking above the upper band of the WEEKLY descending channel.
Now, the market got a fast rebound from the OB, and then commence a new bearish trend phase to retest the broken band or make a deeper flow below.
Additionally, the price made a complete Head and Shoulder pattern and could support the take on the bearish momentum.
The worth looking into.
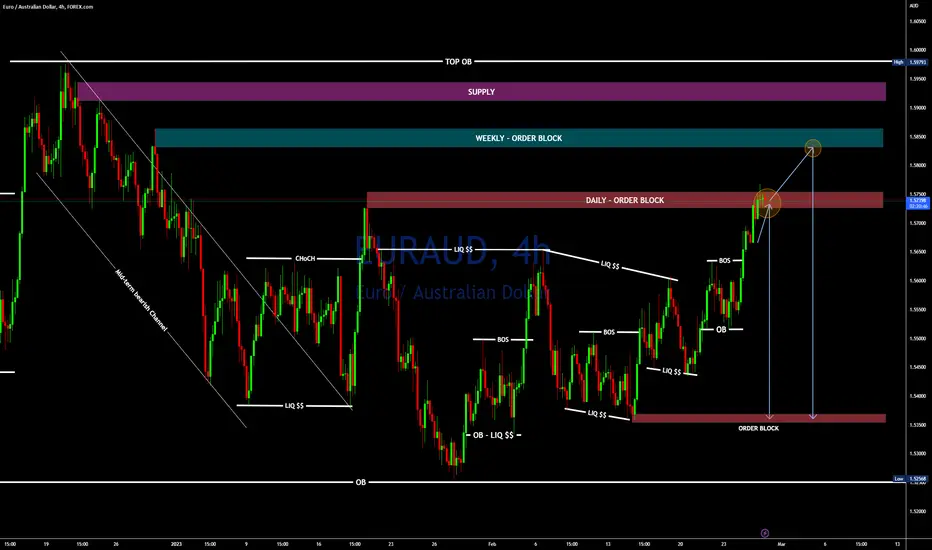
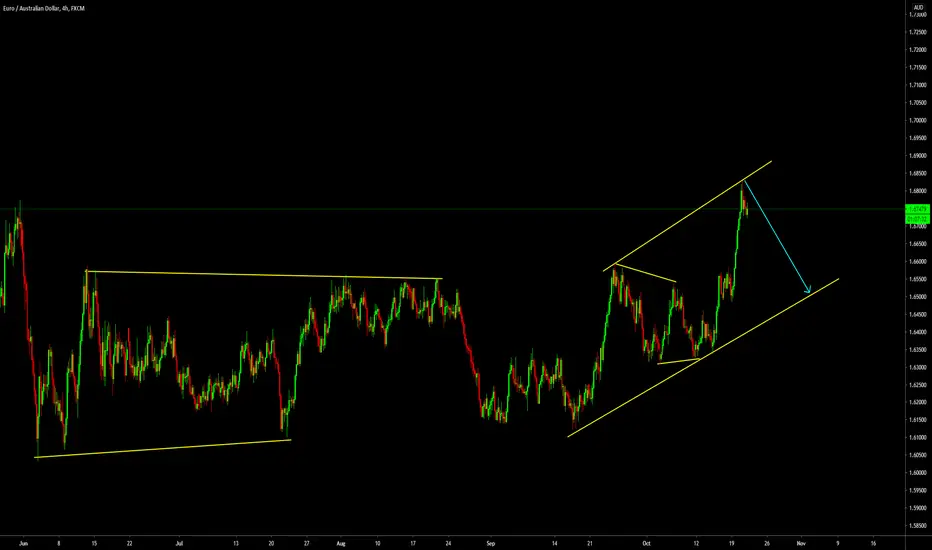
Bearish outlook on EURAUDThe EURUD is currently retesting the daily supply zone making it the first time in over 1 month to retest that area.
Technically, i am expecting some fight at that zone from the buyers trying to push it a bit higher, but above that is the 2023 All-time high (Weekly Supply zone - OB).
So, you can positing yourself ahead of the fall coming in hot, sooner than later.
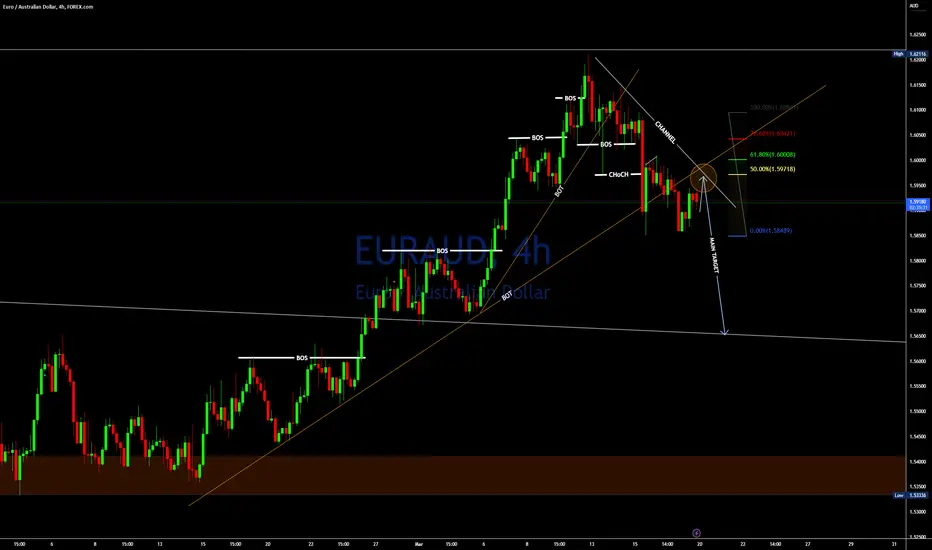
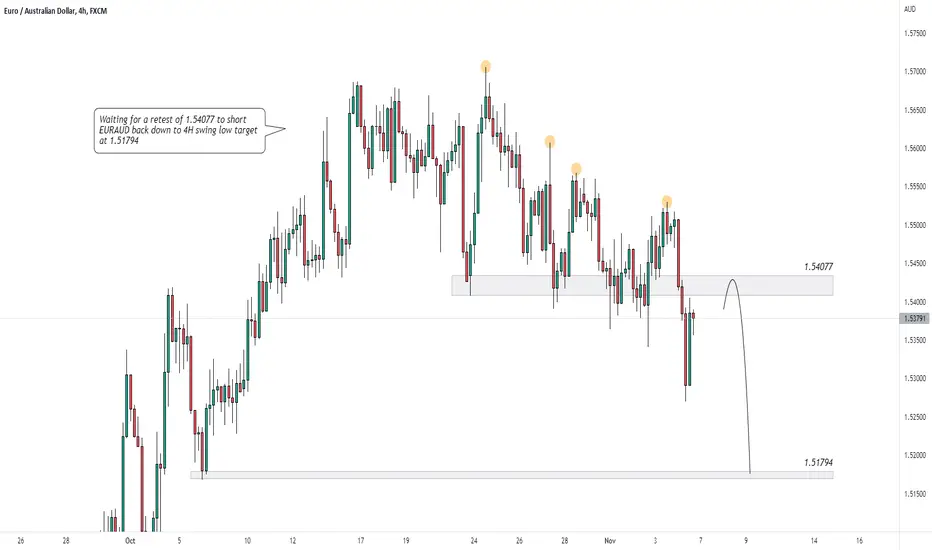
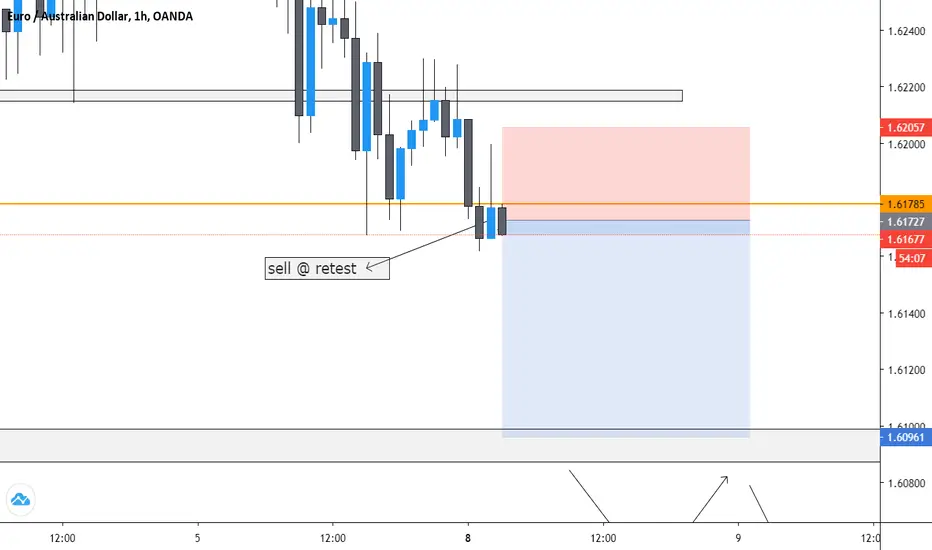
EURAUD SHORT - STRONG BEARISH STRUCTUREWaiting for a retest of 1.54077 to short EURAUD back down to 4H swing low target at 1.51794
If you agree drop a like and if you have any questions leave a comment below :)
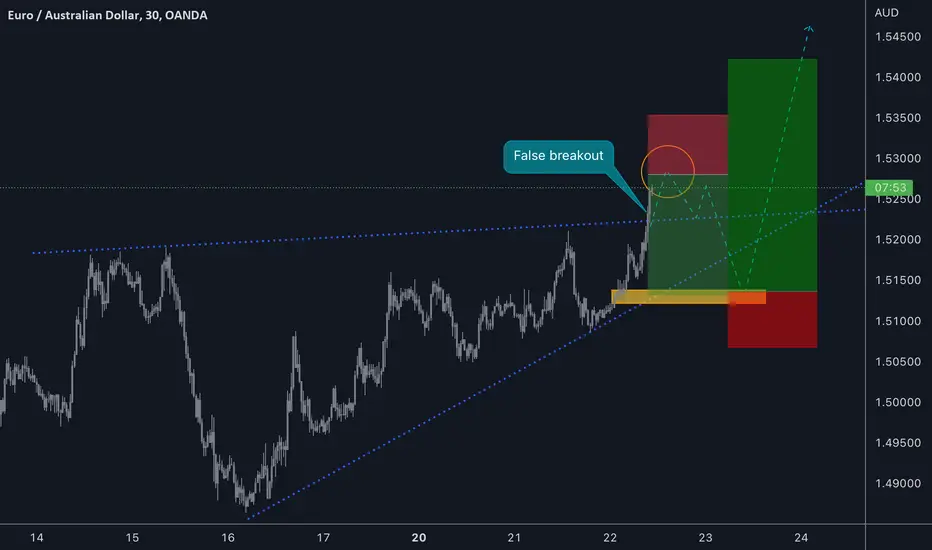
EURAUD SHORTFalse breakout on the triangle
1st entry sell after taking profit
2nd entry buy to continue with the uptrend
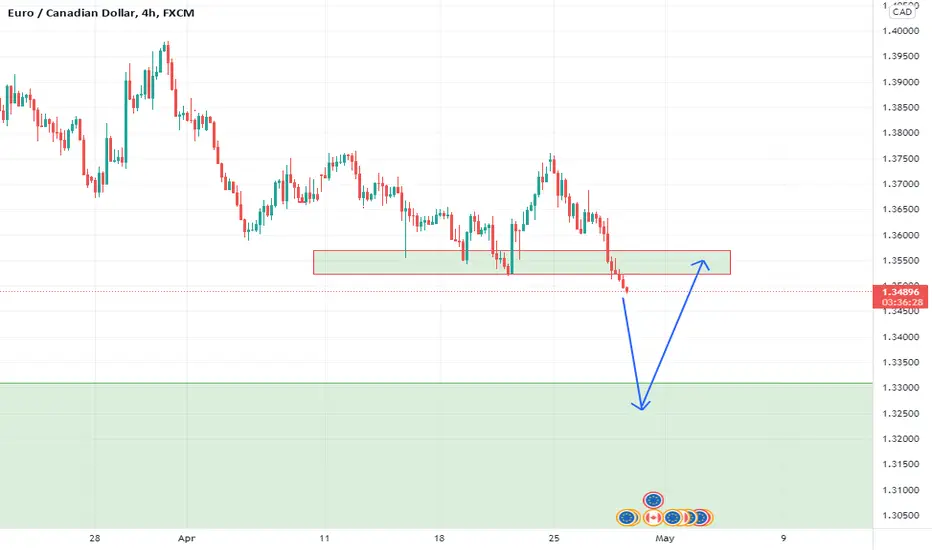
#EURCAD it's possible to buy#EURCAD waiting for retracement and Price trading in nearby 4hr support area and waiting for bullish candlesticks formed it will take entry for above the bullish candlestick and it will go for the next level of resistance
Why we like it:
Price is trading in nearby 4hr support area
Waiting for bullish candlesticks formed
possible to move the next resistance area
waiting for retracement
1st support:
1.32433
Next Zone area & horizontal swing Low support
1st Resistance
1.36020
Zone area & horizontal swing high resistance
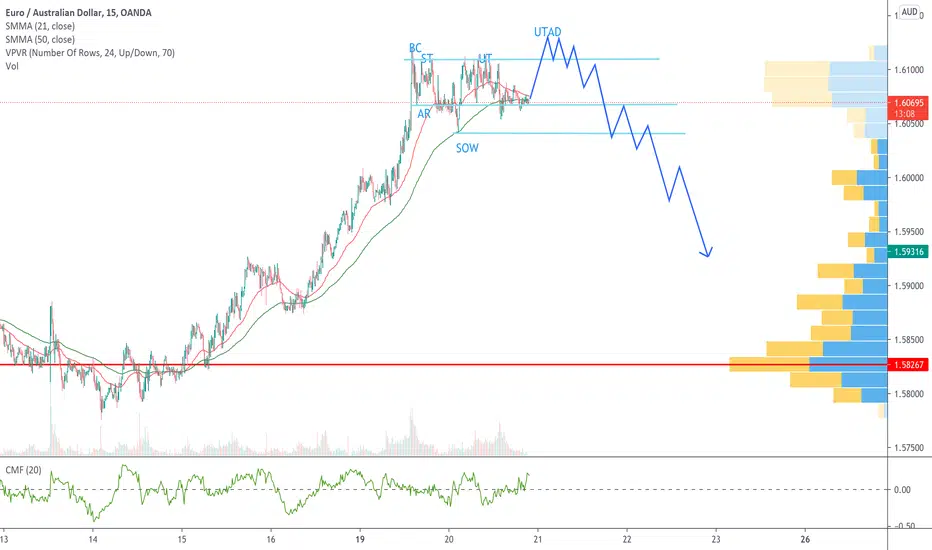
EURAUD WYCKOFF DISTRIBUTIONEURAUD looks to be in a Wyckoff Distribution pattern, awaiting UTAD formation to confirm sell bias. I would enter on a lower timeframe retest of the UTAD area using price action to confirm the sell.
EURAUD Setting up for a nice selling opportunity ?Hi Guys !
On the technical side, the EURAUD is setting up for a nice reversal to the downside. Based on that keep your eyes on 5min-15h timeframe for your sell setups. Try to catch your trade as high as it possible.
There is huge profit to be made (if this pair follows the script) and the trade has a nice reward – risk ratio.
Any strong break to the upside will invalidate the setup.
The Risk:
As trader, it is your job to mitigate the risk and only trade structures that provide high probability and great reward to risk ratios.
If you are not comfortable with this trade and your stop loss is to big for your trading account simply just skip it and wait for another one .
For analysing the chart and predicting the upcoming wave I use upgraded version of Wave Analysis. This strategy is easy to understand and it is totally without fundamentals ( Don't read the fundamentals it will confuse you). However if you don't over risk and follow the plan than there is noting to lose in this online business.
Trade with care !
Thanks for your support

EURAUD Short! Critical Levels 1.67479/1.67587/1.68292/ 1.69902 See next posts for zoom into these levels.
Like, Share, Follow, and Support this channel for yet better content.
Thank you and happy trading.

EUR/CAD : Strong Buy Trade SetupsGood time For the Buy uPside, I am Expecting one more upside MOve.
ThankYou

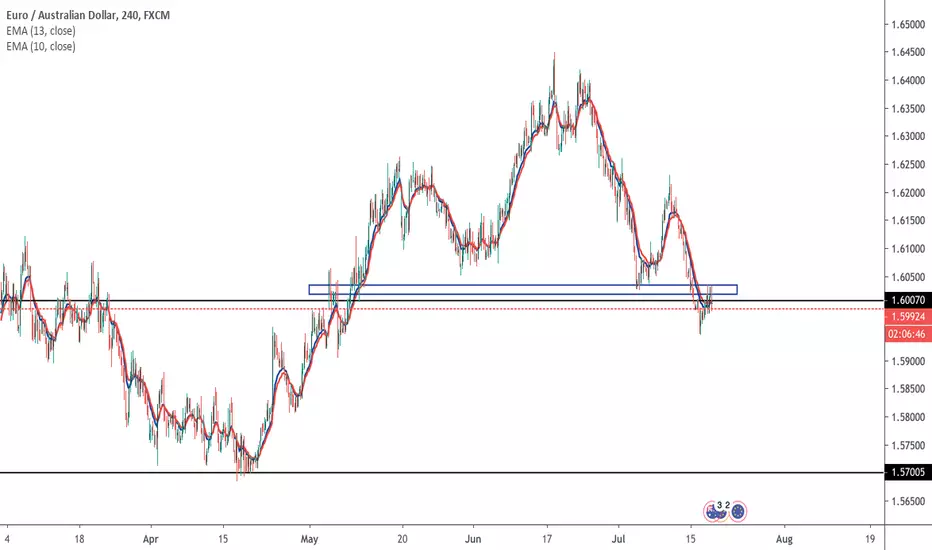
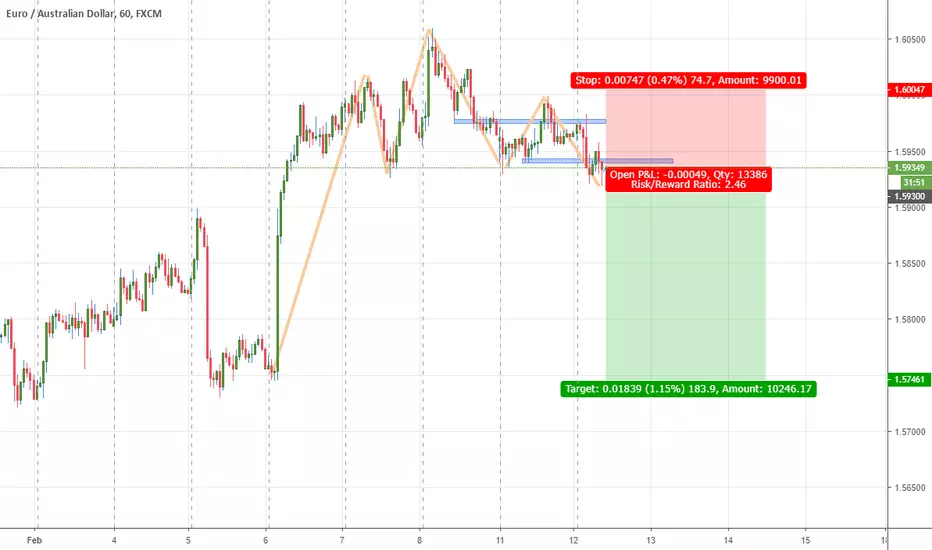
Head and Shoulders on EURAUD. Interesting situationI opened sell order on EURAUD on 1.5930 because i see head and shoulders pattern and 2 levels (blue squares) and 2 breakouts of this levels.
TP - 1.5745 SL - 1.6005 RRR - 2.46.
Sl near 74 pips so use lower trading volume. Good profit for all us!
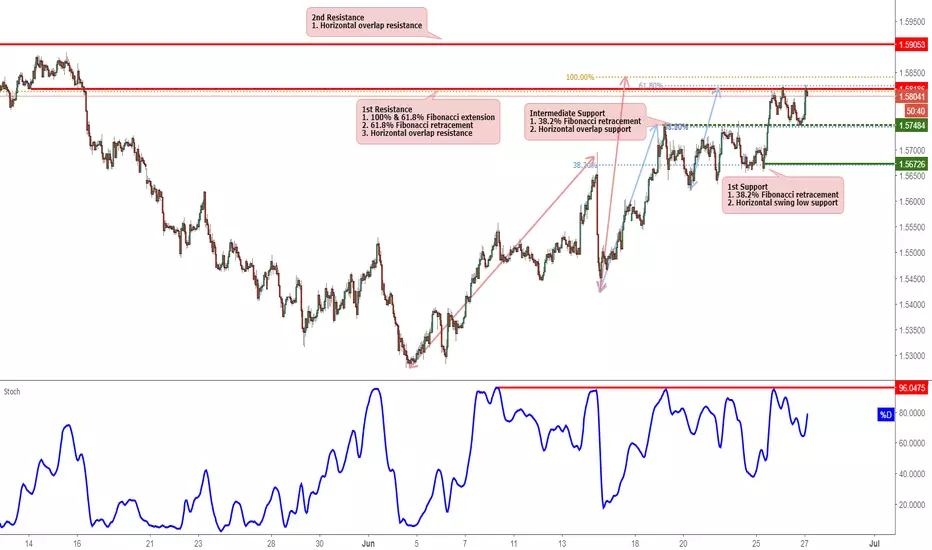
EURAUD Testing Resistance, Potential Reversal!EURAUD is testing its resistance at 1.5818 (100% & 61.8% Fibonacci extension, 61.8% Fibonacci retracement, horizontal overlap resistance) price could potentially react off, causing price to fall to its support at 1.5672 (38.2% Fibonacci retracement, horizontal swing low support). We do have to be cautious of the intermediate support at 1.5748 (61.8% Fibonacci extension, 50% Fibonacci retracement, horizontal overlap support).
Stochastic (89, 5, 3) is approaching resistance at 96% where a corresponding reversal could occur.