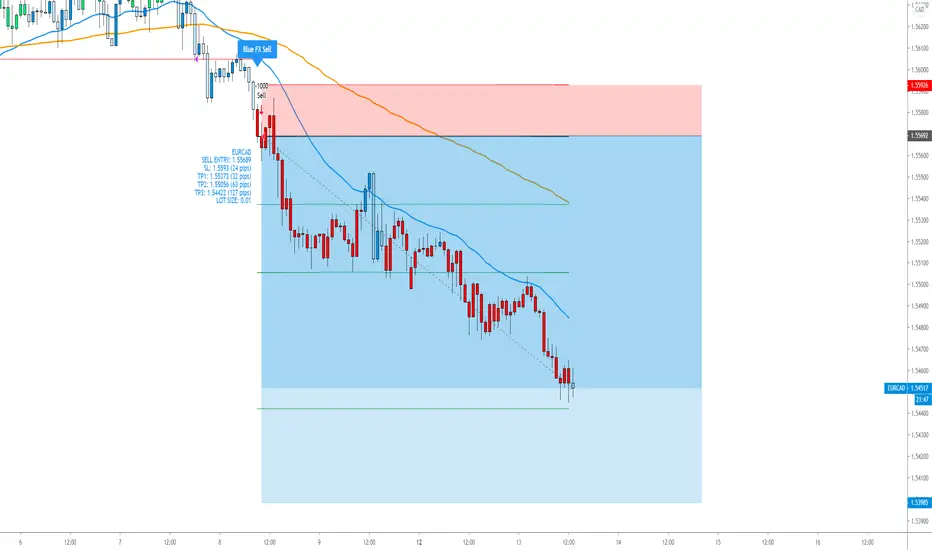
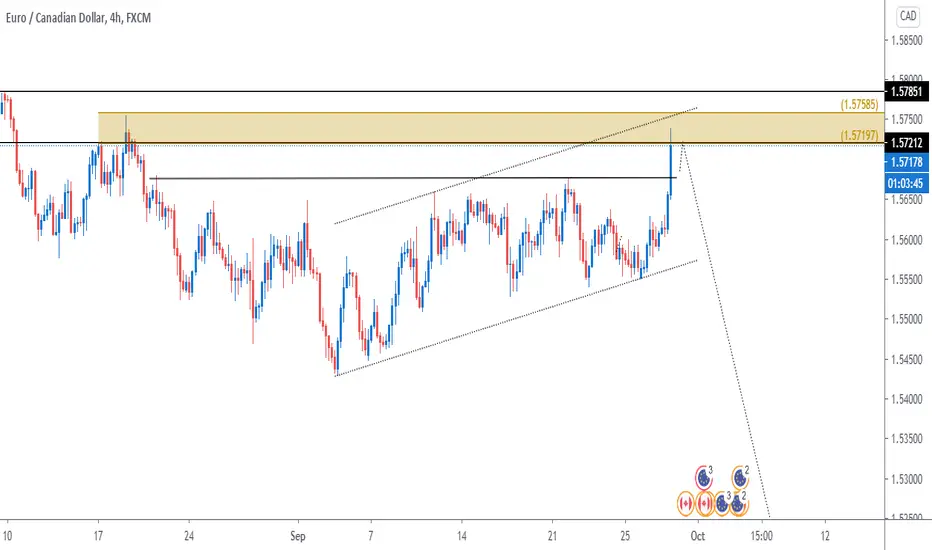
EURCAD - Running +7% on 1% riskEURCAD - Sell running in profit
The entry price, SL and multiple TPs are shown on the chart.
Our back testing and money management strategy itself is holding until a reverse signal to ride a big trend, but as you will not see the next signal - manage the trade as you wish should you decide to enter.
What is our strategy?
Our strategy is a trend following strategy, can be used on any instrument and time frame. However, we have hard coded specific parameters for when trading the H1 time frame, so we can back up over 4200 previous trades to confirm our edge from previous data. This gives us confidence in execution and belief in our trading strategy for the long term.
The strategy simply sits in your trading view, so you will see exactly what we see - the trade, entry price, SL and multiple TPs (although we hold until opposite trade as this is the most profitable longer term plan), lot size, etc.
This could be on your phone trading view app, or laptop of course.
The hard work is done, so we have zero chart work time, no analysis, no time front of the chart doing technical analysis - technical analysis is very subjective - you may see different things at different times - how do you have a rigid trading plan on a H&S shoulder pattern? Your daily routine, diet, sleep, exercise can affect what you 'see' and your decision making, this doesn't happen when a strategy is coded like this; what we do have is a mechanical trading strategy...
What does this mean?
It means, we are very clear on our entry and our exit and use strict risk management (this is built in - put in your account size, set your risk in % or fixed amount and it will tell you what lot size to trade!) so we have no ego with our position and we are comfortable with all outcomes - its simply just another trade. This free's our mindset from worry and anxiety as we take confidence from knowing our edge is there and also that we have used sensible risk management.
The strategy itself can be used as a live trading journal too - how cool is that? The strategy will confirm and support every open and closed position - so its quite easy to follow.
We just have to do what Percy does.
Please see our related ideas below for more information to explain what we do and how it can help you.
Eurcadshort

EURCAD BEARISH ANALYSISHello Traders, here is the full analysis for this pair, let me know in the comment section below if you have any questions, the entry will be taken only if all rules of the strategies will be satisfied. I suggest you keep this pair on your watchlist and see if the rules of your strategy are satisfied

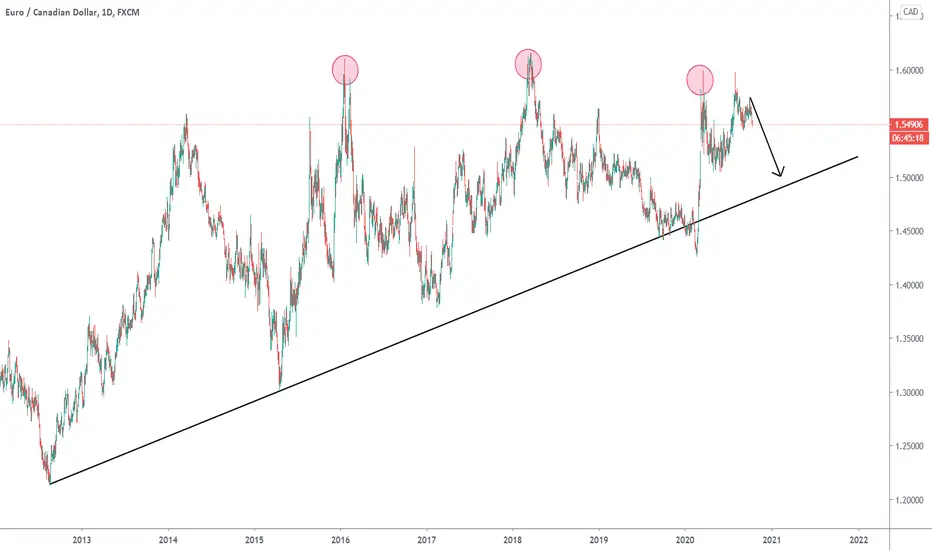
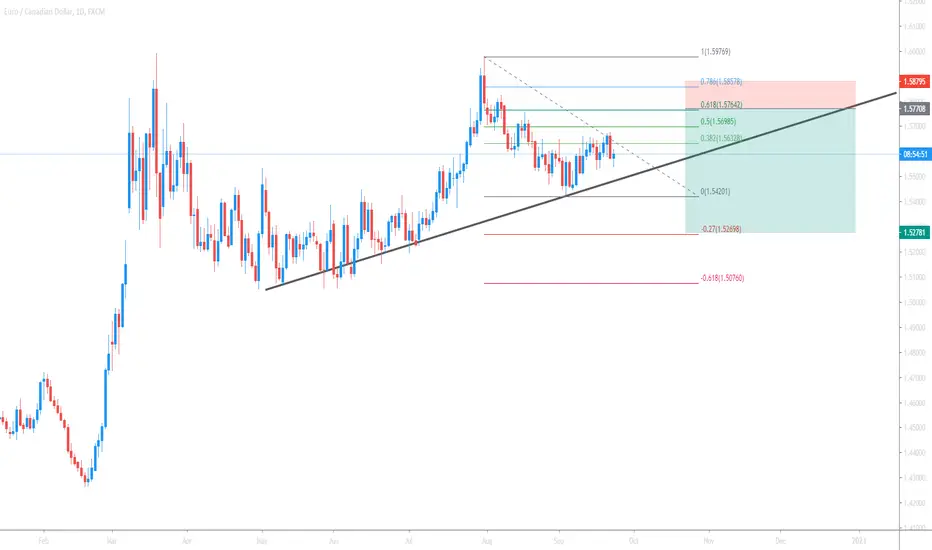
EURCAD AnalysisMy overall bias on EURCAD is bearish. After a bearish impulse I am now expecting a retracement to test the 61.8 fib level.
There is also a bullish divergence on a lower timeframe which may be the catalyst for the retracement. I am looking for price to make a retracement before then a bearish continuation. I am expecting price to make it's third touch of the trendline.
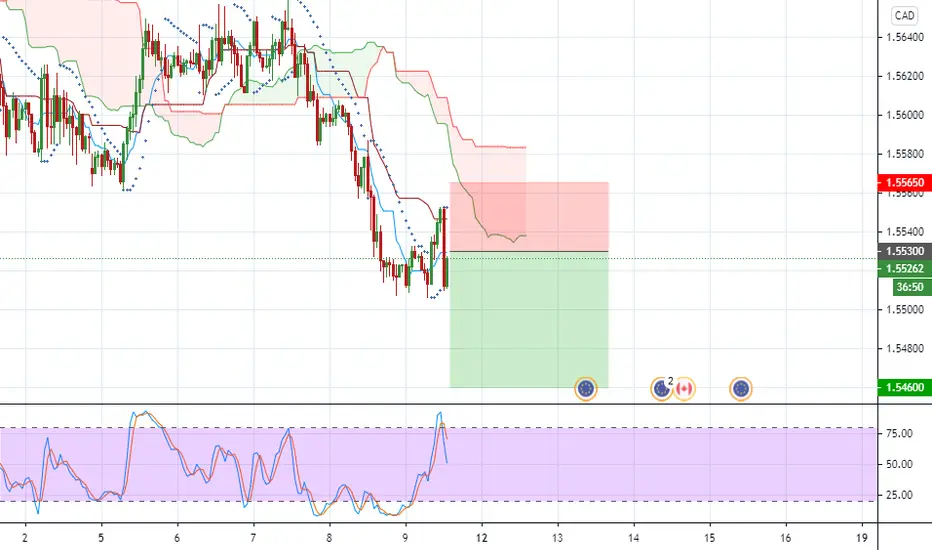
EURCAD, 1hr tf, sell below kumo cloudHello my friends,
Another trade to take for today is this EURCAD pairs.
The setup looks like EURAUD and i am gonna take a sell position as well.
All the requirement for selling this pair are also met on the 1hr chart so we will sell on a retracement of last 1hr candle close.
Sell EURCAD 1.5530
Stop loss 1.5565
Take profit 1 @1.5495
Take profit 2 @1.5460
RR Ratio is 1 : 2
Use only 1-2% risk
Good luck

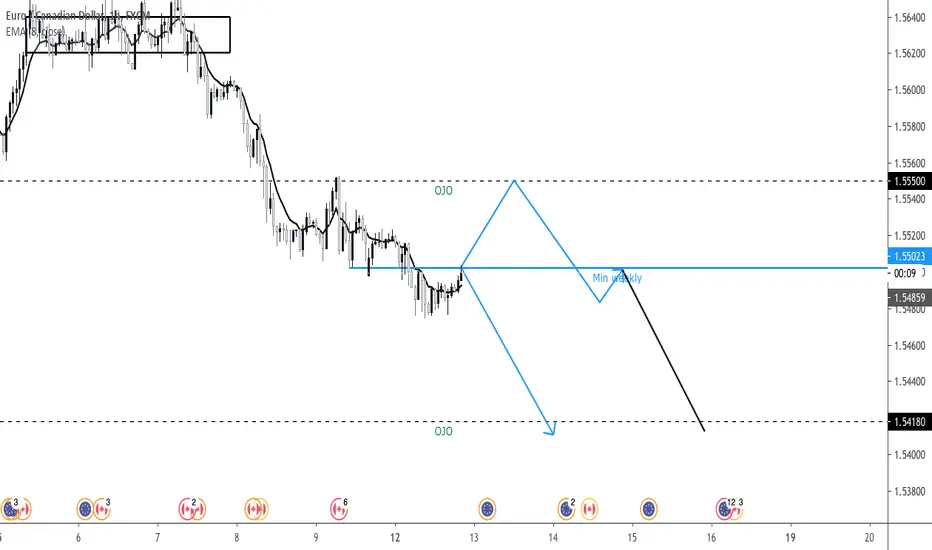
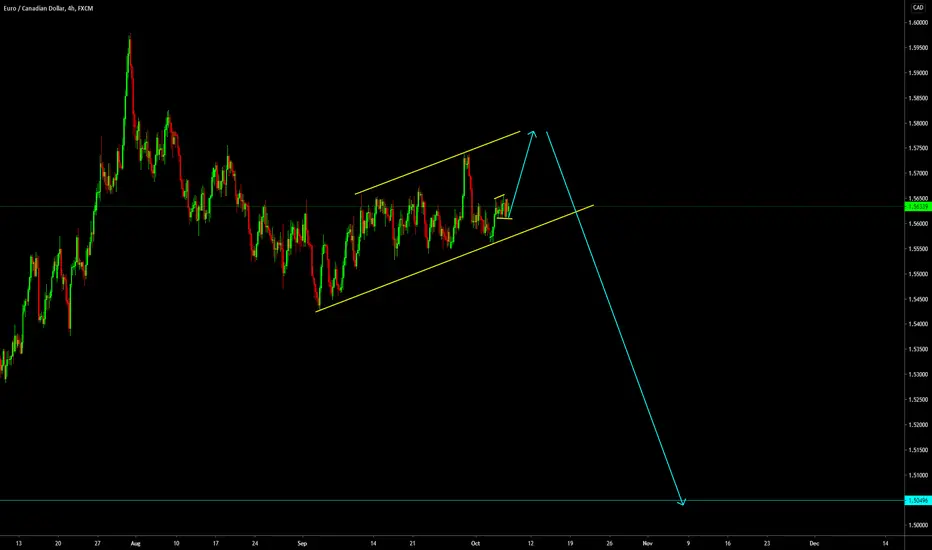
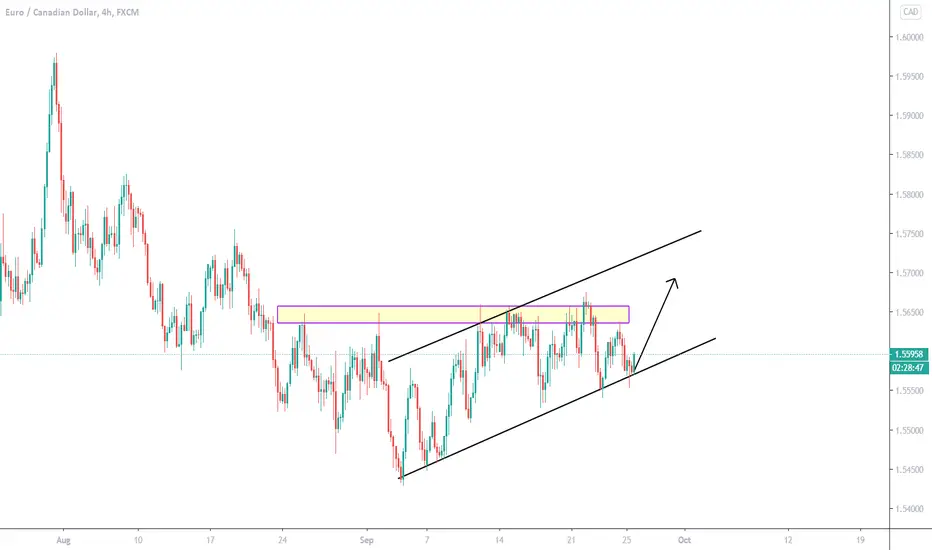
EURCAD One more buy before bigger sell?Hi traders,
Keep an eye there for short term buy setup then we have to watch for sell setups.
If the price will drop down earlier watch for continuation to the downside.
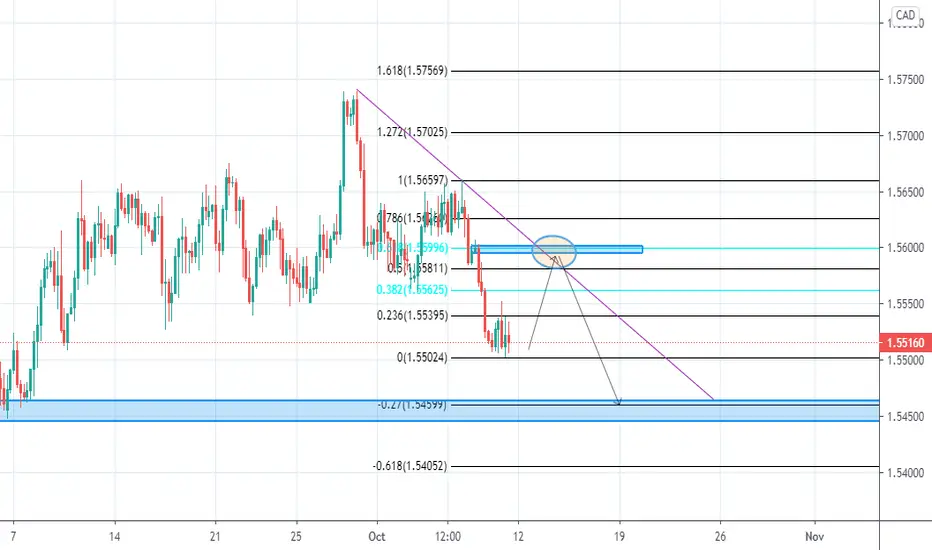
EURCAD quick intradayThe price has rejected the resistance line once again, from this point we can open a sell position and set our target profit at around 1.55800 area
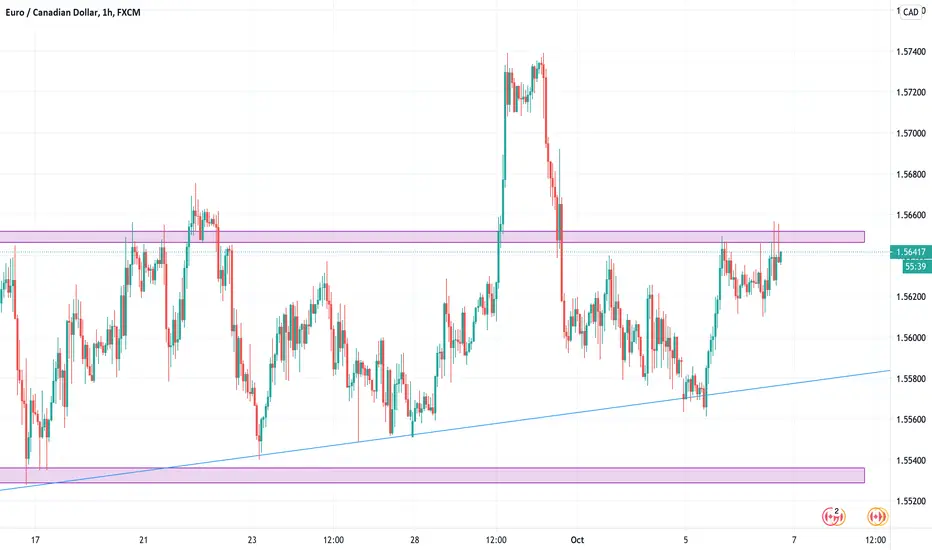
Two roads for #EURCADThere are two roads for EURCAD this week, the closest way is with the support that is the lowest level from last week. And the longest one could be to the resistance which is the last week's highest price.

YOO LETS MAKES THIS MONEY EASY DOLLAZ $$<>Hey there Im really going bearish here like if you agree send me your analysis if you like Have a GOOD one <>
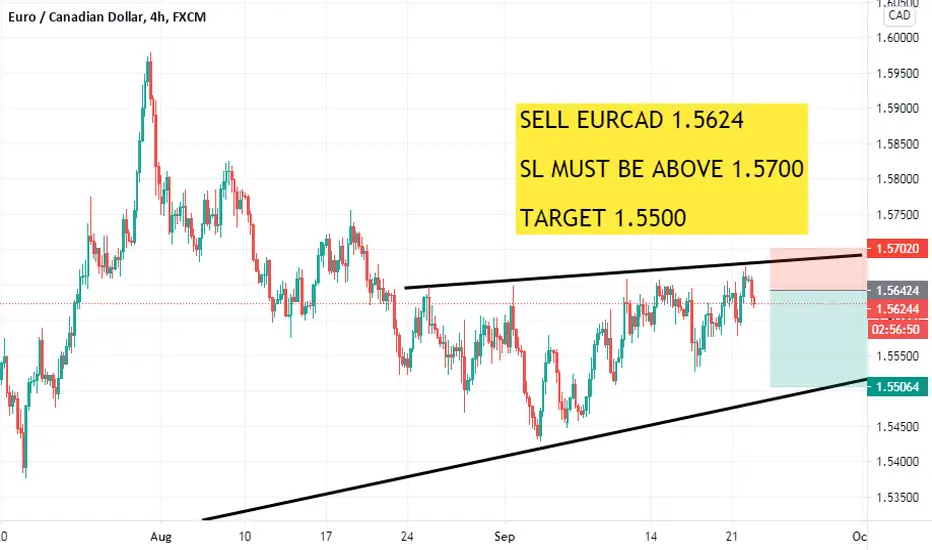
EURCAD Sell OpportunityHi traders, in this setup I am looking for a selling opportunities in this zone

EURCAD, 2hr tf, head and shoulders pattern to materializedHello my friends,
Today trade ideas gonna be EURCAD pair.
This pair currenly moving sideways but if you look it closely, there is a shoulders head pattern forming right now.
Price also already broken below the neckline so i am gonna take a sell position with ichimoku confirmation.
1st confirmation is price below the kumo cloud
2nd confirmation is kumo cloud color are red
3rd confirmation parabolic SAR now above the price indicating sell pressure
Sell EURCAD 1.5600
Stop loss 1.5645
Take profit 1 @1.5555
Take profit 2 @1.5510
Take profit 3 @1.5465
RR Ratio 1 : 3
Use only 1-2% risk
Good luck


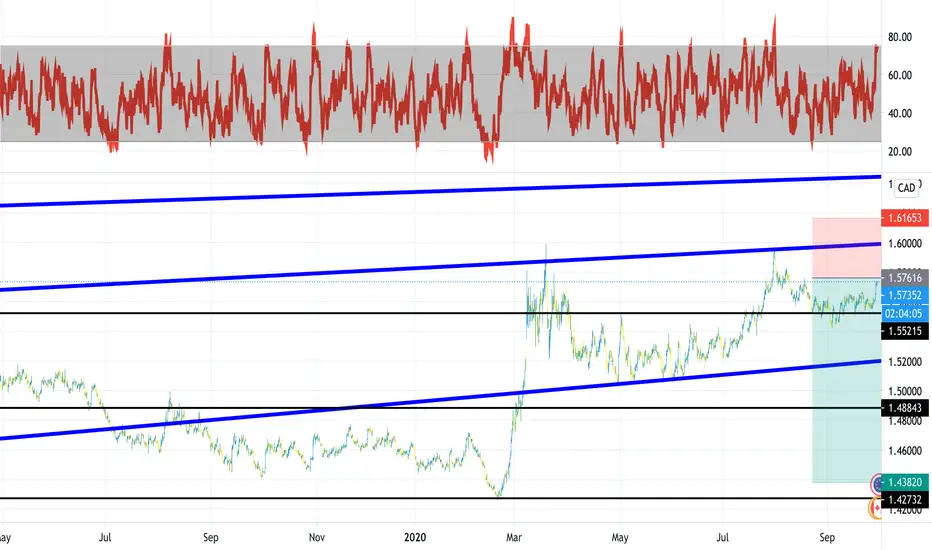
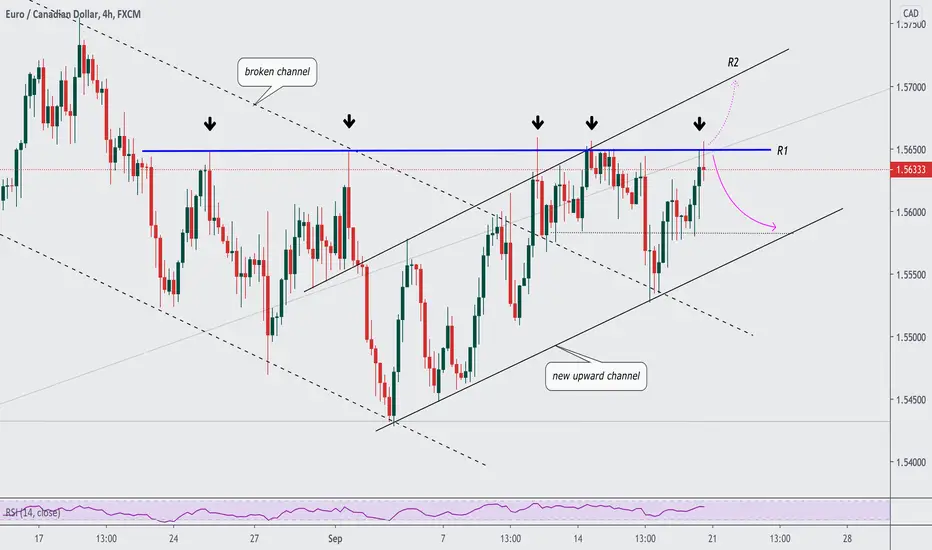
EUR_CAD STRUCTURE ANALYSIS|
EUR_CAD IS TRADING IN A CHANNEL, FACES HORIZONTAL RESISTANCE.
(1) The pair modestly bullish, after breakout from downward channel
(2) Horizontal resistance seems to be well respected
(3) Good chance it might sink to retest channel support.
(4) IF breaks out higher-wait for confirmation.
(next upward resistance is R2 of a channel)
____________________________________________________
LIKE and SUBSCRIBE for LULZZ!
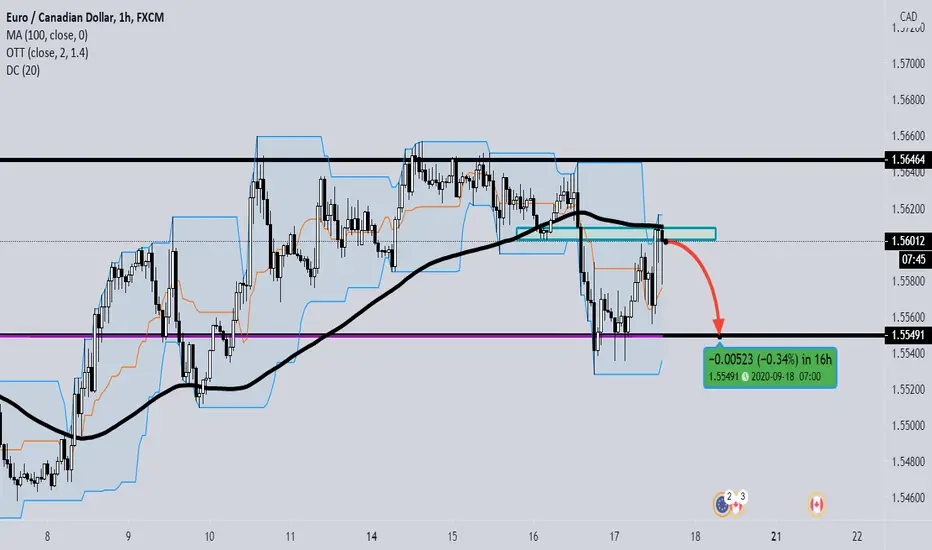
EURCAD - BEARISH BIASEUR - BEARISH
1️⃣ The Eurozone consumer prices dropped 0.2% from a year earlier in August 2020, the first decline since May 2016.
CAD - BULLISH
1️⃣ WTI crude futures rebounded slightly to trade above $40 per barrel on Thursday, as investor focus shifted to an OPEC+ meeting later.
2️⃣ Expect positive retail sales tomorrow due to stronger labor data in July.
=====
TECHNICAL
=====
- We're shorting this pair on SBR level + SMA100 area on H1 chart.
- EURCAD in bearish zone.
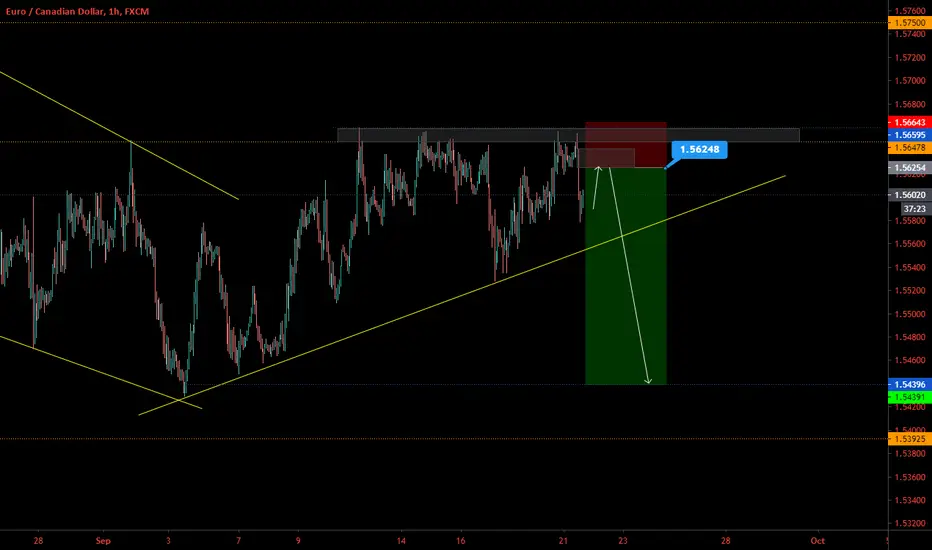
Short Setup on Pullback-Ascending TL breakout, retest and continuation expected
-0.5 fib retracement
-Strong area of S&R
-MA50
