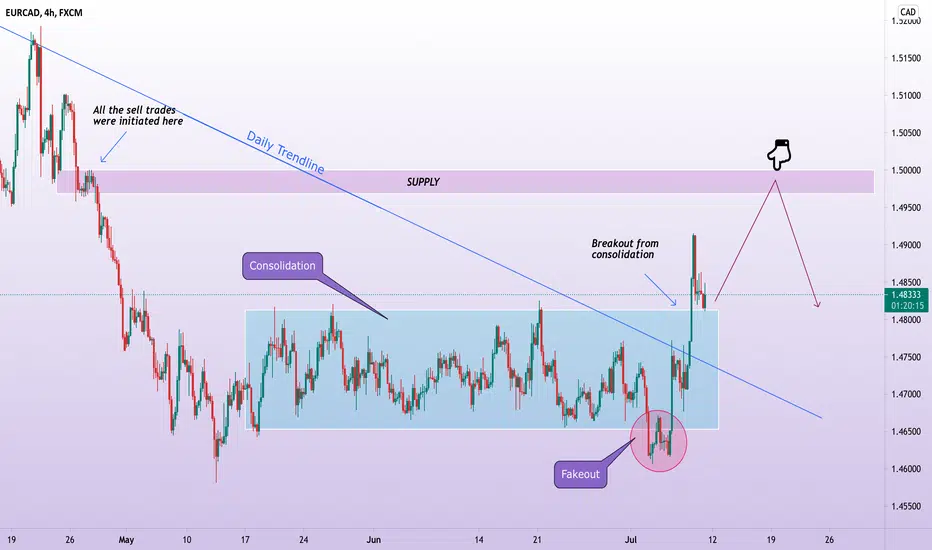
EURCAD, a change of trend??EURCAD was consolidating between 1.4650 & 1.48. Yesterday this pair broke from the consolidation stage with a big bullish engulfing candle which leaves more room to the upside. This pair clearly broke above daily trendline which gives us another signal that it may rise for a while. However, I will be expecting a bounce near the supply area 1.50 that i've pointed. My bias is bullish until it breaks any uptrend structure in lower timeframe.
Eurcadsignal
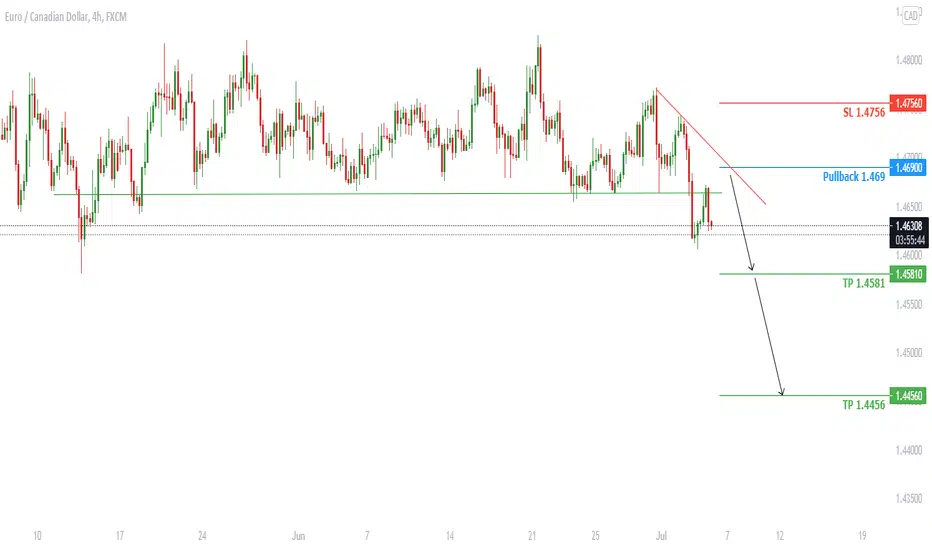
EURCAD Has Broken Below Support
Welcome back Traders, Investors, and Community!
Hi Traders, EURCAD on H4 has broken below the Support line and has already done the retest, got rejected with a large red candle. It's expected to go lower to 1.4581
⬇️Sell now or Sell at 1.469
⭕️SL @ 1.4756
✅TP1 @ 1.4581
✅TP2 @ 1.4456
We will have more FREE forecasts in TradingView soon
❤️ Your Support is really appreciated!❤️
Have a Profitable Day
EURCAD Bull Start SoonWe expect EURCAD to move forward upside as it's consolidating a major support area last couple of weeks. Also, the Eurozone covid situation is under control, and most of the tourist spots will open soon.

EURCAD Seems to me Bulish Run Ahead!EURCAD daily time frame I can see it will create a W shape pattern and recover its gaining. On the other hand, we can also check the ABC pattern clearly. I'm expecting a strong Bull run.


EUR/CAD Multi-Time frame analysisHi Traders
EUR/CAD Multi-Timeframe analysis
H1 Chart (Bearish)
A medium probability, entry signal to go SHORT will be given after the completion of a bearish trend reversal on the lower time frame at 1.46867 after the market found resistance at 1.47157 . Only the upward break of 1.47157 would cancel the bearish scenario.
Support & Resistance
1.46686 1.47146
1.46415 1.47270
1.45955 1.47431
H4 Chart (Bullish)
The completion of a trend reversal formation at 1.47288 has forced us to close our position earlier than we had planned. Now we are looking for the next opportunity to enter the market.
Support & Resistance
1.47410 1.47757
1.46415 1.47997
1.45810 1.48992
Daily Chart (Bearish)
The completion of a trend reversal formation at 1.47607 has forced us to close our position earlier than we had planned. Now we are looking for the next opportunity to enter the market.
Support & Resistance
1.47237 1.48156
1.45810 1.52092
1.44426 1.53833
Weekly Chart (Strong Up)
Waiting for a retracement higher towards the 1.47237 resistance level in order to reinstate SHORT positions. Next important resistance is the 1.50518 level.
Support & Resistance
1.45810 1.47237
1.44478 1.50518
1.42626 1.51914

EURCAD - BUY to the targetOne more Drop to the 0.5
then BUY to the 0.618 target
LIKE - COMMENT - SHARE , the best analysis on the tradingview
I NEED YOU SUPPORT TO GROW!

EUR/CAD Multi-Timeframe analysis (03/02)Hi Traders
EUR/CAD Multi-Timeframe analysis (03/02)
H1 Chart (Bearish)
Target 2 at 1.52525 has been reached. We closed the remaining 50% of our position and now we are looking for the next opportunity to enter the market.
Support & Resistance
1.53327 1.53548
1.53030 1.53833
1.52898 1.53965
H4 Chart (Strong UP)
The market is approaching the support at 1.52821 . We are waiting to see reversal signals in order to reinstate LONG positions. Next important support is the 1.52619 level.
Support & Resistance
1.52821 1.53124
1.52619 1.53498
1.52092 1.53833
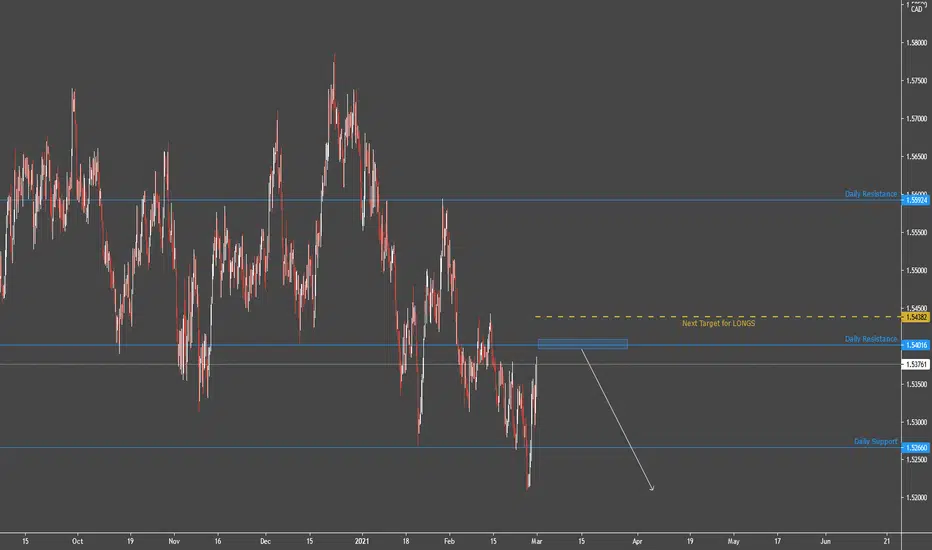
Daily Chart (Strong Down)
The market is approaching the resistance at 1.54016 . We are waiting to see reversal signals in order to reinstate SHORT positions. Next important resistance is the 1.55924 level.
Support & Resistance
1.52666 1.54016
1.52092 1.55924
1.51065 1.57096
Weekly Chart (Neutral)
The market is dominated by uncertainty. The occasionally prevailing trend lasts for a limited time and changes its direction too frequently. As long as the market remains unstable, we stay aside, waiting for the market to get back on track.
Support & Resistance
1.52666 1.59912
1.50518 1.62060
1.47707 1.64871
EUR/CAD Multi-Timeframe analysis (Update)Hi Traders
EUR/CAD Multi-Timeframe analysis (Update)
H1 CHART ( Bullish )
A medium probability, entry signal to go LONG was given at 1.53623 after the market found support at 1.53317 . Only the downward break of 1.53317 would cancel the bullish scenario.
Support & Resistances
1.53328 1.53548
1.53030 1.53735
1.52898 1.53975
H4 CHART ( Neutral )
Conflicting technical signals are indicating towards an unstable market, cautioning us to remain neutral and wait for a stronger trend to develop.
Support & Resistances
1.53124 1.53498
1.52619 1.53782
1.52092 1.54414
DAILY CHART ( Strong Down )
Waiting for a retracement higher towards the 1.52666 resistance level in order to reinstate SHORT positions. Next important resistance is the 1.54016 level.
Support & Resistances
1.52660 1.52666
1.50744 1.54016
1.47486 1.55924
WEEKLY CHART ( NEUTRAL )
The market is dominated by uncertainty. The occasionally prevailing trend lasts for a limited time and changes its direction too frequently. As long as the market remains unstable, we stay aside, waiting for the market to get back on track.
Support & Resistances
1.52666 1.59912
1.50518 1.62060
1.47707 1.64871
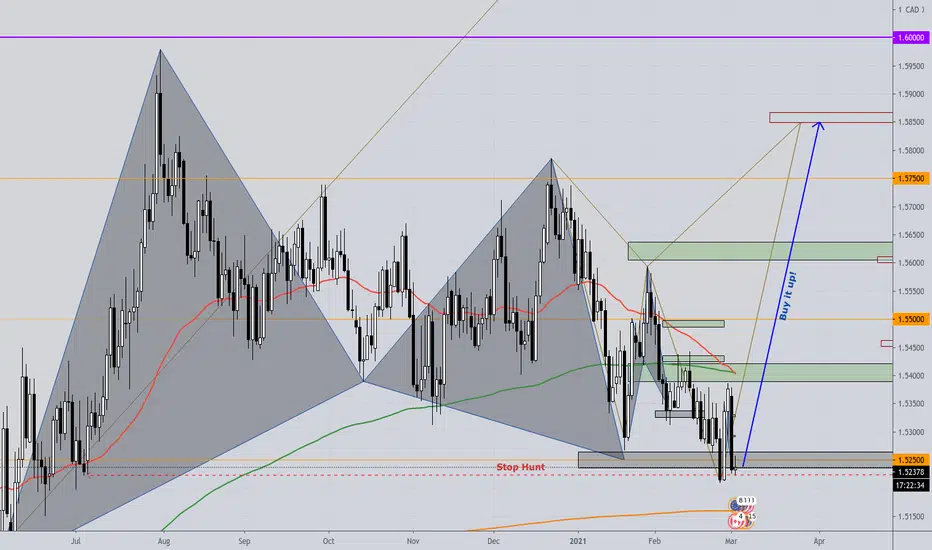
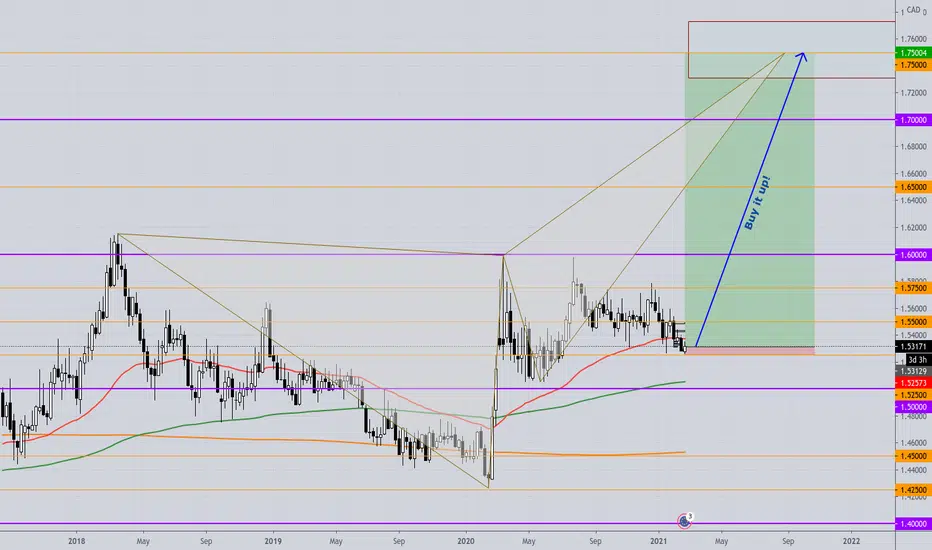
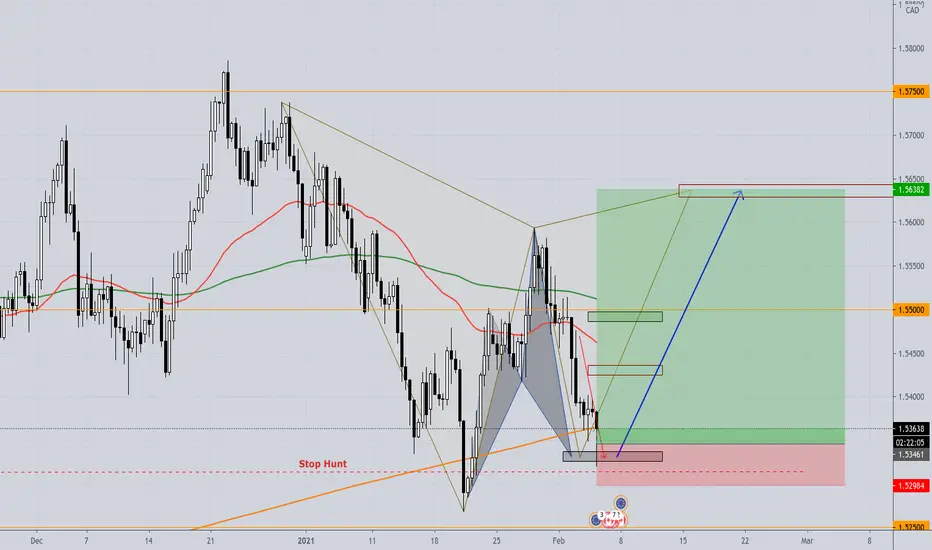
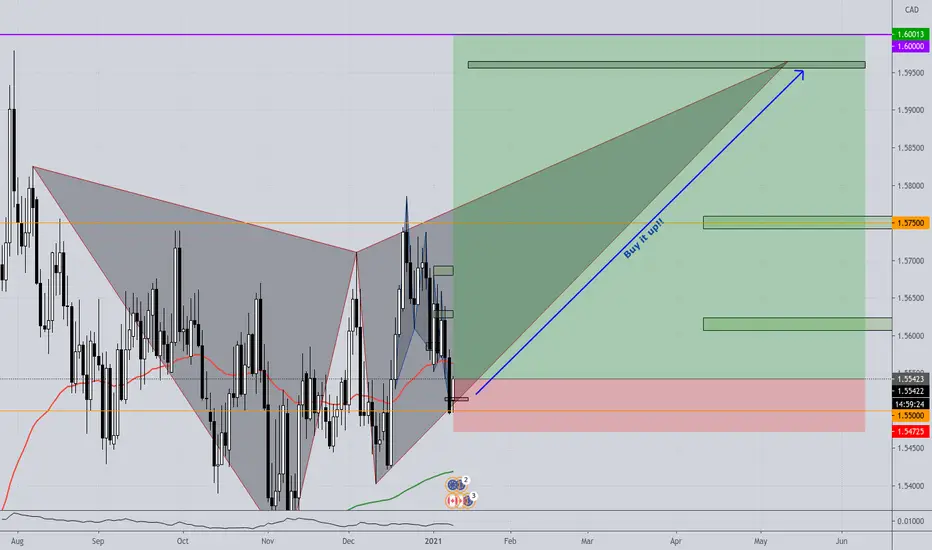
EURCAD - LONG; Buy it up!!Like the title says.
While the EU still maintains a positive account balance, the BoC couldn't steal, print or borrow and other dime (not even a Canadian one), even if their life depended on it.
Here is the Daily;
ERUCAD | Perspective for the new weekBagged 320pips in our direction before the rally began in my last speculation on this pair (see link below).
Despite an overall Bullish perspective for the Euro, most of the new year has seen price hustling below CA$1.55400, a feat showing less confidence in the Euro. The unattractive net change in unemployment rate released last week mirrors a negative implication for consumer spending which has an adverse effect on economic growth making the Canadian Dollar less attractive too. This explains the indecisive pattern represented on the chart (parallel channel) but following the positive figures coming out of economic release last week for the Euro, a promising future for the Euro over CAD in the coming if the price does not break below CA$1.52500 (completing a Double Bottom structure) appears to be feasible.
Tendency: Uptrend ( Bullish )
Structure: Reversal pattern (Double Bottom) | Supply & Demand
Observation: i. Characterized by an indecisive pattern since mid last year, the price has been caught within a range with no clear sign of a rally or decline.
ii. This been said, it appears we still can make a trading decision based on certain setup seen on the chart.
iii. A possible formation of a Double Bottom is unfolding if price did not break below demand zone @ CA$1.52500 in the coming week(s).
iv. It is advisable to be very conservative at this juncture for a long position can only be really confirmed if price breaks above the Neckline @ CA$1.55400 (outright buy or buy from correction).
v. It is worthy to note here that, any significant Breakdown of demand zone @ CA$1.52500 shall consider this bias invalid... Trade consciously!
vi. A significant Breakdown of demand zone @ CA$1.52500 might see price head for CA$1.49000 area before the rally begins.
Trading plan: BUY confirmation with a minimum potential profit of 300 pips.
Risk/Reward : 1:3
Potential Duration: 5 to 10 days
NB: This speculation can be considered to make decisions on lower timeframes.
Watch this space for updates as price action is been monitored.
Risk Disclaimer:
Margin trading in the foreign exchange market (including foreign exchange trading, CFDs, etc.) has a high risk and is not suitable for all investors. The content of this speculation (including all data) is organized and published by me for the sole purpose of education and assistance in making independent investment decisions. All information herein is for your reference only and I take no responsibility.
You are hereby advised to carefully consider your investment experience, financial situation, investment objective, risk tolerance level, and consult your independent financial adviser as to the suitability of your situation prior to making any investment.
I do not guarantee its accuracy and is not liable for any loss or damage which may result directly or indirectly from such content or the receipt of any instruction or notification therewith.
Past performance is not necessarily indicative of future results.

EUR/CAD Multi-Timeframe analysisHi Traders
EUR/CAD Multi-Timeframe analysis
H1 CHART ( BEARISH )
Waiting for a retracement higher towards the 1.53175 resistance level in order to reinstate SHORT positions. Next important resistance is the 1.53780 level.
Support & Resistances
1.52790 1.53175
1.52213 1.53780
1.51227 1.54766
H4 CHART ( BEARISH )
A medium high probability, entry signal to go SHORT was given at 1.53151 after the market found resistance at 1.53804 . Only the upward break of 1.53804 would cancel the bearish scenario.
Support & Resistances
1.53120 1.53782
1.52821 1.54414
1.52255 1.54980
DAILY CHART ( NEUTRAL )
The market is dominated by uncertainty. The occasionally prevailing trend lasts for a limited time and changes its direction too frequently. As long as the market remains unstable, we stay aside, waiting for the market to get back on track.
Support & Resistances
1.52666 1.54016
1.50744 1.55924
1.47486 1.57096
WEEKLY CHART ( NEUTRAL )
The market is dominated by uncertainty. The occasionally prevailing trend lasts for a limited time and changes its direction too frequently. As long as the market remains unstable, we stay aside, waiting for the market to get back on track.
Support & Resistances
1.52666 1.59912
1.50518 1.62060
1.47707 1.64871

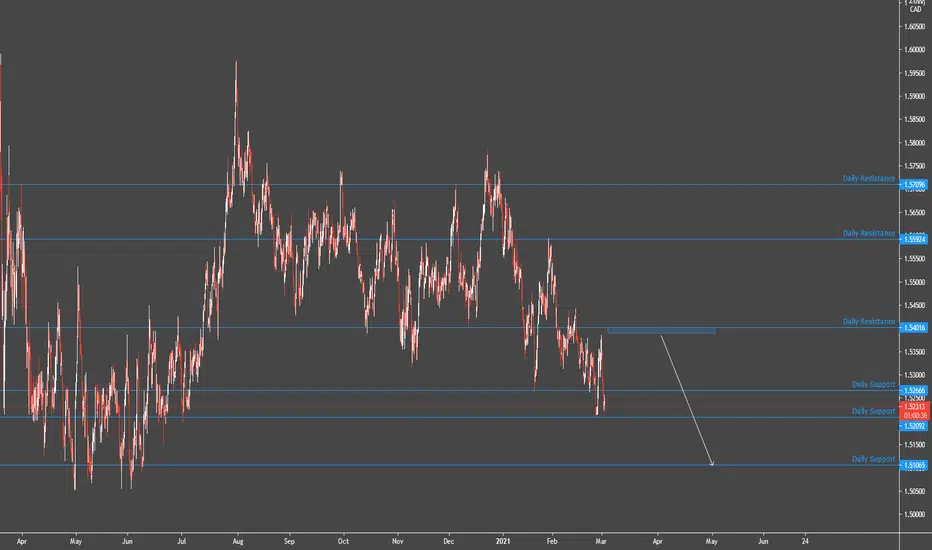
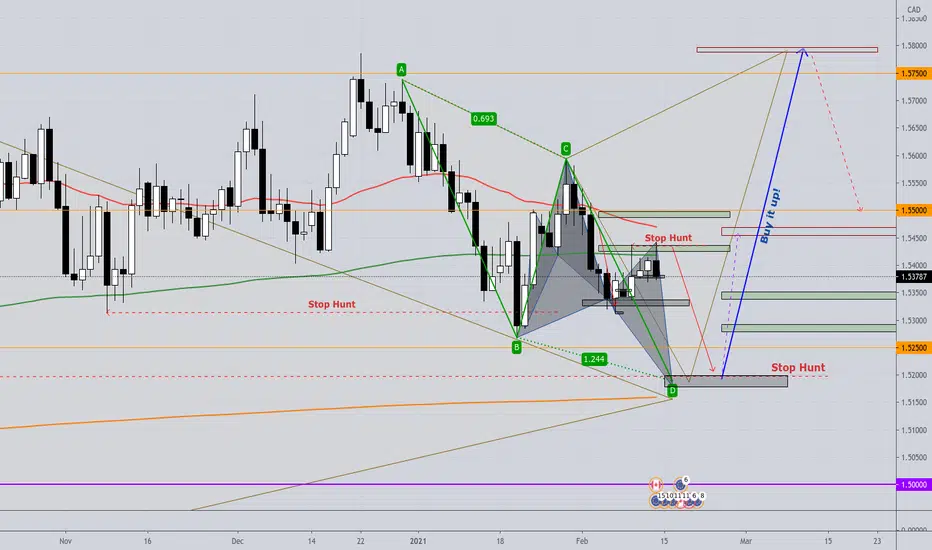
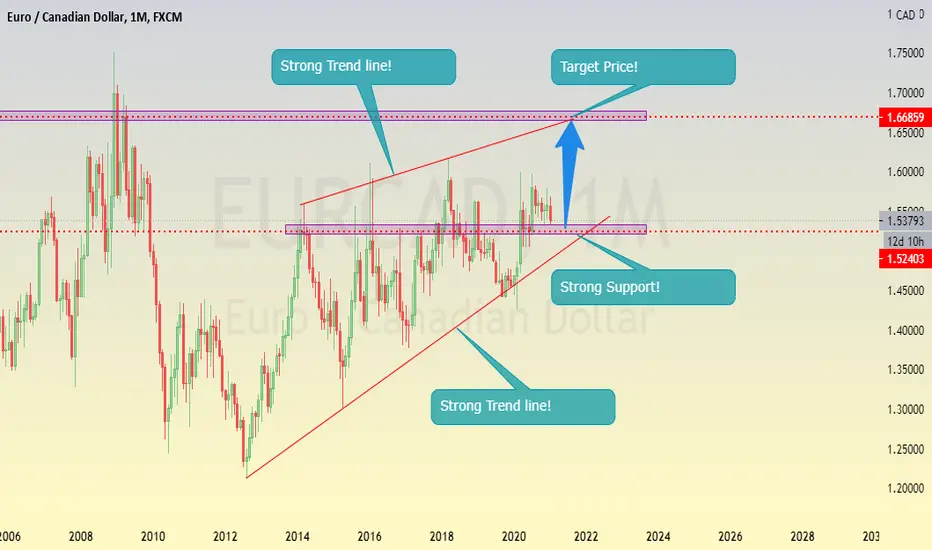
EURCAD - SHORT; Right here, it's still a short ...... But we'll be BUYing up that Stop Hunt like there was no tomorrow!!
Here is the Weekly;
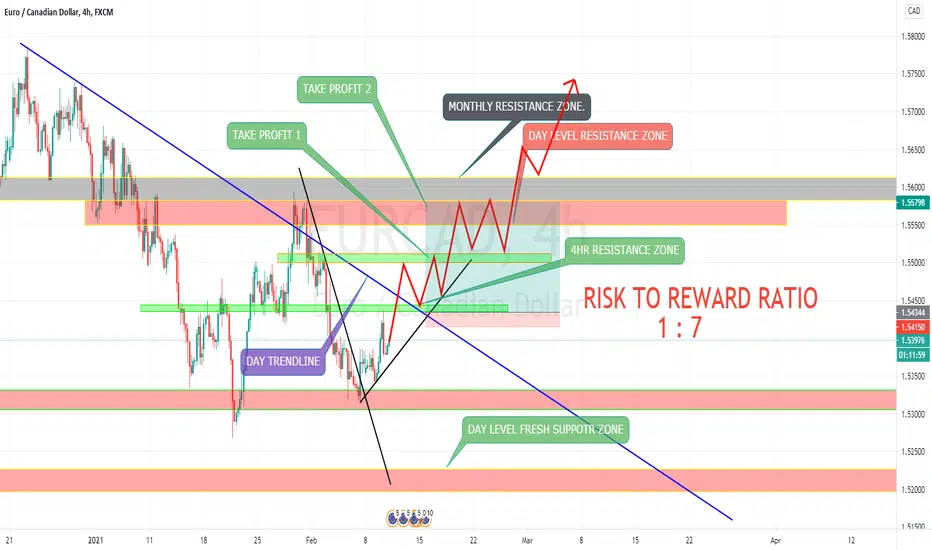
EURCAD 4HR LONG SETUPEURCAD 4HR :
EURCAD after crossing 4hr Trendline Price Currently moving towards Day Level Resistance Zone.
If it crosses resistance zone and day trendline ..Wait for Retest and then Go LONG..
EURCAD price testing monthly support may rise for 1.5490 & 1.553Eur 13k long positions increased by professionals by last week, Commercials increased shorts 14k by last week. Eur long% increased 3% by last week. Professionals increased 2k shorts in Canadian, while Commercials increased 4k shorts in this week.
Price making lower low and lower high on daily time frame. but due to support around 1.5380-36 may suspect correction upside.

EURCAD, Retesting Support, LongEURCAD, Retesting Support and continue Bullish uptrend! Trade when the Price action Tells!
EURCAD: Diagonal pattern in the weekly chartEURCAD: Diagonal pattern in the weekly chart, Triangle pattern in the daily chart
( Weekly Chart )
In the weekly chart, the largest waves have a triple structure, so monitoring the charts shows the end of the chart is in a form of 3-wave pattern that starts from the range of 1.2129. According to these explanations, the price is forming an Ending Diagonal pattern in this time frame. In continuation, we will study the daily chart and the details of the movement.
( Daily Chart )
In the daily chart, the price is in the final wave of the Diagonal pattern, of which the B wave is forming the triangle pattern, and the movement is terminating. The uptrend formation and the end of the Triangle pattern can be confirmed by crossing the price from the range of 1.5785.
But the main point can be seen in the 240-minute chart, in this chart at the end of the E wave the Diagonal pattern is being formed. By crossing the price from the range of 1.5600 we can get the early confirmation to enter the completion of the Triangle pattern with targets of 1.6250 to 1.6300.

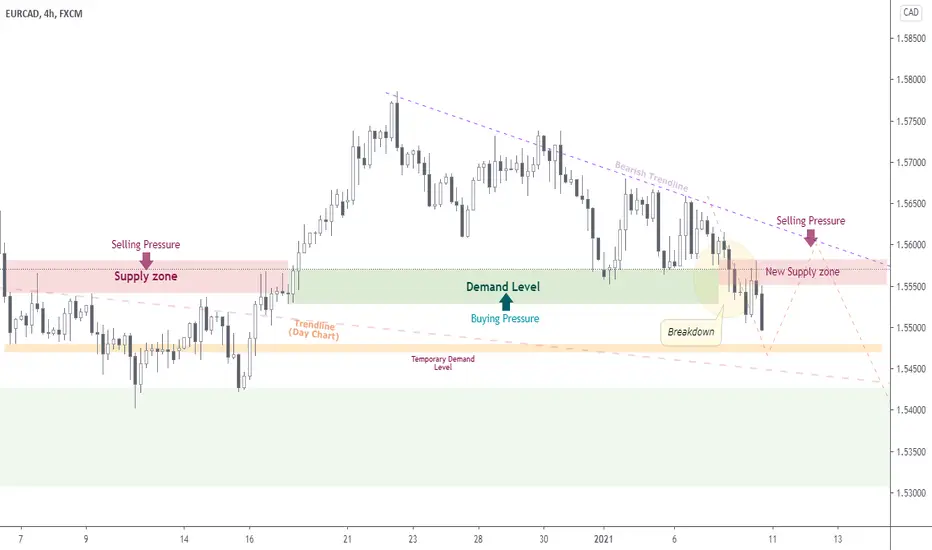
EURCAD | Perspective for the new weekWe experienced 230pips run in our direction on my last publication (see link below for reference purposes) on this pair with another trading opportunity building up again!
It is very interesting to observe that the market has continuously made its decision around the CA$1.55700 level since July 2020 which tells me that we can be confident to find a quick trading opportunity on this one!
Tendency: Downtrend ( Bearish )
Structure: Breakdown | Supply & Demand | Trendline
Observation: i. Since on the 22nd of Dec 2020, the price has found Lower lows respecting the Bearish trendline that led to the recent Breakdown of CA$1.55700 followed by a sharp rejection of this level last week.
ii. Considering the significance of our key level; The leg that broke down CA$1.55700 might experience correction back into this level for a decline continuation in the coming week.
iii. In this regard, I shall be looking for a significant level around the Key level/Trendline to find a safe haven for a selling opportunity this week.
iv. Lest I forget, I am looking forward to seeing buyers do quick activities around CA$1.5470 level after which selling opportunity will surface... Be patient :)
Trading plan: SELL confirmation with a minimum potential profit of 220 pips.
Risk/Reward : 1:4
Potential Duration: 2 to 5 days
NB: This speculation can be considered to make decisions on lower timeframes.
Watch this space for updates as price action is been monitored.
Risk Disclaimer:
Margin trading in the foreign exchange market (including foreign exchange trading, CFDs, etc.) has a high risk and is not suitable for all investors. The content of this speculation (including all data) is organized and published by me for the sole purpose of education and assistance in making independent investment decisions. All information herein is for your reference only and I take no responsibility.
You are hereby advised to carefully consider your investment experience, financial situation, investment objective, risk tolerance level, and consult your independent financial adviser as to the suitability of your situation prior to making any investment.
I do not guarantee its accuracy and is not liable for any loss or damage which may result directly or indirectly from such content or the receipt of any instruction or notification therewith.
Past performance is not necessarily indicative of future results.
EURCAD I WISH EVERYONE COULD EAT THE PIPS WITH ME From the Daily time frame perspective EURCAD is ready to go LONG
Don't forget to like and follow us
