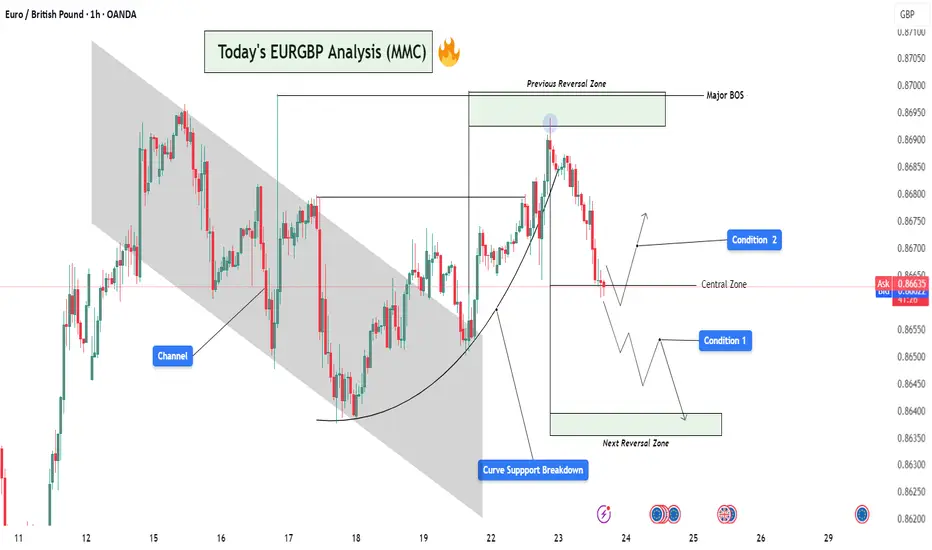
EURGBP Analysis : Curve Breakdown + Directional Setup + Target🧠 Institutional Context & Smart Money Bias
This EURGBP chart offers a masterclass in engineered liquidity and market traps. Institutions have created an illusion of bullish strength through:
A manipulated rounded accumulation curve
A controlled channel phase
A false breakout above the reversal zone
These are textbook signals that the retail crowd is being misled, while smart money is preparing for a deeper move. Let’s dissect it step by step.
📊 Phase-by-Phase Technical Breakdown
🔻 1. Bearish Channel – Sentiment Shaping Phase
From July 11 to July 21, the pair traded within a descending parallel channel, forming a bearish market structure.
This phase was not a genuine trend, but a sentiment builder—to:
Create a belief in continued bearishness
Gather liquidity around the channel boundaries
The upper and lower bounds of the channel were respected precisely, revealing market maker intent.
📈 2. Parabolic Curve Support – Trap Engineered
Price transitioned out of the channel into a rounded bullish curve—a visual cue suggesting accumulation and strength.
This curved trendline often misleads retail traders into thinking a breakout rally is coming.
Price surged aggressively toward the Previous Reversal Zone, further fueling FOMO buys.
But this move was not sustainable. Why?
➡️ Because it lacked a clean base and was built off a manipulated liquidity sweep. The curve was a setup.
🟥 3. Previous Reversal Zone & Major BOS – Institutional Exit Point
Price entered the Previous Reversal Zone, a marked area of prior supply.
This is where institutional orders were likely resting.
After briefly exceeding the previous high, the market instantly reversed with force—evidence of:
Stop hunts
Distribution
Smart money selling into retail breakout buyers
The Major BOS (Break of Structure) confirms the shift: The trend is no longer bullish.
⚠️ 4. Curve Support Breakdown – Structure Shift Triggered
After peaking, the price violated the curve support, confirming the bullish trap.
This breakdown signals a phase transition:
From accumulation illusion → distribution reality
From retail optimism → smart money unloading
🟨 5. Central Zone – Decision Point
Price is now hovering at the Central Zone, a region of equilibrium between buyers and sellers.
This is where market makers may:
Redistribute for another leg down
Fake a pullback before continuing lower
Temporarily rally to trap more longs
This area will determine short-term directional bias. That’s why your setup smartly outlines two conditions from this point.
🔀 Trade Scenarios – MMC Conditions
🔻 Condition 1: Bearish Continuation Toward Next Reversal Zone
If the price rejects the Central Zone and begins forming lower highs and bearish structures:
Expect further downside
This confirms the market is in redistribution mode
Target: Next Reversal Zone at 0.8630–0.8640
💡 Rationale: Institutions are driving price back into demand zones to grab new liquidity or fill leftover buy orders.
🔁 Condition 2: Temporary Recovery & Trap Continuation
If price holds above the Central Zone and breaks short-term highs:
A short-term bullish rally may occur
Likely targets: 0.8675–0.8685
This may act as a fake-out rally, creating more buying interest before a deeper dump
💡 Rationale: Smart money may induce more buyers to create fresh liquidity pockets before dropping toward the next reversal zone.
🔐 Key MMC Zones & Structure Levels
Zone/Level Purpose
0.8695–0.8700 Previous Reversal Zone / Major BOS – Institutional distribution area
0.8660–0.8665 Central Zone – Mid-point equilibrium & battle zone
0.8630–0.8640 Next Reversal Zone – Potential bullish interest area for demand
🧠 Smart Money Summary
This chart showcases a multi-stage smart money plan:
Create channel to shape bias
Form curve to generate false hope
Push into supply and trap late buyers
Break curve support to shift structure
Retest Central Zone to decide next manipulation leg
Deliver price toward true unfilled demand zones
This is how institutions engineer movement while retail gets trapped chasing direction.
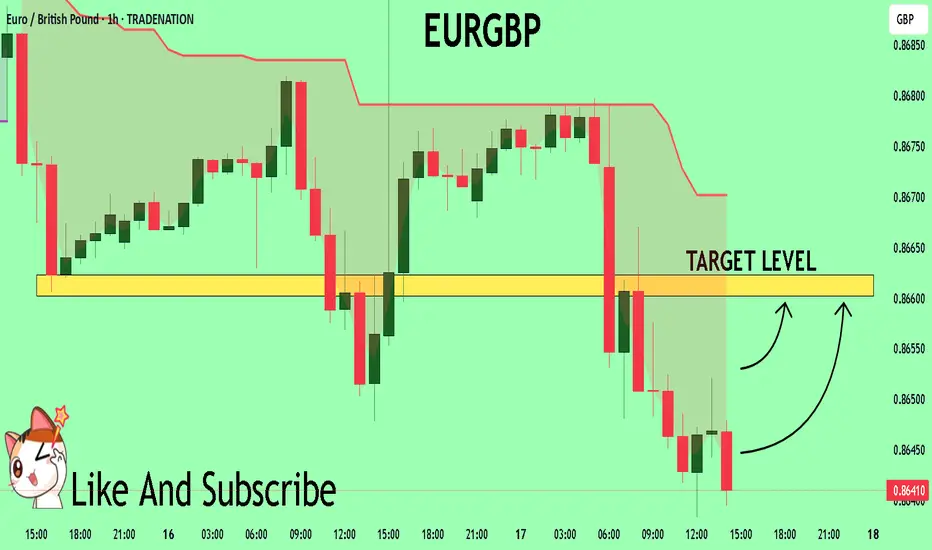
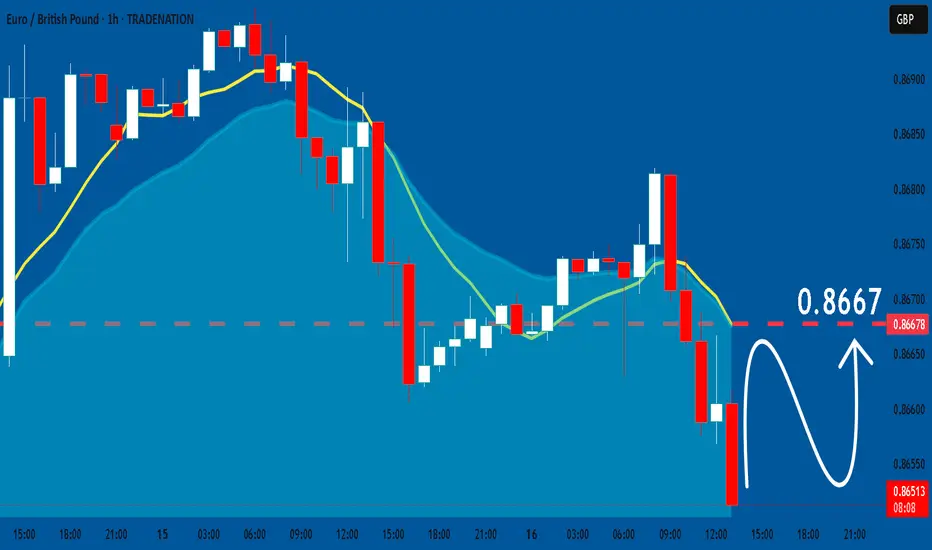
EURGBP
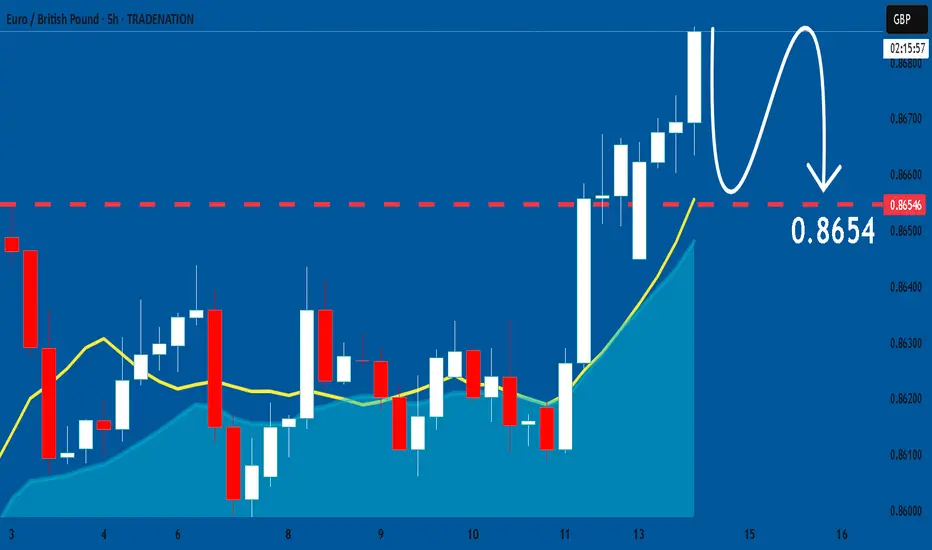
EURGBP The Target Is DOWN! SELL!
My dear friends,
Please, find my technical outlook for EURGBP below:
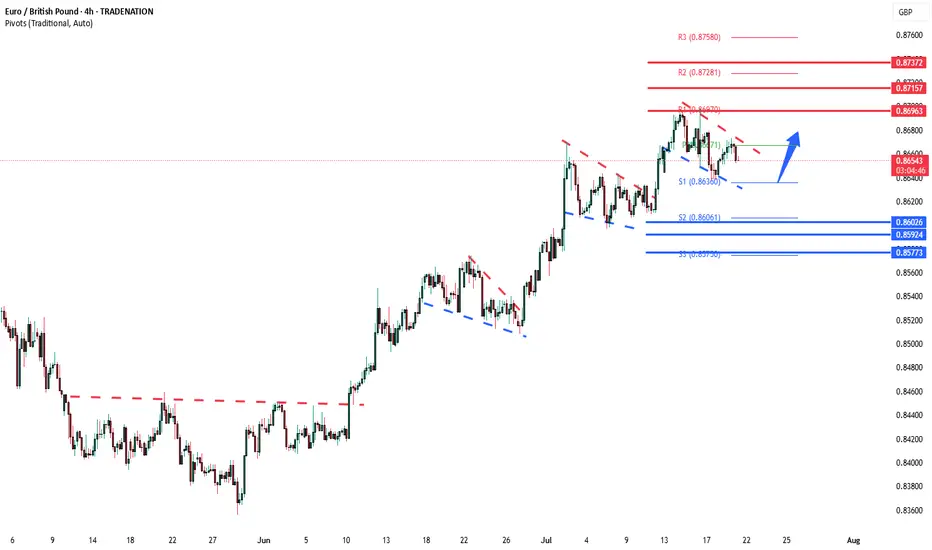
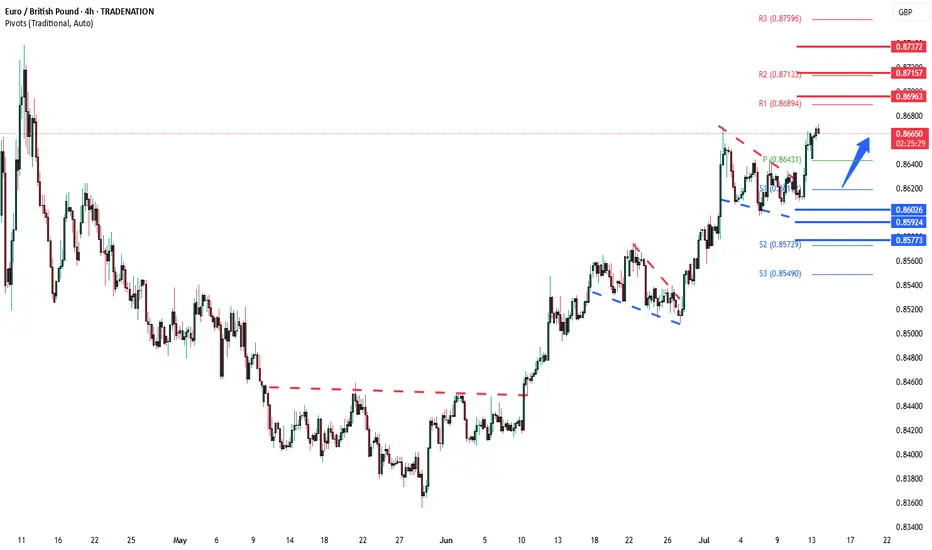
The price is coiling around a solid key level - 0.8676
Bias - Bearish
Technical Indicators: Pivot Points High anticipates a potential price reversal.
Super trend shows a clear sell, giving a perfect indicators' convergence.
Goal - 0.8670
About Used Indicators:
The pivot point itself is simply the average of the high, low and closing prices from the previous trading day.
Disclosure: I am part of Trade Nation's Influencer program and receive a monthly fee for using their TradingView charts in my analysis.
———————————
WISH YOU ALL LUCK

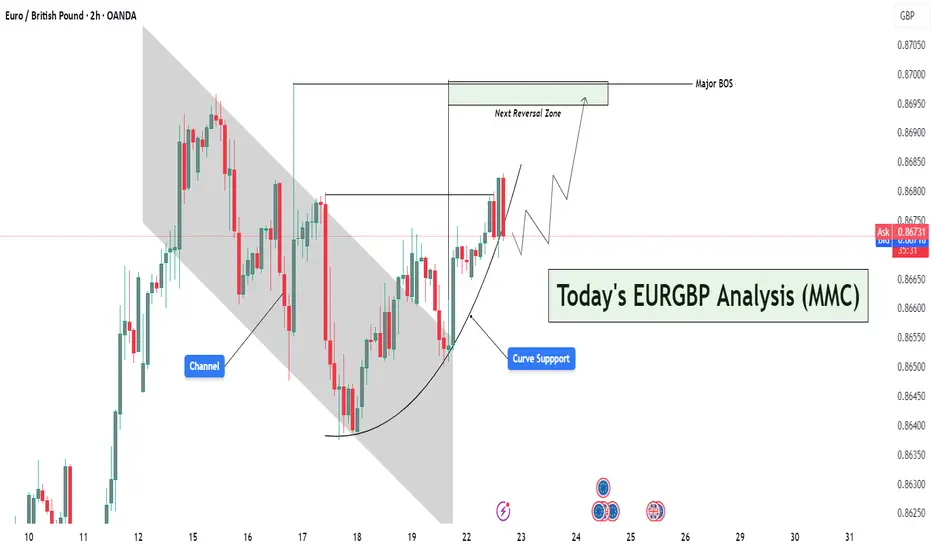
EURGBP Curved Support Breakout – Targeting Reversal Zone🔍 Market Context & Structural Narrative (MMC Style)
The EURGBP pair is currently displaying a textbook MMC structural evolution, transitioning from a bearish trend into a potential bullish leg driven by curve dynamics and trap-break logic.
🔨 Phase 1: Bearish Channel & Trap Formation
The market initially moved within a clearly defined descending channel, which acted as a trap for reactive sellers. Each lower high and lower low within the channel created a perception of sustained bearishness, luring breakout traders and late sellers into short positions.
✅ Key Insight:
This trap zone represents the first step in MMC logic — create a visible structure, generate bias, then prepare for inversion.
🌙 Phase 2: Curve Support – Psychological Accumulation
Around the base of the channel, the market began forming a rounded bottom or curve support. This is a signature MMC accumulation pattern, where market makers gradually absorb sell orders and build long positions without triggering immediate attention.
The curve support has the following implications:
Represents passive accumulation.
Suggests waning bearish pressure.
Builds bullish pressure subtly, often missed by retail traders.
🧠 MMC Mindset Tip:
Curved price action isn't just technical — it's psychological. It represents a controlled shift in sentiment, not an impulsive change, which is what makes it so powerful.
💥 Phase 3: Break of Structure (BOS) – Confirmation of Strength
Price breaks out of both the descending channel and the curved base, leading to a Major Break of Structure (BOS). This BOS is critical, as it confirms the invalidity of the previous bearish narrative and activates a new bullish leg.
📌 This BOS is more than a line — it’s a wall of liquidity getting broken. Price has now closed above key swing highs, which suggests:
Smart money is in control.
Trend shift is validated.
New demand zone created below.
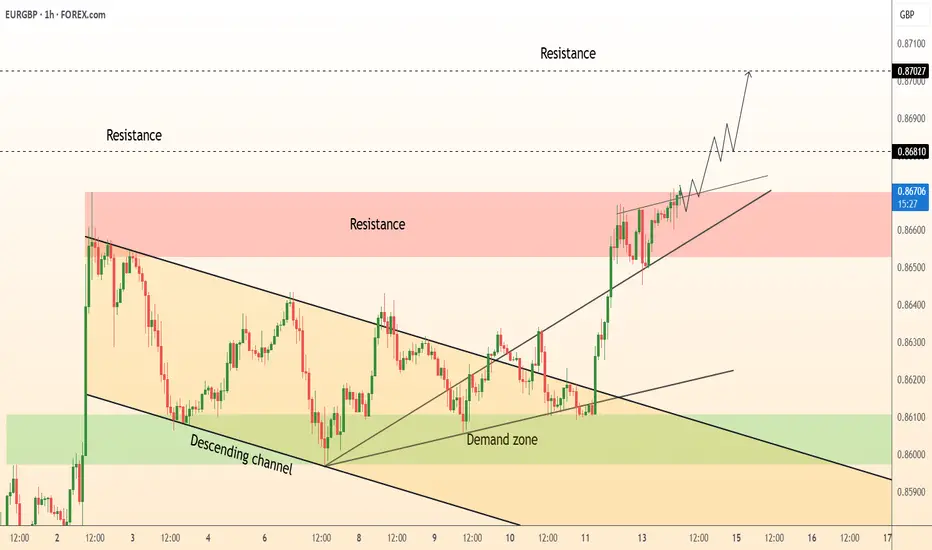
🎯 Projection: The Path to the Next Reversal Zone (NRZ)
Following the breakout, price is projected to:
Possibly retest the breakout level (structure retest) aligned with the curve support — a healthy bullish pullback.
Then move higher towards the Next Reversal Zone (NRZ), which is your defined target area.
📌 NRZ Insight:
This zone is where the market is likely to face:
High liquidity.
Strong previous supply.
Potential profit-taking by early bulls.
Thus, this becomes the make-or-break zone — price either:
Reverses sharply,
Or breaks through and continues the bull rally.
⚠️ Multiple Scenarios Based on MMC Conditions
✅ Scenario 1: Retest & Bounce (Ideal MMC Setup)
Price pulls back to retest the breakout level or the curve support.
Shows bullish confirmation (e.g., pin bar, bullish engulfing).
Targets the NRZ above 0.8700.
❌ Scenario 2: Failed Retest – Fakeout Trap
Price breaks below the curve and structure again.
Suggests that the BOS was a false breakout.
Could re-enter the previous bearish channel structure.
🔄 Scenario 3: Direct Rally Without Retest
Strong momentum buyers push price directly to NRZ.
Wait for reaction at NRZ — could trigger a reversal or continuation depending on price behavior.
🧠 MMC Strategic Takeaways:
Trap → Break → Shift is the psychological framework in play.
The curve is not just support — it's evidence of silent accumulation.
The NRZ isn’t just resistance — it's the battleground where MM logic resolves.
🔐 Trading Insights (Optional Entry Ideas):
Entry: On bullish confirmation near 0.8660–0.8665 (curve/structure support).
SL: Below curve base (e.g., 0.8640).
TP: Near or slightly below NRZ (0.8700–0.8705), partial profits or full exit.
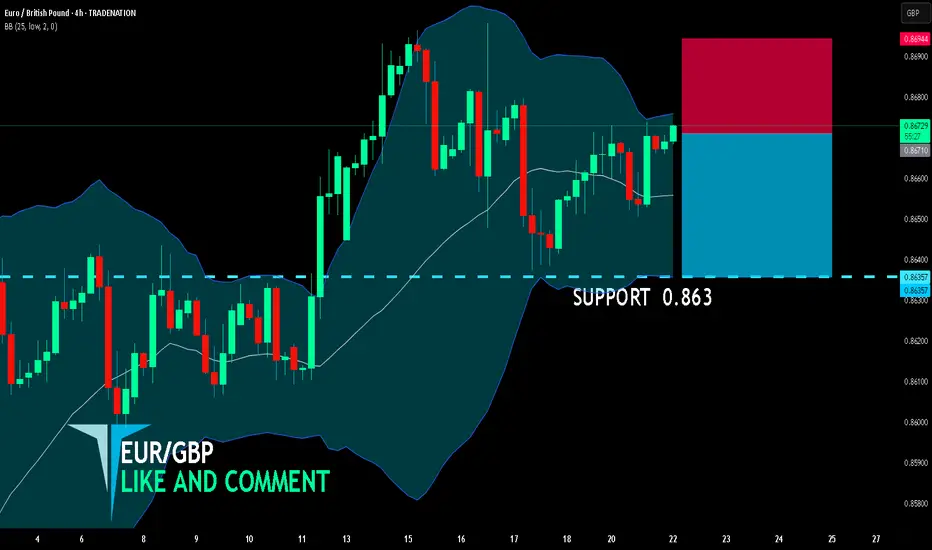
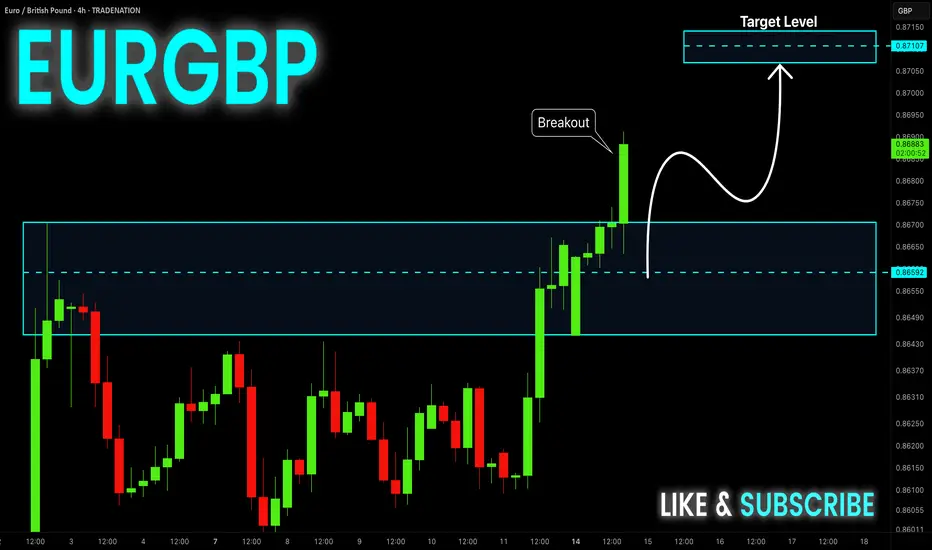
EUR/GBP SHORT FROM RESISTANCE
EUR/GBP SIGNAL
Trade Direction: short
Entry Level: 0.867
Target Level: 0.863
Stop Loss: 0.869
RISK PROFILE
Risk level: medium
Suggested risk: 1%
Timeframe: 4h
Disclosure: I am part of Trade Nation's Influencer program and receive a monthly fee for using their TradingView charts in my analysis.
✅LIKE AND COMMENT MY IDEAS✅
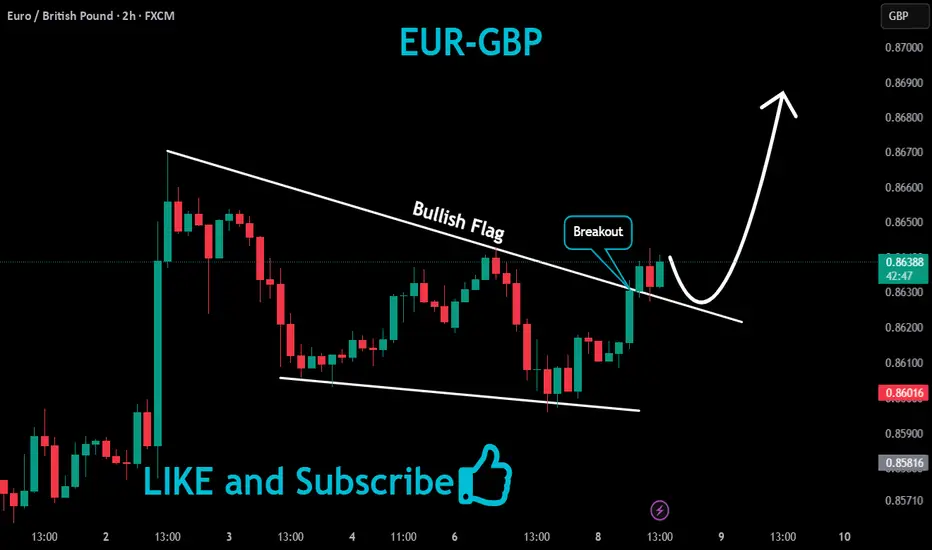
EURGBP bullish flag developing The EURGBP remains in a bullish trend, with recent price action showing signs of a corrective pullback within the broader uptrend.
Support Zone: 0.8620 – a key level from previous consolidation. Price is currently testing or approaching this level.
A bullish rebound from 0.8620 would confirm ongoing upside momentum, with potential targets at:
0.8700 – initial resistance
0.8715 – psychological and structural level
0.8740 – extended resistance on the longer-term chart
Bearish Scenario:
A confirmed break and daily close below 0.8620 would weaken the bullish outlook and suggest deeper downside risk toward:
0.8600 – minor support
0.8590 – stronger support and potential demand zone
Outlook:
Bullish bias remains intact while the EURGBP holds above 0.8620. A sustained break below this level could shift momentum to the downside in the short term.
This communication is for informational purposes only and should not be viewed as any form of recommendation as to a particular course of action or as investment advice. It is not intended as an offer or solicitation for the purchase or sale of any financial instrument or as an official confirmation of any transaction. Opinions, estimates and assumptions expressed herein are made as of the date of this communication and are subject to change without notice. This communication has been prepared based upon information, including market prices, data and other information, believed to be reliable; however, Trade Nation does not warrant its completeness or accuracy. All market prices and market data contained in or attached to this communication are indicative and subject to change without notice.
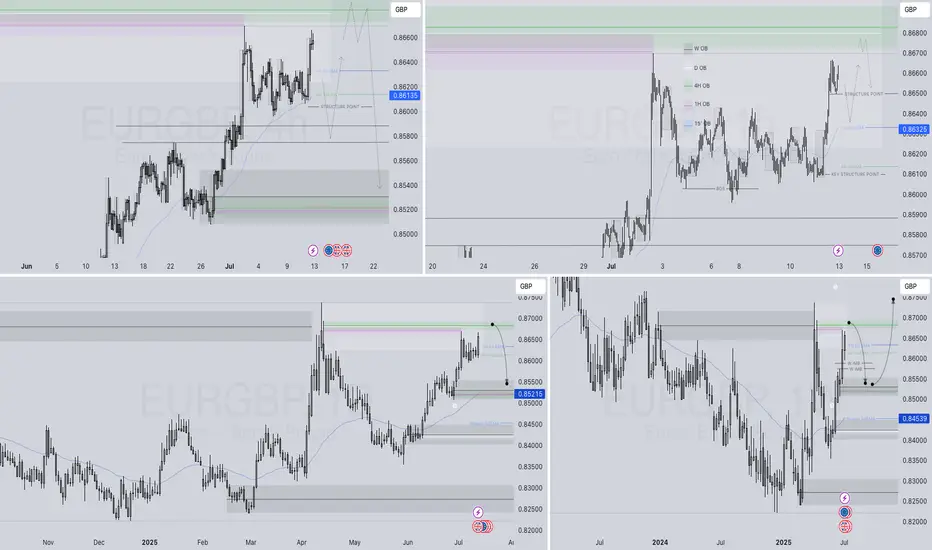
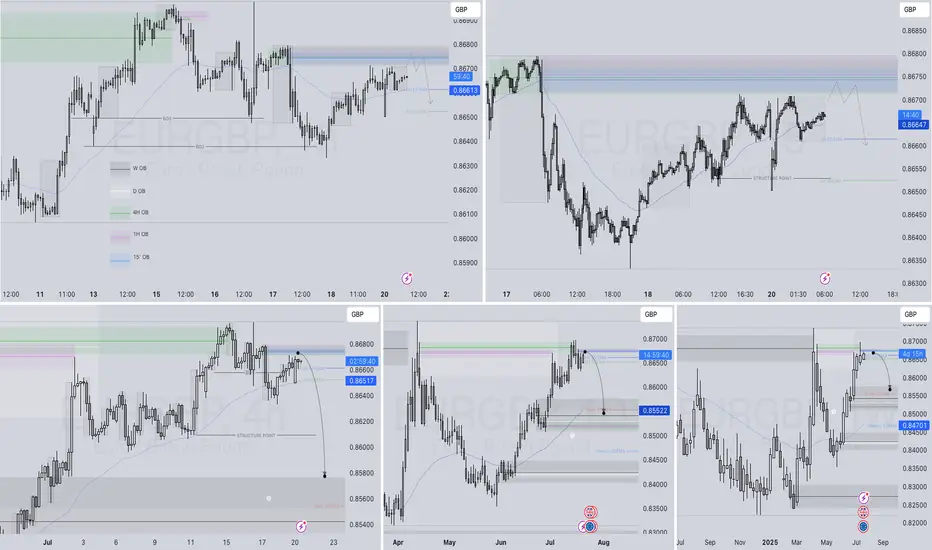
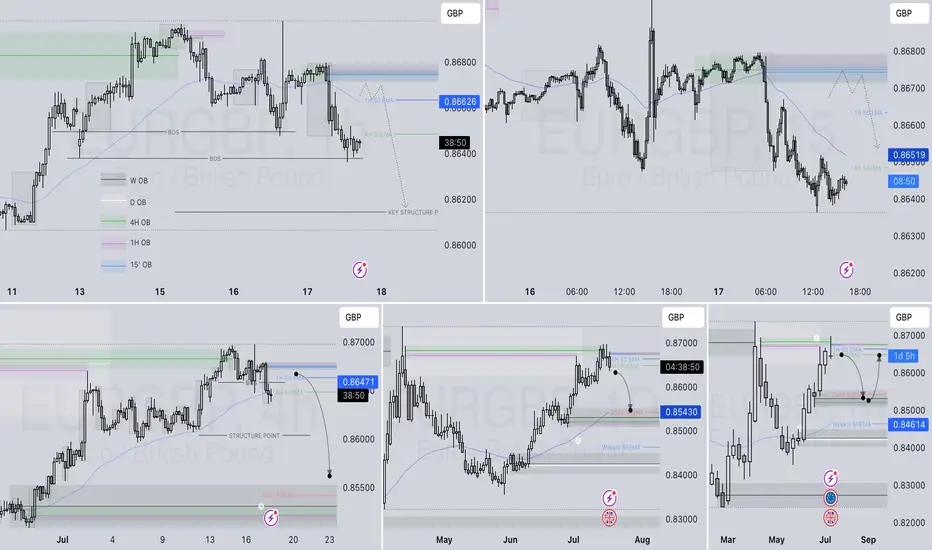
EURGBP Q3 | D21 | W30 | Y25📊EURGBP Q3 | D21 | W30 | Y25
Daily Forecast 🔍📅
Here’s a short diagnosis of the current chart setup 🧠📈
Higher time frame order blocks have been identified — these are our patient points of interest 🎯🧭.
It’s crucial to wait for a confirmed break of structure 🧱✅ before forming a directional bias.
This keeps us disciplined and aligned with what price action is truly telling us.
📈 Risk Management Protocols
🔑 Core principles:
Max 1% risk per trade
Only execute at pre-identified levels
Use alerts, not emotion
Stick to your RR plan — minimum 1:2
🧠 You’re not paid for how many trades you take, you’re paid for how well you manage risk.
🧠 Weekly FRGNT Insight
"Trade what the market gives, not what your ego wants."
Stay mechanical. Stay focused. Let the probabilities work.
FRGNT 📊
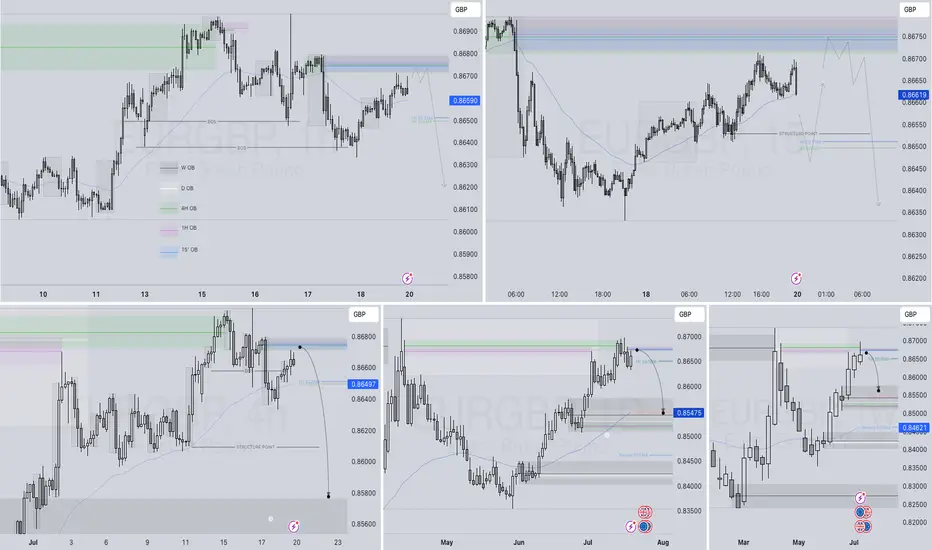
EURGBP – WEEKLY FORECAST Q3 | W30 | Y25📊 EURGBP – WEEKLY FORECAST
Q3 | W30 | Y25
Weekly Forecast 🔍📅
Here’s a short diagnosis of the current chart setup 🧠📈
Higher time frame order blocks have been identified — these are our patient points of interest 🎯🧭.
It’s crucial to wait for a confirmed break of structure 🧱✅ before forming a directional bias.
This keeps us disciplined and aligned with what price action is truly telling us.
📈 Risk Management Protocols
🔑 Core principles:
Max 1% risk per trade
Only execute at pre-identified levels
Use alerts, not emotion
Stick to your RR plan — minimum 1:2
🧠 You’re not paid for how many trades you take, you’re paid for how well you manage risk.
🧠 Weekly FRGNT Insight
"Trade what the market gives, not what your ego wants."
Stay mechanical. Stay focused. Let the probabilities work.
FRGNT FOREX ANALYSIS 📊
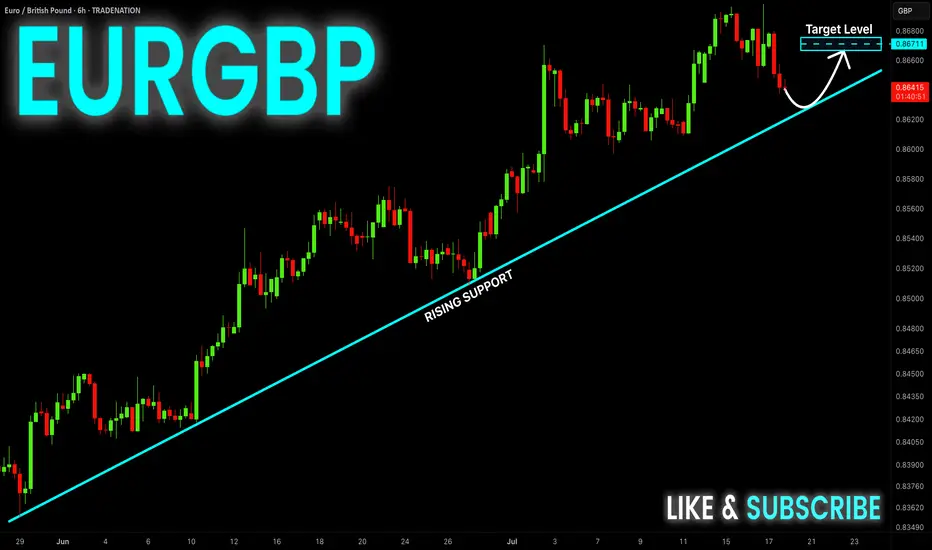
EUR-GBP Long From Rising Support! Buy!
Hello,Traders!
EUR-GBP is trading in an
Uptrend along the rising
Support line and the pair
Is going down now so after
The retest we will be
Expecting a bullish rebound
And a move up
Buy!
Comment and subscribe to help us grow!
Check out other forecasts below too!
Disclosure: I am part of Trade Nation's Influencer program and receive a monthly fee for using their TradingView charts in my analysis.

EURGBP SHORT – DAILY FORECAST Q3 | D17/18 | W29 | Y25💼 EURGBP SHORT – DAILY FORECAST
Q3 | D17/18 | W29 | Y25
FUN COUPON FRIDAY INCOMING !
📊 MARKET STRUCTURE SNAPSHOT
EURGBP is currently reacting from a key higher time frame supply zone, with price action showing weakness at premium levels. Momentum has slowed, and early signs of distribution are appearing. With structure aligning bearishly across multiple timeframes, the pair presents a short bias opportunity.
🔍 Confluences to Watch 📝
✅ Daily Order Block (OB)
Price reacted from a high-probability bearish OB.
Rejection wicks and a shift in candle body control point to supply dominance.
Momentum is fading, confirming the presence of smart money sellers.
✅ 4H Order Block
Clear mitigation of 4H OB followed by an internal break of structure (iBoS).
Price is respecting the OB zone, printing lower highs beneath key supply.
Perfect mid-timeframe confirmation of trend transition.
✅ 1H Order Block
1H structure shifted bearish, validating LTF trend alignment.
Price building supply chain with continued lower highs and bearish engulfing patterns.
Ideal zone for entry on pullback or liquidity sweep.
📈 Risk Management Protocols
🔑 Core Principles:
💰 Max 1% risk per trade
📍 Only execute at pre-identified zones
⏰ Set alerts — avoid impulsive trades
📉 Respect RR — minimum 1:2 per position
🧠 You're not paid for frequency. You're paid for discipline and execution quality.
🧠 Weekly FRGNT Insight
“Trade what the market gives, not what your ego wants.”
Stay mechanical, stay focused, and allow the probabilities to play out. Your job is to control risk — not the outcome.
🏁 Final Thoughts from FRGNT
📌 The structure is clear.
📌 The confluences are stacked.
📌 The bias is confirmed.
Let your execution reflect your discipline, not your emotions.
❤️ Good luck this week, and as always – I’ll see you at the very top.
EURGBP Trading Opportunity! BUY!
My dear friends,
My technical analysis for EURGBP is below:
The market is trading on 0.8645 pivot level.
Bias - Bullish
Technical Indicators: Both Super Trend & Pivot HL indicate a highly probable Bullish continuation.
Target - 0.8660
About Used Indicators:
A pivot point is a technical analysis indicator, or calculations, used to determine the overall trend of the market over different time frames.
Disclosure: I am part of Trade Nation's Influencer program and receive a monthly fee for using their TradingView charts in my analysis.
———————————
WISH YOU ALL LUCK
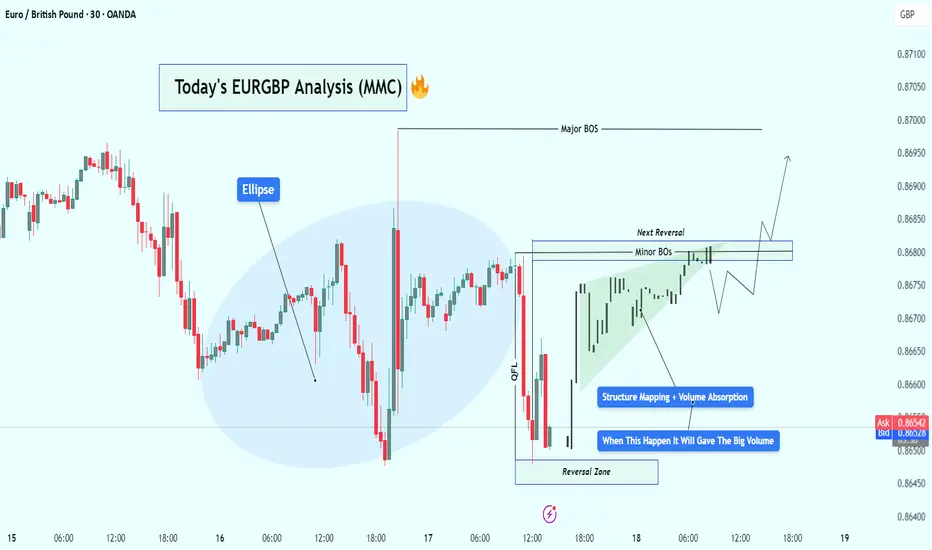
EURGBP Bullish Setup Analysis – MMC + Volume Absorption + TargetIn today's EUR/GBP 30-minute chart, we can clearly observe a well-structured Market Maker Cycle (MMC) in play, accompanied by Smart Money concepts such as volume absorption, minor BOS (Break of Structure), and reversal zone identification. Let’s walk through the technical story unfolding:
🧠 Step-by-Step Breakdown:
🟣 1. Reversal Zone & QFL (Quasimodo Failed Level) Formation
The price made a sharp decline, which trapped retail sellers chasing the breakout to the downside.
This drop landed into a key reversal zone — a price pocket where Smart Money often steps in for accumulation.
The QFL structure is evident here, showing a previous demand zone break and then recovery — classic stop-loss hunting behavior followed by institutional positioning.
This is often considered the “Spring” or “Manipulation” phase in Wyckoff or MMC theory.
🟩 2. Volume Absorption & Compression Phase
After tapping into the reversal zone, price action entered a tight compression range, forming a wedge/triangle.
During this phase, volume absorption is clearly visible — large players are absorbing selling pressure without letting price drop further.
This is a signal of re-accumulation. Buyers are loading up while keeping the price suppressed to mislead retail traders.
You’ve rightly labeled this phase as “Structure Mapping + Volume Absorption” — a textbook Smart Money behavior prior to breakout.
🔓 3. Minor Breaks of Structure (BOS)
As price consolidates, we begin to see Minor BOS— subtle shifts in structure where previous highs are taken out.
These BOS levels are confirmation that demand is outweighing supply.
Once we break multiple minor highs, it shows that buyers are now in control — hinting at the transition from Accumulation → Expansion.
📈 4. Projected Next Reversal + Breakout Scenario
The marked Next Reversal Zone above (around 0.8680–0.8695) is where we can expect the first true breakout and major expansion.
If price enters this area with increased volume, it validates that Smart Money is pushing into the Markup Phase of the MMC.
After the breakout, we could see price push toward 0.8710 and above.
📊 5. Market Maker Cycle (MMC) Summary
What we’re seeing here is a full-scale MMC pattern unfolding:
Manipulation (QFL trap ) → Accumulation (Volume absorption) → Structure Shift (Minor BOS) → Expansion (Reversal breakout)
This is the kind of setup that offers high-probability entries for those who understand Smart Money dynamics and wait for confirmation.
🎯 Key Levels to Watch:
Reversal Support Zone: 0.86450 – 0.86500
Breakout Target Zone: 0.86800 – 0.86950
Final Target (Swing): 0.87100+
🧠 Final Thoughts:
This EUR/GBP setup shows everything we love to see:
Liquidity taken ✅
Structure forming ✅
Volume building ✅
BOS confirming ✅
Expansion pending 🔜
Be patient. Let Smart Money reveal their hand through price action and volume confirmation.
EURGBP: Expecting Bullish Movement! Here is Why:
The charts are full of distraction, disturbance and are a graveyard of fear and greed which shall not cloud our judgement on the current state of affairs in the EURGBP pair price action which suggests a high likelihood of a coming move up.
Disclosure: I am part of Trade Nation's Influencer program and receive a monthly fee for using their TradingView charts in my analysis.
❤️ Please, support our work with like & comment! ❤️
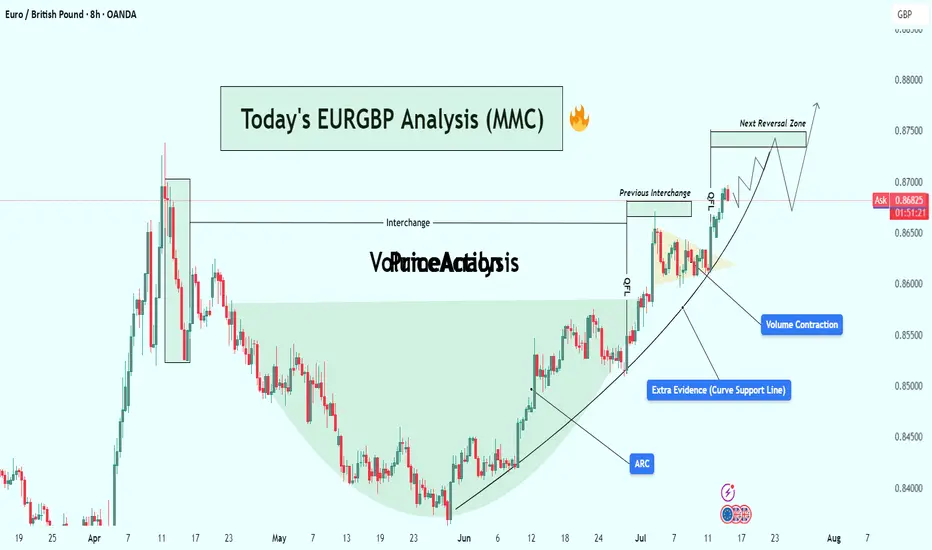
EURGBP Analysis : Bullish Setup + Support & Reversal Zone Ahead🔍 Overview:
This analysis explores a well-developed Mid-Market Cycle (MMC) pattern playing out on the EUR/GBP 8H chart. The price action has transitioned from accumulation to markup, forming a classic cup-shaped recovery structure supported by a parabolic ARC curve. With strong volume contraction, historical interchange zones, and clean breakouts, this setup indicates bullish momentum heading into the next reversal zone.
Let’s walk through each component in detail and build the case for this trade setup.
🧩 1. MMC Cycle Framework
The chart structure aligns with the MMC (Mid-Market Cycle) model:
Phase 1 – Accumulation:
From April to late May, price formed a rounded bottom resembling a "cup" — a known sign of smart money accumulation. The downward momentum stalled, and sellers were gradually absorbed by larger participants.
Phase 2 – Breakout & Expansion:
Early June saw price breaking out of this base, beginning an aggressive uptrend supported by rising structure. This marks the transition to the markup phase of the MMC.
Phase 3 – Pullback & Continuation:
Price pulled back slightly into previous resistance (now turned support), forming a bullish continuation triangle and breaking out again. A textbook MMC continuation.
🧠 2. Technical Confluences
✅ A. ARC Support Curve
The curved support line (ARC) acts as dynamic demand.
Price has bounced multiple times off the curve, reinforcing its strength.
ARC patterns often signal increasing bullish acceleration, reflecting market psychology as traders gain confidence with each higher low.
✅ B. Interchange Zones
The concept of Interchange refers to zones where support becomes resistance or vice versa.
This chart features two key interchange levels:
First interchange formed after the April high.
Second interchange was retested and held cleanly after the breakout.
These areas indicate institutional interest, and their successful retests confirm trend continuation.
✅ C. Volume Contraction
Volume has been shrinking during the markup, which is counterintuitive but strategic.
In Wyckoff theory, this shows absorption of supply — institutions deliberately suppress volatility to accumulate before the next breakout.
Once the contraction ends, explosive moves often follow.
🎯 3. Target Zone: Next Reversal Area
Price is now heading into a clearly defined resistance zone around 0.87400–0.87500.
This level was respected in prior price history (April peak) and may trigger short-term selling or distribution.
The chart shows a possible liquidity grab scenario at the reversal zone, followed by a corrective move (mini bearish ABC).
📈 4. Price Projection & Scenarios
Bullish Case (High Probability)
Breakout Above 0.87500: Triggers a major leg upward.
Potential extension targets:
0.87850 (Fibonacci projection)
0.88200 (next higher timeframe resistance)
Bearish Case (Short-Term Pullback)
Rejection at Reversal Zone:
A corrective leg toward the ARC or prior interchange.
Ideal re-entry for buyers near:
0.86400–0.86600 zone
Or curve retest near 0.86000
🧭 5. Trade Strategy
🔹 Entry Options:
Breakout Entry: Above 0.87500 on strong candle + volume.
Retest Entry: On dip toward ARC curve or interchange.
🔹 Stop-Loss Ideas:
Below ARC line (~0.86000)
Below last bullish engulfing (~0.86250)
🔹 Targets:
TP1: 0.87500
TP2: 0.87850
TP3: 0.88200 (longer-term swing)
💡 6. Trader Psychology in This Chart
This chart represents a controlled bullish structure — a hallmark of smart money participation. Here’s why:
The rounding base was methodically built without sudden volatility.
Each breakout was followed by healthy retests (no fakeouts).
Volume stayed low during markups, reducing retail confidence and allowing institutional loading.
The ARC curve reflects increasing confidence and participation — buyers consistently stepping in on higher lows.
📌 Conclusion
This EUR/GBP setup is a textbook MMC/ARC structure with multiple confirmations:
Smart accumulation
Curve support respected
Volume and structure aligned
Clear next resistance zone
Whether you’re swing trading or monitoring for breakout scalps, this is a high-quality setup worth tracking. Be ready to act at the reversal zone, as it will either confirm continuation or offer a lucrative retest entry.
🔔 Follow for More:
I post regular MMC, structure-based, and Smart Money trade setups. Drop a like, comment your thoughts, or ask questions below!
EURGBP Bullish Flag Pattern!
HI,Traders !
EURGBP is trading in an
Uptrend and made a bullish
Breakout out of bullish flag
Pattern so we are
Bullish biased and we
Will be expecting a
Further bullish move up !
Comment and subscribe to help us grow !
EUR-GBP Strong Bullish Breakout! Buy!
Hello,Traders!
EUR-GBP is trading in a
Strong uptrend and the
Pair made a bullish breakout
Of the key horizontal level
Of 0.8659 so we are
Bullish biased and we will
Be expecting a further
Bullish move up
Buy!
Comment and subscribe to help us grow!
Check out other forecasts below too!
Disclosure: I am part of Trade Nation's Influencer program and receive a monthly fee for using their TradingView charts in my analysis.
EURGBP: Bears Will Push Lower
Remember that we can not, and should not impose our will on the market but rather listen to its whims and make profit by following it. And thus shall be done today on the EURGBP pair which is likely to be pushed down by the bears so we will sell!
Disclosure: I am part of Trade Nation's Influencer program and receive a monthly fee for using their TradingView charts in my analysis.
❤️ Please, support our work with like & comment! ❤️
EURGBP Bullish continuation breakout supported at 0.8620The EURGBP remains in a bullish trend, with recent price action showing signs of a corrective pullback within the broader uptrend.
Support Zone: 0.8620 – a key level from previous consolidation. Price is currently testing or approaching this level.
A bullish rebound from 0.8620 would confirm ongoing upside momentum, with potential targets at:
0.8700 – initial resistance
0.8715 – psychological and structural level
0.8740 – extended resistance on the longer-term chart
Bearish Scenario:
A confirmed break and daily close below 0.8620 would weaken the bullish outlook and suggest deeper downside risk toward:
0.8600 – minor support
0.8590 – stronger support and potential demand zone
Outlook:
Bullish bias remains intact while the EURGBP holds above 0.8620. A sustained break below this level could shift momentum to the downside in the short term.
This communication is for informational purposes only and should not be viewed as any form of recommendation as to a particular course of action or as investment advice. It is not intended as an offer or solicitation for the purchase or sale of any financial instrument or as an official confirmation of any transaction. Opinions, estimates and assumptions expressed herein are made as of the date of this communication and are subject to change without notice. This communication has been prepared based upon information, including market prices, data and other information, believed to be reliable; however, Trade Nation does not warrant its completeness or accuracy. All market prices and market data contained in or attached to this communication are indicative and subject to change without notice.
DeGRAM | EURGBP broke out of the descending channel📊 Technical Analysis
● Price has punched through the month-long descending-channel roof and is holding the break, carving a tight bullish flag along a fresh up-trend line.
● Rebound from the 0.861 demand created an inverted H&S; its 1 : 1 projection aligns with the 0.8681 pivot and the March high at 0.8703, while RSI remains mid-range, leaving upside fuel.
💡 Fundamental Analysis
● Softer UK wage-growth and uptick in jobless claims revived talk of an August BoE cut, whereas a surprise rise in the Euro-area ZEW expectations index hints at stabilising growth, nudging rate-differential momentum toward the euro.
✨ Summary
Long 0.8650-0.8665; sustained trade above 0.8640 targets 0.8680 → 0.8703. Invalidate on an H1 close below 0.8610.
-------------------
Share your opinion in the comments and support the idea with like. Thanks for your support!
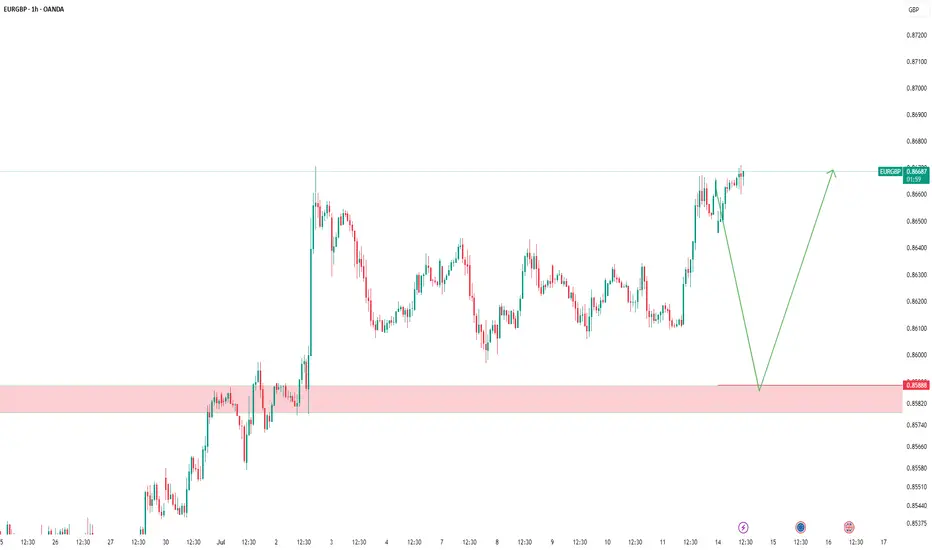
EURGBP – Waiting for the Market to Come to UsWe are patiently waiting for price to correct
and reach our level.
📌 If the price touches the level and gives us a valid signal,
we will buy.
📉 But if the level is broken, we don't panic —
we simply wait for a pullback and enter a short position.
🧠 No guessing, no stress.
We let the market come to us, and then we react — according to plan.
EUR/GBP BEARS ARE STRONG HERE|SHORT
Hello, Friends!
We are going short on the EUR/GBP with the target of 0.863 level, because the pair is overbought and will soon hit the resistance line above. We deduced the overbought condition from the price being near to the upper BB band. However, we should use low risk here because the 1W TF is green and gives us a counter-signal.
Disclosure: I am part of Trade Nation's Influencer program and receive a monthly fee for using their TradingView charts in my analysis.
✅LIKE AND COMMENT MY IDEAS✅

Ready to Raid the Chunnel? EUR/GBP Bullish Strategy Unveiled!🔥🤑 "THE CHUNNEL HEIST: EUR/GBP BULLISH LOOTING SEASON!" 🏴☠️💸
🌟 Greetings, Market Pirates & Profit Bandits! 🌟
(Hi! Hola! Ola! Bonjour! Hallo! Marhaba!)
Based on the 🚨THIEF TRADING STYLE🚨 (a ruthless mix of technical & fundamental analysis), we’re plotting a major heist on EUR/GBP "The Chunnel"—time to LOOT THE BULLS!
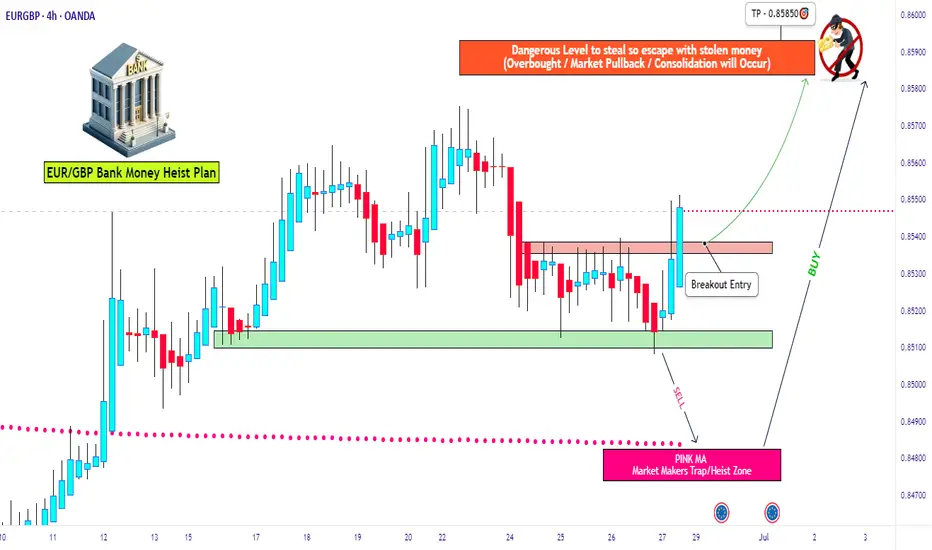
🚨 HEIST BLUEPRINT (LONG ENTRY) 🚨
🎯 Escape Zone: High-risk RED MA Zone (Overbought? Reversal? Trap? Bears lurking? Cops are waiting!).
🏆 Take Profit & Run! You’ve earned it, outlaw! 💰🔥
🔓 ENTRY: "VAULT IS OPEN—SWIPE THE BULLISH LOOT!" after the breakout
Pullback Entry near the Moving average @0.84850
Buy Limit Orders preferred (15-30min timeframe).
Swing Low/High Pullbacks = Perfect Stealth Entry.
⛔ STOP LOSS (SL): "DON’T GET CAUGHT!"
📍 Thief SL: Recent swing low (4H timeframe) @ 0.84000 (Scalping/Day Trade Basis).
⚠️ Adjust based on your risk, lot size & multiple orders!
🎯 TARGET: 0.85850 (OR ESCAPE EARLY IF HEAT’S ON!)
📢 WHY THIS HEIST? (BULLISH CATALYSTS)
💥 EUR/GBP is BULLISH—backed by:
Fundamentals (COT Report, Macro Data)
Sentiment & Intermarket Trends
Quantitative Edge (Check out for full intel! 👉🌎🔗)
🚨 TRADING ALERT: NEWS = DANGER ZONE!
📉 Avoid New Trades During High-Impact News!
🔒 Use Trailing Stops—Lock profits, evade volatility traps!
💥 BOOST THIS HEIST! (SUPPORT THE MISSION)
🔥 Hit the "LIKE" & "BOOST" button—strengthen our Profit Robbery Squad!
🤑 Daily Market Heists = Easy Money (Thief Trading Style FTW!)
Stay tuned for the next heist plan! 🚀🐱👤💖
EURGBP SHORT – WEEKLY FORECAST Q3 | W29 | Y25💼 EURGBP SHORT – WEEKLY FORECAST
Q3 | W29 | Y25
📊 MARKET STRUCTURE SNAPSHOT
EURGBP is currently reacting from a key higher time frame supply zone, with price action showing weakness at premium levels. Momentum has slowed, and early signs of distribution are appearing. With structure aligning bearishly across multiple timeframes, the pair presents a short bias opportunity.
🔍 Confluences to Watch 📝
✅ Daily Order Block (OB)
Price reacted from a high-probability bearish OB.
Rejection wicks and a shift in candle body control point to supply dominance.
Momentum is fading, confirming the presence of smart money sellers.
✅ 4H Order Block
Clear mitigation of 4H OB followed by an internal break of structure (iBoS).
Price is respecting the OB zone, printing lower highs beneath key supply.
Perfect mid-timeframe confirmation of trend transition.
✅ 1H Order Block
1H structure shifted bearish, validating LTF trend alignment.
Price building supply chain with continued lower highs and bearish engulfing patterns.
Ideal zone for entry on pullback or liquidity sweep.
📈 Risk Management Protocols
🔑 Core Principles:
💰 Max 1% risk per trade
📍 Only execute at pre-identified zones
⏰ Set alerts — avoid impulsive trades
📉 Respect RR — minimum 1:2 per position
🧠 You're not paid for frequency. You're paid for discipline and execution quality.
🧠 Weekly FRGNT Insight
“Trade what the market gives, not what your ego wants.”
Stay mechanical, stay focused, and allow the probabilities to play out. Your job is to control risk — not the outcome.
🏁 Final Thoughts from FRGNT
📌 The structure is clear.
📌 The confluences are stacked.
📌 The bias is confirmed.
Let your execution reflect your discipline, not your emotions.
❤️ Good luck this week, and as always – I’ll see you at the very top.