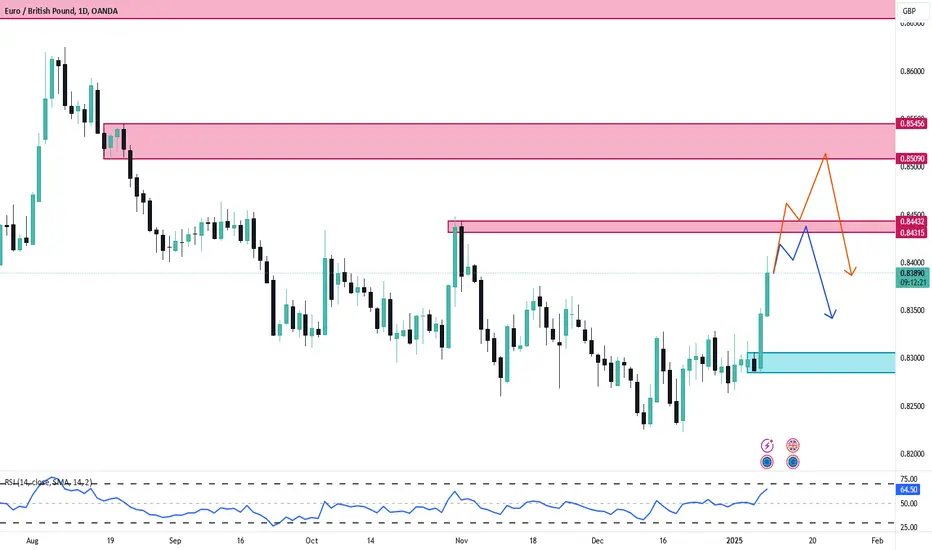
EURGBP: A Potential Short Opportunity Amidst ConsolidationEUR/GBP daily chart reveals a compelling narrative of consolidation followed by a potential bearish reversal. The pair has been trading within a defined range, bounded by key horizontal support and resistance zones (highlighted in blue). The recent price action suggests a rejection from the upper resistance zone, setting the stage for a possible short trade.
Key Observations:
Range-Bound Consolidation: The chart clearly shows EUR/GBP oscillating within a well-defined range. This pattern indicates a period of indecision, where neither buyers nor sellers have established a clear dominant trend.
Resistance Zone Test and Rejection: The price recently revisited the upper resistance zone. The subsequent price action, characterized by a sharp downward move, suggests a strong rejection from this level. This rejection is a critical signal that sellers are stepping in, potentially reversing the recent upward momentum.
Bearish Engulfing/Pin Bar Formation (Possible): While the chart doesn't explicitly highlight a candlestick pattern, the sharp rejection from the resistance zone suggests the formation of a bearish engulfing or a pin bar on a lower timeframe. This pattern reinforces the bearish bias.
Retracement and Entry Opportunity: The price has retraced a portion of the recent decline. This retracement presents a potential opportunity to enter a short position, capitalizing on the anticipated continuation of the bearish move.
Support Zones as Targets: The lower support zone serves as a primary target for the potential short trade. The intermediate support level (around 0.83727) can act as a partial profit-taking zone or a point to trail the stop loss.
Pattern Identification:
The dominant pattern observed is a range-bound consolidation followed by a potential bearish reversal triggered by a rejection from a key resistance zone. Trade Setup:
Entry: A short entry can be considered at the current price level (around 0.85021-0.85129) or on a break below the immediate support level (0.84772). A more conservative approach would be to wait for a clear bearish candlestick pattern confirmation on a lower timeframe (e.g., H4 or H1).
Stop Loss: The stop loss should be placed above the recent swing high (around 0.85867) to protect the trade from unexpected price reversals.
Take Profit: The primary target is the lower support zone (around 0.82537-0.82218). An intermediate target can be set at the 0.83727 level.
Risk-Reward Ratio: The potential trade offers a favorable risk-reward ratio, with a relatively small stop loss and a significant profit target.
Eurgbpsignal
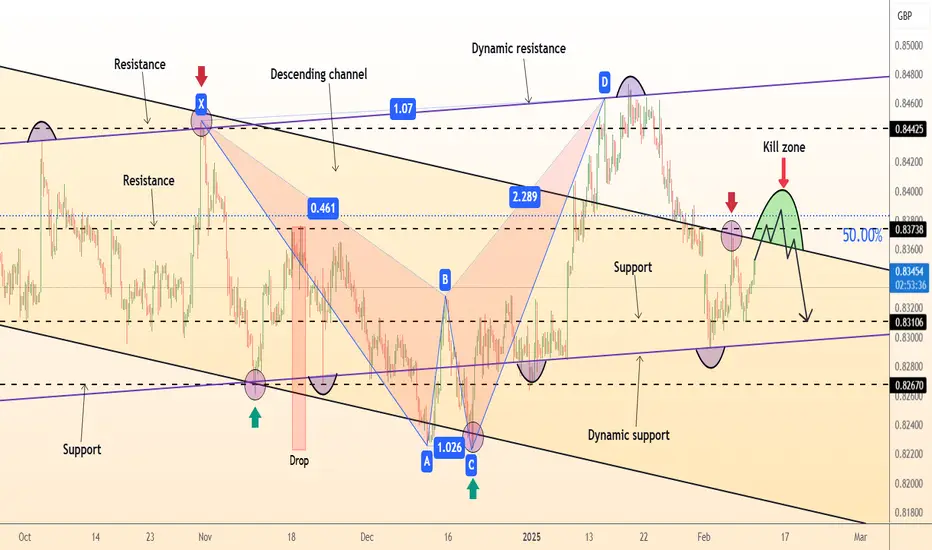
DeGRAM | EURGBP broke through the trend lineEURGBP is in a descending channel above the trend lines.
The price is moving from the support level and the lower boundary of the channel.
The chart formed a harmonic pattern, broke the upper trend line and reached the 50% retracement level.
The indicators indicate that a bullish divergence is now being worked out on the 4H Timeframe.
We expect the growth to continue after consolidation above the correction level.
-------------------
Share your opinion in the comments and support the idea with like. Thanks for your support!
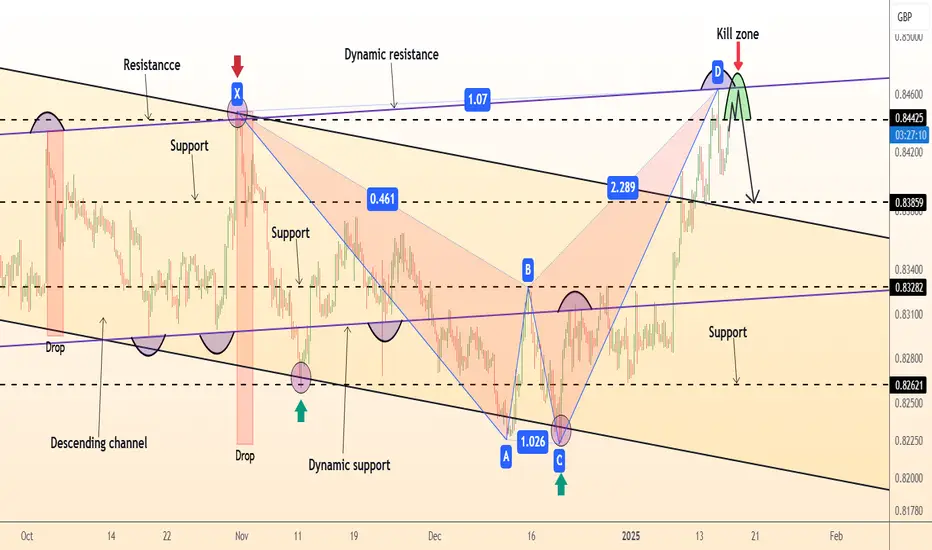
DeGRAM | EURGBP decline in the channelEURGBP is in a descending channel.
The price is moving from the resistance level and the upper boundary of the channel.
The chart maintains a downward structure and has already formed a harmonic pattern.
We expect that the pair will continue to decline after consolidating under the support level, which coincides with the 38.2% retracement level.
-------------------
Share your opinion in the comments and support the idea with like. Thanks for your support!
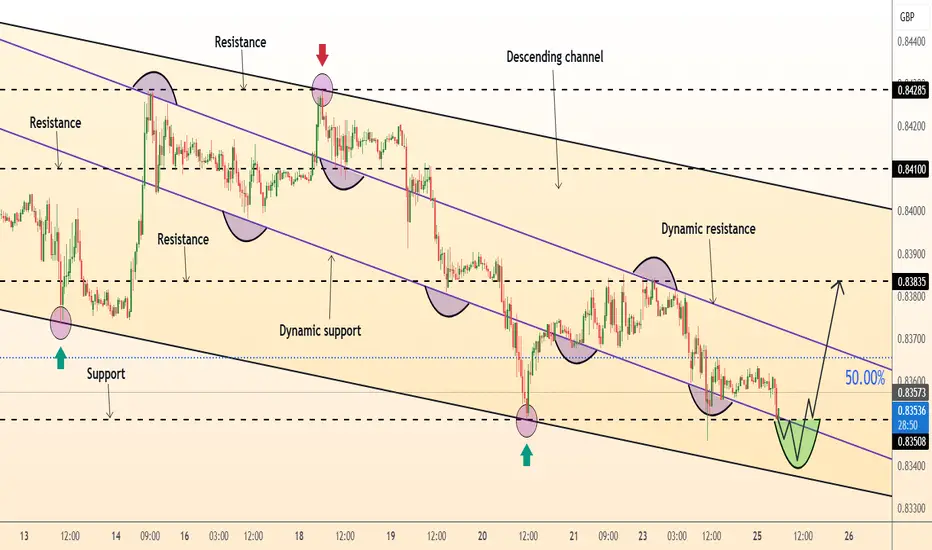
DeGRAM | EURGBP rebound in the channelEURGBP is in a descending channel between the trend lines.
The price is moving from the lower boundary of the channel and the support level.
The chart holds the support level, which has already acted as a rebound point.
We expect a rise after consolidation above the nearest retracement level.
-------------------
Share your opinion in the comments and support the idea with like. Thanks for your support!

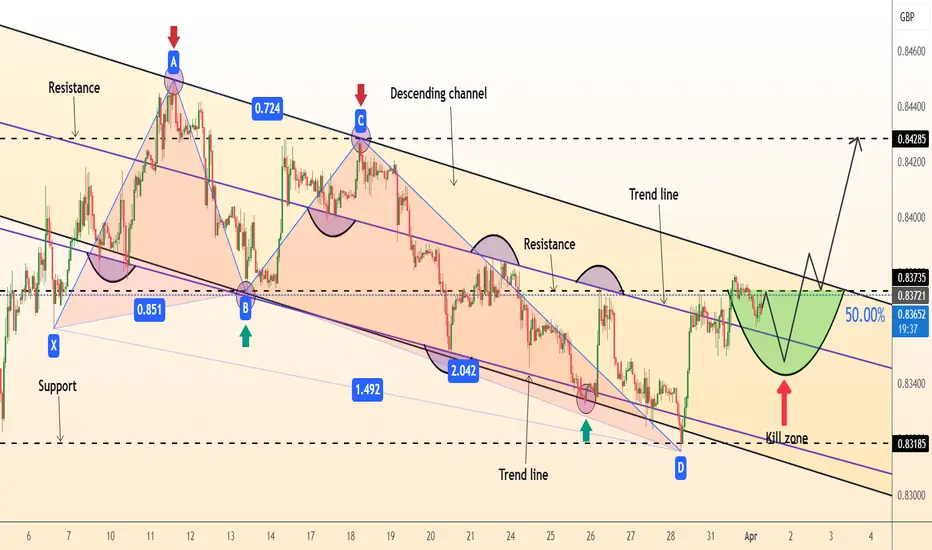
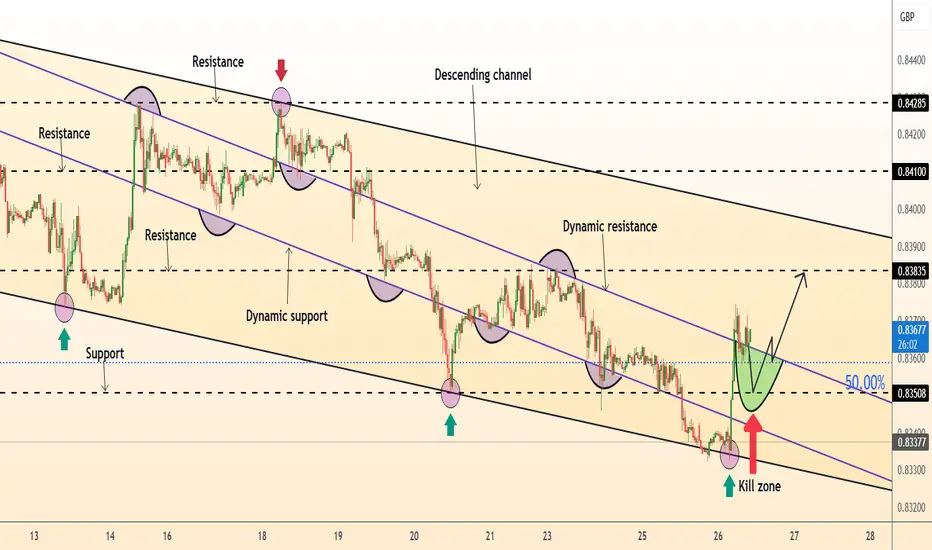
DeGRAM | EURGBP rebound from the lower boundary of the channelEURGBP is in a descending channel above the trend lines.
The price is moving from the lower boundary of the channel.
The chart has consolidated above the dynamic resistance and the 50% correction level.
We expect the rebound to continue.
-------------------
Share your opinion in the comments and support the idea with like. Thanks for your support!
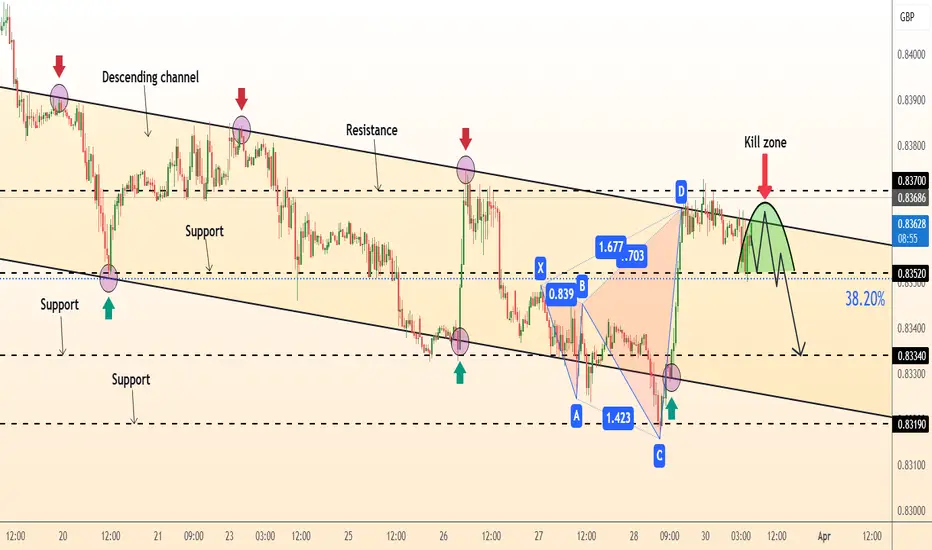
DeGRAM | EURGBP retest of supportEURGBP is in a descending channel between trend lines.
The price is moving from the lower boundary of the channel and now has fallen back to the support level.
The volatility of the chart has decreased.
On the 1H Timeframe, the indicators have formed a bullish convergence, which has not yet worked out.
We expect a rebound from the support.
-------------------
Share your opinion in the comments and support the idea with like. Thanks for your support!
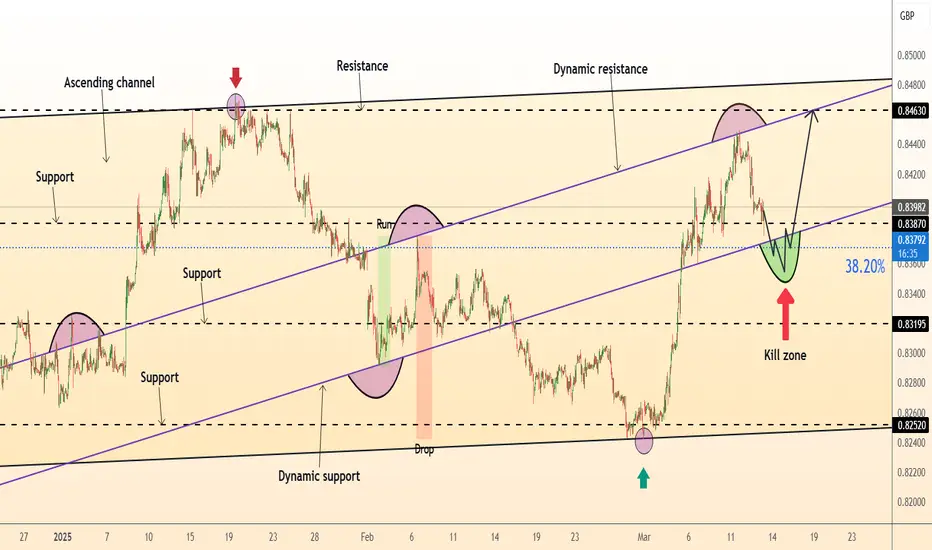
DeGRAM | EURGBP correction in the channelEURGBP is in a descending channel between the trend lines.
The price is moving from the lower boundary of the channel and dynamic support.
The chart has formed a harmonic pattern and is now holding above the 38.2% retracement level.
We expect the growth to the level of 0.84075.
-------------------
Share your opinion in the comments and support the idea with like. Thanks for your support!

EUR/GBP "The Chunnel" Forex Market Heist Plan🌟Hi! Hola! Ola! Bonjour! Hallo! Marhaba!🌟
Dear Money Makers & Thieves, 🤑 💰🐱👤🐱🏍
Based on 🔥Thief Trading style technical and fundamental analysis🔥, here is our master plan to heist the EUR/GBP "The Chunnel"Forex market. Please adhere to the strategy I've outlined in the chart, which emphasizes long entry. Our aim is the high-risk Red Zone. Risky level, overbought market, consolidation, trend reversal, trap at the level where traders and bearish robbers are stronger. 🏆💸Book Profits wealthy and safe trade.💪🏆🎉
Entry 📈 : "The heist is on! Wait for the MA breakout (0.83400) then make your move - Bullish profits await!"
however I advise to Place Buy stop orders above the Moving average (or) Place buy limit orders within a 15 or 30 minute timeframe most recent or swing, low or high level.
📌I strongly advise you to set an alert on your chart so you can see when the breakout entry occurs.
Stop Loss 🛑:
Thief SL placed at the recent/swing low or high level Using the 4H timeframe (0.83000) swing trade basis.
SL is based on your risk of the trade, lot size and how many multiple orders you have to take.
Target 🎯:
Primary Target - 0.84200 (or) Escape Before the Target
Secondary Target - 0.85000 (or) Escape Before the Target
🧲Scalpers, take note 👀 : only scalp on the Long side. If you have a lot of money, you can go straight away; if not, you can join swing traders and carry out the robbery plan. Use trailing SL to safeguard your money 💰.
📰🗞️Fundamental, Macro, COT Report, Quantitative Analysis, Intermarket Analysis, Sentimental Outlook:
EUR/GBP "The Chunnel" Forex Market market is currently experiencing a neutral trend,., driven by several key factors.
🔱Fundamental Analysis
Interest Rates: The European Central Bank (ECB) has maintained its interest rates at 3.50%, while the Bank of England (BoE) has kept its rates at 4.50%. The interest rate differential is slightly in favor of the GBP.
Inflation: Eurozone inflation is at 5.3% (Jan 2025), while UK inflation is at 3.2% (Jan 2025). The higher inflation in the Eurozone might lead to a rate hike by the ECB.
GDP Growth: Eurozone GDP growth is expected to be around 1.2% in 2025, while the UK's GDP growth is expected to be around 1.5% in 2025.
Trade Balance: The Eurozone has a trade surplus, while the UK has a trade deficit.
🔱Macroeconomic Factors
Unemployment Rates: Eurozone unemployment is at 6.4% (Jan 2025), while UK unemployment is at 3.7% (Jan 2025).
Manufacturing PMI: Eurozone Manufacturing PMI is at 48.5 (Feb 2025), while UK Manufacturing PMI is at 49.3 (Feb 2025).
Services PMI: Eurozone Services PMI is at 52.3 (Feb 2025), while UK Services PMI is at 50.2 (Feb 2025).
🔱Global Market Analysis
Risk Appetite: Global risk appetite is moderate, with investors seeking safe-haven assets amid concerns over inflation and economic growth.
Commodity Prices: Oil prices are stable, while gold prices are rising due to safe-haven demand.
🔱COT Data
Non-Commercial Traders (Large Speculators)
Net Positions: EUR/GBP net positions are slightly bearish, with 55% of traders holding short positions.
Long Positions: Long positions are moderate, with 45% of traders holding long positions.
Short Positions: Short positions are slightly higher, with 55% of traders holding short positions.
Commercial Traders (Hedgers)
Net Positions: EUR/GBP net positions are slightly bullish, with 52% of traders holding long positions.
Long Positions: Long positions are moderate, with 52% of traders holding long positions.
Short Positions: Short positions are slightly lower, with 48% of traders holding short positions.
🔱Intermarket Analysis
Correlation: EUR/GBP is negatively correlated with EUR/USD and positively correlated with GBP/JPY.
Cross-Rates: EUR/JPY and GBP/JPY are trading in a range, indicating a balanced market.
🔱Quantitative Analysis
Trend Analysis: The EUR/GBP is trading in a downtrend, with a bearish bias.
Momentum Indicators: RSI (14) is at 40, indicating a neutral market. MACD (12, 26) is bearish, with a signal line crossover.
🔱Market Sentimental Analysis
Trader Sentiment: Trader sentiment is slightly bearish, with 55% of traders expecting a price decline.
Market Positioning: Market positioning is neutral, with a balanced ratio of long to short positions.
🔱Positioning
Long Positions: Long positions are moderate, with traders holding 45% of long positions.
Short Positions: Short positions are slightly higher, with traders holding 55% of short positions.
🔱Overall Summary Outlook
The EUR/GBP is expected to trade lower, driven by a stronger GBP and a weaker EUR. The bearish bias is supported by fundamental, technical, and sentimental analysis. However, traders should be cautious of potential reversals and use proper risk management techniques.
📌Keep in mind that these factors can change rapidly, and it's essential to stay up-to-date with market developments and adjust your analysis accordingly.
⚠️Trading Alert : News Releases and Position Management 📰 🗞️ 🚫🚏
As a reminder, news releases can have a significant impact on market prices and volatility. To minimize potential losses and protect your running positions,
we recommend the following:
Avoid taking new trades during news releases
Use trailing stop-loss orders to protect your running positions and lock in profits
💖Supporting our robbery plan 💥Hit the Boost Button💥 will enable us to effortlessly make and steal money 💰💵. Boost the strength of our robbery team. Every day in this market make money with ease by using the Thief Trading Style.🏆💪🤝❤️🎉🚀
I'll see you soon with another heist plan, so stay tuned 🤑🐱👤🤗🤩
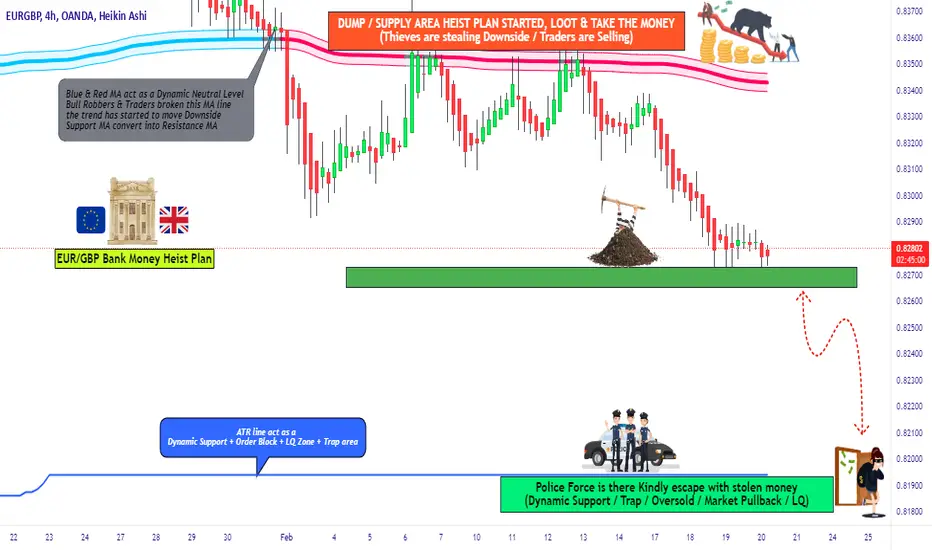
EUR/GBP "The Chunnel" Forex Market Bearish Heist Plan🌟Hi! Hola! Ola! Bonjour! Hallo!🌟
Dear Money Makers & Robbers, 🤑 💰🐱👤🐱🏍
Based on 🔥Thief Trading style technical and fundamental analysis🔥, here is our master plan to heist the EUR/NZD "Euro vs Kiwi" Forex Market. Please adhere to the strategy I've outlined in the chart, which emphasizes short entry. Our aim is the high-risk Green Zone. Risky level, oversold market, consolidation, trend reversal, trap at the level where traders and bullish robbers are stronger. 🏆💸Book Profits Be wealthy and safe trade.💪🏆🎉
Entry 📈 : The heist is on! Wait for the breakout of (0.82650) then make your move - Bearish profits await!"
however I advise placing Sell stop below the support line or Sell limit orders within a 15 or 30 minute timeframe. Entry from the most recent or closest low or high level should be in swing/retest.
I highly recommend to use alert in your trading platform.
Stop Loss 🛑: Thief SL placed at 1.83000 (swing Trade Basis) Using the 4H period, the recent / swing high or low level.
SL is based on your risk of the trade, lot size and how many multiple orders you have to take.
Target 🎯: 0.81950 (or) Escape Before the Target
🧲Scalpers, take note 👀 : only scalp on the Short side. If you have a lot of money, you can go straight away; if not, you can join swing traders and carry out the robbery plan. Use trailing SL to safeguard your money 💰.
📰🗞️Fundamental, Macro, COT, Sentimental Outlook:
The EUR/GBP "The Chunnel" Forex Market is currently experiencing a Bearish trend., driven by several key factors.
⚖️Fundamental Analysis
- The European Central Bank's (ECB) monetary policy decisions significantly impact the EUR/GBP exchange rate. The ECB's interest rate decisions influence the euro's value relative to the pound.
- The UK's economic performance, including GDP growth, inflation, and employment rates, also affects the exchange rate.
- Political developments, such as Brexit negotiations and EU-UK trade agreements, can create market volatility and impact the EUR/GBP exchange rate.
⚖️Macro Economics
- Inflation Rates: The ECB's inflation target is below, but close to, 2%. The UK's inflation rate has been above the Bank of England's 2% target. These differences can influence the exchange rate.
- Interest Rates: The ECB's interest rates are currently lower than the Bank of England's rates. This difference can impact the exchange rate.
- GDP Growth: The EU's GDP growth has been slower than the UK's in recent years. This difference can influence the exchange rate.
⚖️COT Data
- Commitment of Traders (COT): The COT report shows that large speculators, such as hedge funds and institutional investors, are currently net short on the euro. This suggests that they expect the euro to weaken against the pound.
- Non-Commercial Traders: Non-commercial traders, such as individual investors and hedge funds, are currently net long on the euro. This suggests that they expect the euro to strengthen against the pound.
⚖️Market Sentimental Analysis
- Market Sentiment: The market sentiment for EUR/GBP is currently bearish, with many analysts expecting the euro to weaken against the pound.
- Positioning: Many traders and investors are currently short on the euro, expecting it to weaken against the pound.
⚖️Trader Positions
- Institutional Traders: 55% short, 45% long
- Retail Traders: 58% short, 42% long
- Hedge Funds: 60% short, 40% long
- Commercial Traders: 52% short, 48% long
- Banks: 50% short, 50% long
⚖️Next Trend Move
- Based on the current market sentiment and positioning, the next trend move for EUR/GBP is likely to be downward, with the euro weakening against the pound.
- However, it's essential to keep in mind that market trends can change rapidly, and unexpected events can impact the exchange rate.
⚖️Quantitative Analysis
- Moving Averages: The 50-day moving average is currently above the 200-day moving average, indicating a bullish trend. However, the short-term moving averages (10-day and 20-day) are below the longer-term moving averages, indicating a bearish trend.
- Relative Strength Index (RSI): The RSI is currently at 40, indicating that the market is oversold and due for a bounce.
- Bollinger Bands: The Bollinger Bands are currently widening, indicating increased volatility.
⚖️Intermarket Analysis
- Correlation with Other Markets: EUR/GBP is currently positively correlated with the EUR/USD and negatively correlated with the GBP/USD.
- Impact of Other Markets: The EUR/GBP exchange rate is likely to be impacted by the performance of the US dollar, as well as the relative economic performance of the EU and UK.
- Commodity Prices: Changes in commodity prices, such as oil and gold, can also impact the EUR/GBP exchange rate.
⚖️Overall Summary Outlook
The EUR/GBP exchange rate is expected to decline in the short-term, driven by the bearish market sentiment and positioning. The euro's weakness against the pound is likely to continue, with a potential target of 0.8200. However, any unexpected positive developments in the EU or negative developments in the UK could lead to a reversal of the trend. Traders and investors should remain cautious and monitor market developments closely.
⚠️Trading Alert : News Releases and Position Management 📰 🗞️ 🚫🚏
As a reminder, news releases can have a significant impact on market prices and volatility. To minimize potential losses and protect your running positions,
we recommend the following:
Avoid taking new trades during news releases
Use trailing stop-loss orders to protect your running positions and lock in profits
📌Please note that this is a general analysis and not personalized investment advice. It's essential to consider your own risk tolerance and market analysis before making any investment decisions.
📌Keep in mind that these factors can change rapidly, and it's essential to stay up-to-date with market developments and adjust your analysis accordingly.
💖Supporting our robbery plan will enable us to effortlessly make and steal money 💰💵 Tell your friends, Colleagues and family to follow, like, and share. Boost the strength of our robbery team. Every day in this market make money with ease by using the Thief Trading Style.🏆💪🤝❤️🎉🚀
I'll see you soon with another heist plan, so stay tuned 🤑🐱👤🤗🤩
DeGRAM | EURGBP completes the correctionEURGBP is in an ascending channel between the trend lines.
The price has already reached the support level and approached the lower trend line.
Indicators are forming a bullish convergence on the 1H Timeframe.
We expect the growth to resume.
-------------------
Share your opinion in the comments and support the idea with like. Thanks for your support!
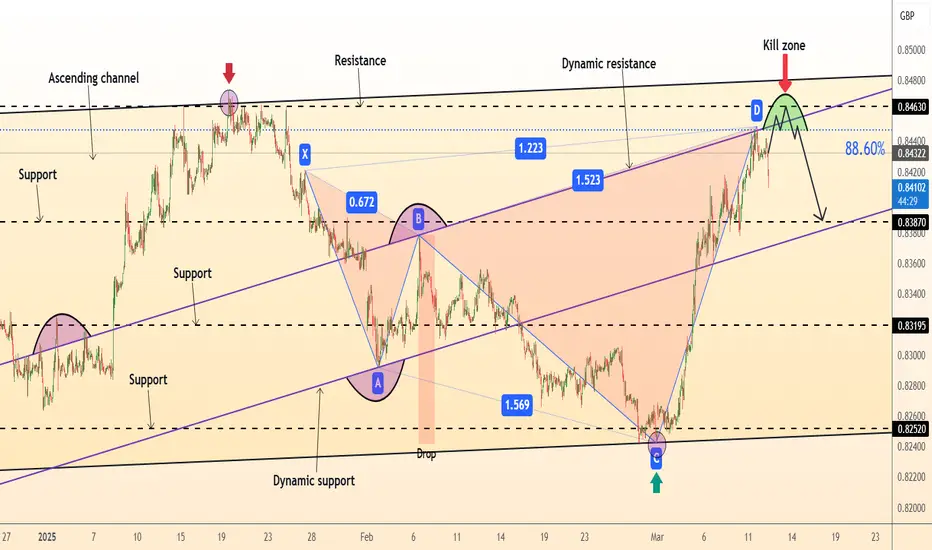
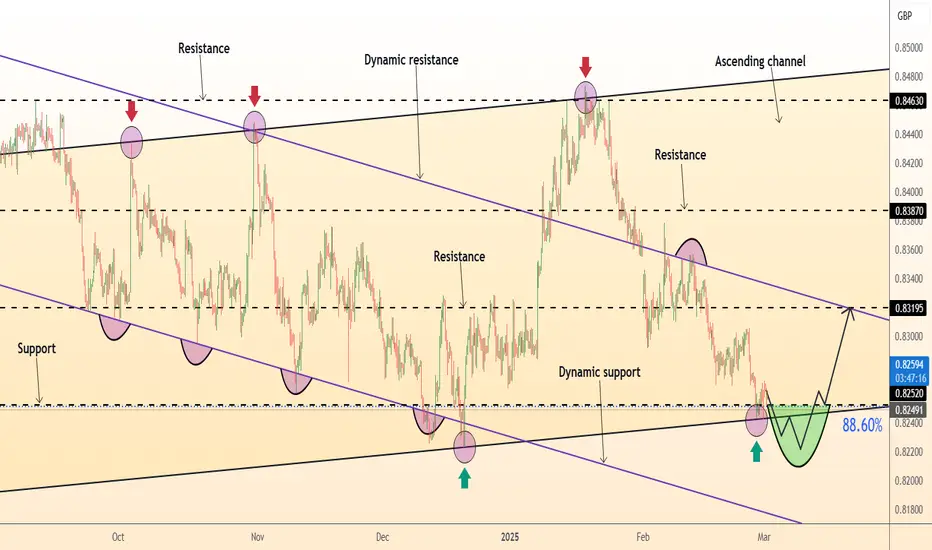
DeGRAM | EURGBP pullback from the retracement levelEURGBP is in an ascending channel between the trend lines.
The price is moving from the dynamic resistance, which has already acted as a pullback point, and 88.6% retracement level.
The chart formed a harmonic pattern after reaching the upper trend line.
Indicators continue to form a bearish divergence on the 4H Timeframe.
We expect a pullback.
-------------------
Share your opinion in the comments and support the idea with like. Thanks for your support!
EURGBP uptrend - continuing⭐️Smart investment, Strong finance
⭐️EURGBP INFORMATION:
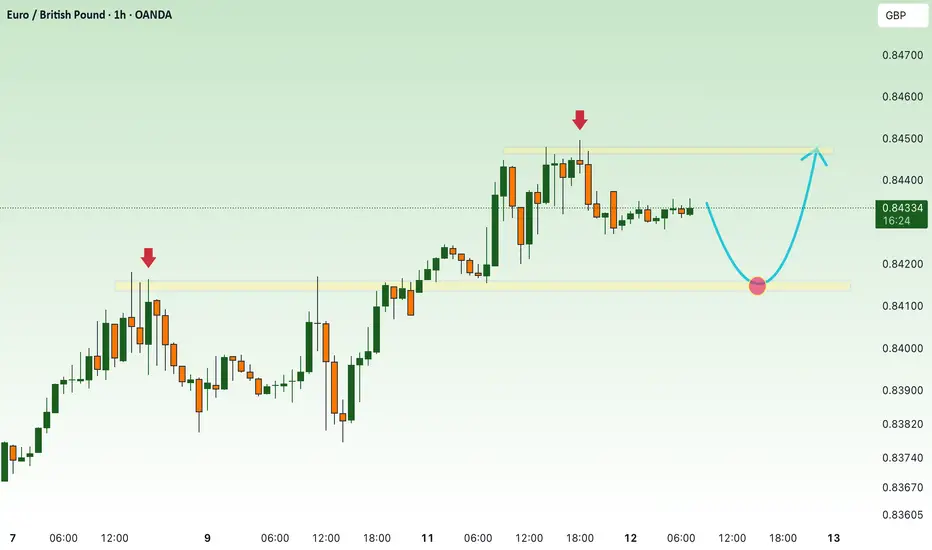
EUR/GBP extends its winning streak since March 3, hovering around 0.8440 during Tuesday’s European session. The pair gains momentum as the European Union (EU) considers boosting defense spending through joint borrowing, EU funds, and an expanded role for the European Investment Bank (EIB), with crucial decisions anticipated by June.
⭐️Personal comments NOVA:
EURGBP H1 breakout price zone retreats, continuing the uptrend
⭐️SET UP EURGBP PRICE:
🔥BUY eurgbp zone: 0.84200 - 0.84100 SL 0.83800
TP1: 0.84500
TP2: 0.84800
TP3: 0.85200
⭐️Technical analysis:
Based on technical indicators EMA 34, EMA89 and support resistance areas to set up a reasonable BUY order.
⭐️NOTE:
Note: Nova wishes traders to manage their capital well
- take the number of lots that match your capital
- Takeprofit equal to 4-6% of capital account
- Stoplose equal to 2-3% of capital account
DeGRAM | EURGBP correction in the channelEURGBP is in an ascending channel between the trend lines.
The price has reached the dynamic resistance.
Indicators have formed a bearish divergence on the 4H Timeframe.
The chart has formed a harmonic pattern.
We expect a correction.
-------------------
Share your opinion in the comments and support the idea with like. Thanks for your support!
DeGRAM | EURGBP retest of the support levelEURGBP is in an ascending channel between the trend lines.
The price is moving from the lower boundary of the channel as well as the support level, which coincides with the 88.6% retracement level.
The chart is forming an ascending structure.
On the 1H Timeframe, the indicators indicate a bullish convergence formation.
We expect growth in the channel after consolidation above the support.
-------------------
Share your opinion in the comments and support the idea with like. Thanks for your support!
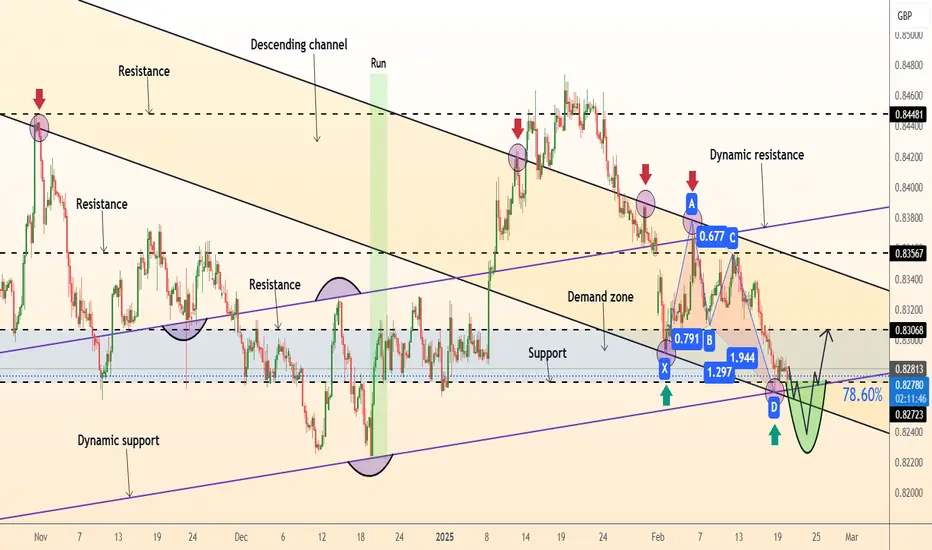
DeGRAM | EURGBP retest of the demand zoneEURGBP is in a descending channel, in the demand zone between the trend lines.
The price is moving from the lower boundary of the channel and dynamic support, which has previously become a rebound point.
The chart has formed a harmonic pattern.
Indicators on the 1H Timeframe point to a bullish convergence.
We expect growth after the retest of the lower boundary of the demand zone.
-------------------
Share your opinion in the comments and support the idea with like. Thanks for your support!
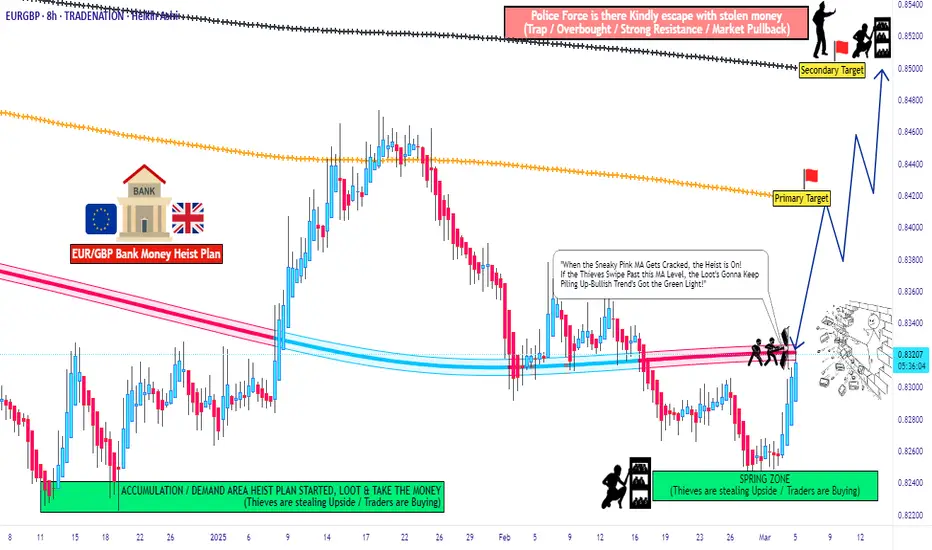
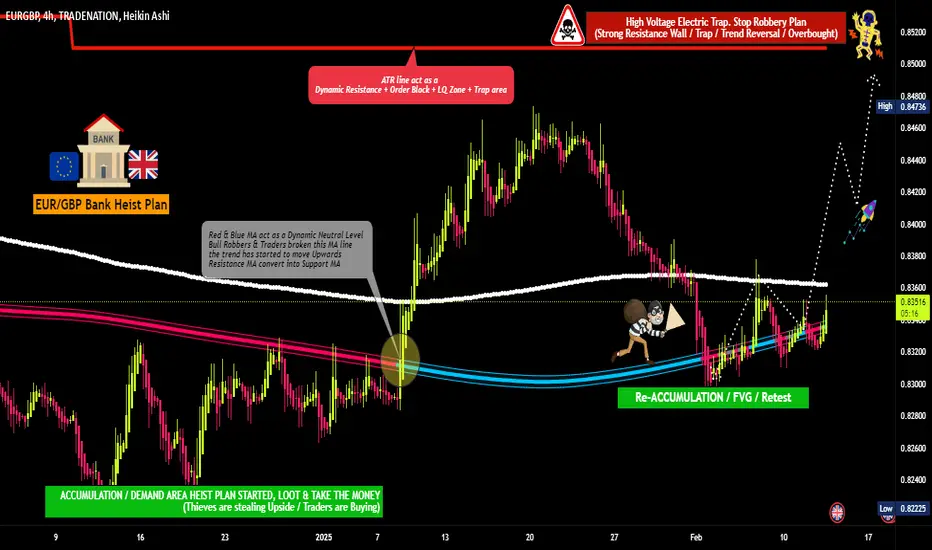
EUR/GBP "The Chunnel" Forex Market Bullish Heist Plan🌟Hi! Hola! Ola! Bonjour! Hallo!🌟
Dear Money Makers & Thieves, 🤑 💰🐱👤🐱🏍
Based on 🔥Thief Trading style technical and fundamental analysis🔥, here is our master plan to heist the EUR/GBP "The Chunnel" Forex market. Please adhere to the strategy I've outlined in the chart, which emphasizes long entry. Our aim is the high-risk Red Zone. Risky level, overbought market, consolidation, trend reversal, trap at the level where traders and bearish robbers are stronger. 🏆💸Book Profits, Be wealthy and safe trade.💪🏆🎉
Entry 📈 : "The heist is on! Wait for the MA breakout (0.83700) then make your move - Bullish profits await!"
however I advise to placing the Buy Stop Orders above the breakout MA or placing the Buy limit orders within a 15 or 30 minute timeframe. Entry from the most recent or closest low or high level should be in retest.
Stop Loss 🛑: Thief SL placed at 0.83200 (swing Trade Basis) Using the 4H period, the recent / Swing Low or High level.
SL is based on your risk of the trade, lot size and how many multiple orders you have to take.
Target 🎯: 0.85100 (or) Escape Before the Target
🧲Scalpers, take note 👀 : only scalp on the Long side. If you have a lot of money, you can go straight away; if not, you can join swing traders and carry out the robbery plan. Use trailing SL to safeguard your money 💰.
📰🗞️Fundamental, Macro, COT, Sentimental Outlook:
EUR/GBP "The Chunnel" Forex Market market is currently experiencing a bullish trend,., driven by several key factors.
🎇Fundamental Analysis
The EUR/GBP pair is influenced by the interest rate differential between the European Central Bank (ECB) and the Bank of England (BoE). The ECB's main refinancing rate remains at 0.0%, while the BoE's base rate stands at 3.5%. Recent economic indicators show Eurozone Q2 GDP growth rate slowing to 0.2% quarterly and 1.1% annualized, while UK Q2 GDP growth rate remains at 0.4% quarterly and 2.1% annualized.
🎇Macroeconomic Analysis
GDP Growth Rate: Eurozone Q2 GDP growth rate slowed to 0.2% quarterly, 1.1% annualized; UK Q2 GDP growth rate at 0.4% quarterly, 2.1% annualized.
Inflation Rate: Eurozone July inflation rate at 1.0% annualized; UK July inflation rate at 1.5% annualized.
Unemployment Rate: Eurozone unemployment rate at 7.5%; UK unemployment rate at 3.9%.
Trade Balance: Eurozone trade surplus at €24.6 billion; UK trade deficit at £-14.8 billion.
🎇COT Data Analysis
Institutional Traders: 55% long, 45% short.
Retail Traders: 52% short, 48% long.
Large Banks: 57% long, 43% short.
Hedge Funds: 50% long, 50% short.
🎇Market Sentimental Analysis
Market Sentiment: 40% bullish, 60% bearish.
Trader Sentiment: 29% long, 71% short.
Option Skew: 25-delta put option skew at 10.5.
🎇Positioning Data Analysis
Bullish Trend: 45% likely.
Bearish Trend: 55% likely.
Neutral Trend: 10% likely.
🎇Technical Analysis
Moving Averages: 50-day MA indicating 45% bearish trend.
Relative Strength Index (RSI): 40, signaling 60% oversold conditions.
Bollinger Bands: Lower band breakout.
🎇Overall Outlook
The EUR/GBP pair is experiencing a bearish trend, with potential buying opportunities at 0.83700. However, some analysts predict a bullish continuation, targeting 0.85100. The pair's technical outlook points to a buildup of bearish momentum as markets turn cautious ahead of US President Donald Trump's trade policy and Federal Reserve Chairman Jerome Powell's testimony.
⚠️Trading Alert : News Releases and Position Management 📰 🗞️ 🚫🚏
As a reminder, news releases can have a significant impact on market prices and volatility. To minimize potential losses and protect your running positions,
we recommend the following:
Avoid taking new trades during news releases
Use trailing stop-loss orders to protect your running positions and lock in profits
📌Please note that this is a general analysis and not personalized investment advice. It's essential to consider your own risk tolerance and market analysis before making any investment decisions.
📌Keep in mind that these factors can change rapidly, and it's essential to stay up-to-date with market developments and adjust your analysis accordingly.
💖Supporting our robbery plan will enable us to effortlessly make and steal money 💰💵 Tell your friends, Colleagues and family to follow, like, and share. Boost the strength of our robbery team. Every day in this market make money with ease by using the Thief Trading Style.🏆💪🤝❤️🎉🚀
I'll see you soon with another heist plan, so stay tuned 🤑🐱👤🤗🤩
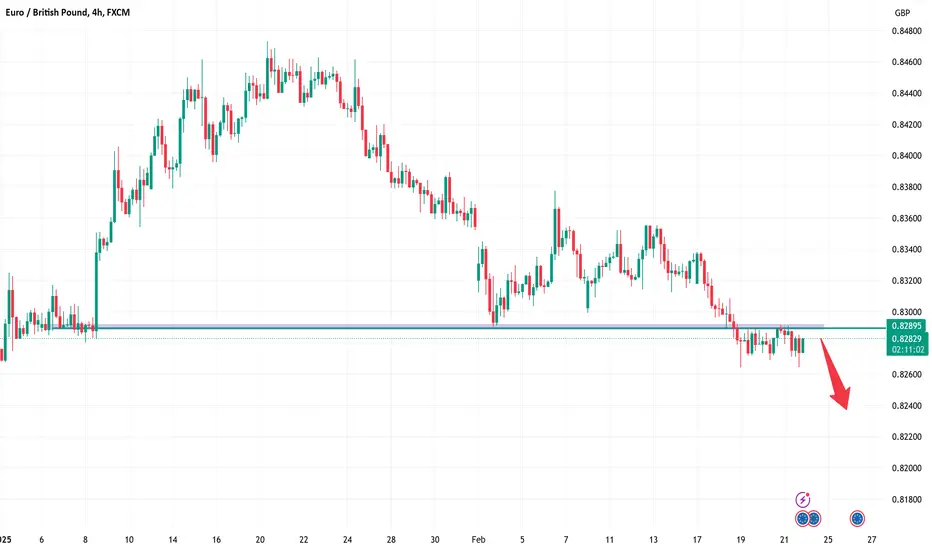
EURGBP Short SetupEURGBP Analysis
The EUR/GBP pair is exhibiting a bearish trend on the higher time frames, which is favorable for our analysis. The market has formed a series of lower highs and lower lows, confirming the downward momentum. Currently, the price is testing a strong resistance level that has been retested, presenting a critical juncture. At this point, it is prudent to adopt a wait-and-see approach to observe how the market interacts with this level. A break above the resistance could invalidate our bearish setup, while a rejection and consolidation below this level would reinforce the likelihood of the bearish trend continuing.
We will monitor the market's behavior closely. I hope you all had a profitable trading week, and I wish you a pleasant and restful weekend ahead.
Cheers!
#EURGBP 4HEURGBP (4H Timeframe) Analysis
Market Structure:
The price is currently forming a symmetrical triangle pattern, indicating market consolidation and reduced volatility. This pattern suggests that the price is preparing for a breakout, but the direction remains uncertain. A breakout on either side will provide further clarity on the next potential move.
Forecast:
Traders should wait for a confirmed breakout in either direction before entering a position.
Key Levels to Watch:
- Entry Zone: A breakout above the resistance trendline may signal a buy opportunity, while a breakdown below the support trendline may indicate a sell opportunity.
- Risk Management:
- Stop Loss: Placed beyond the breakout level to manage risk.
- Take Profit: Target the next key support or resistance levels, depending on the breakout direction.
Market Sentiment:
A symmetrical triangle represents market indecision, and a breakout in either direction will determine the next trend. Waiting for confirmation ensures alignment with the prevailing market movement.

DeGRAM | EURGBP back in the channelEURGBP is in a descending channel between the trend lines.
The price has already reached the upper boundary of the channel and the resistance level, which previously acted as a pullback point.
The chart retains a harmonic pattern.
We expect the decline in the channel to continue.
-------------------
Share your opinion in the comments and support the idea with like. Thanks for your support!
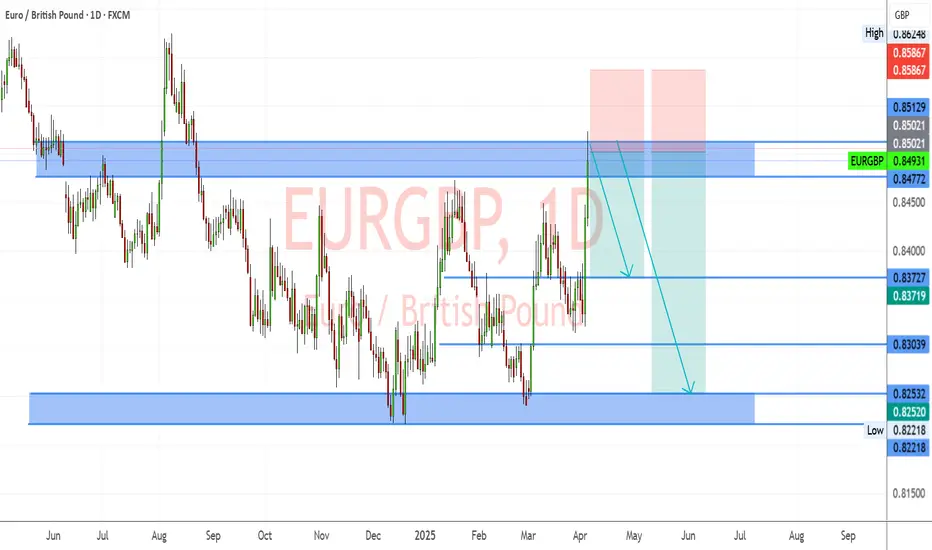
EURGBP, First Long and after that Get Ready for ShortHello Traders, Hope you are doing great.
for upcoming weeks, we'll probably see continuation of upward momentum and after that we'll probably find an opportunity to Sell at one of these specified zones. so with a proper trigger we can open a long at first and after that a short position.
And finally tell me what do you think ? UP or DOWN ? leave your comment below this post.
If this post was helpful to you, please like it and share it with your friend.
THANKS.
DeGRAM | EURGBP will continue to declineEURGBP is above the descending channel between the trend lines.
The price continues to move from the dynamic resistance.
The chart retains the actual formed harmonic pattern, but shows weakness when approaching the channel.
We expect the continuation of the decline after the support retest and consolidation in the channel.
-------------------
Share your opinion in the comments and support the idea with like. Thanks for your support!

DeGRAM | EURGBP structure is changingEURGBP is above the descending channel between the trend lines.
The chart has broken the descending structure, but indicators point to bearish divergence.
The price has reached the upper trend line and resistance level.
We expect a correction.
-------------------
Share your opinion in the comments and support the idea with like. Thanks for your support!
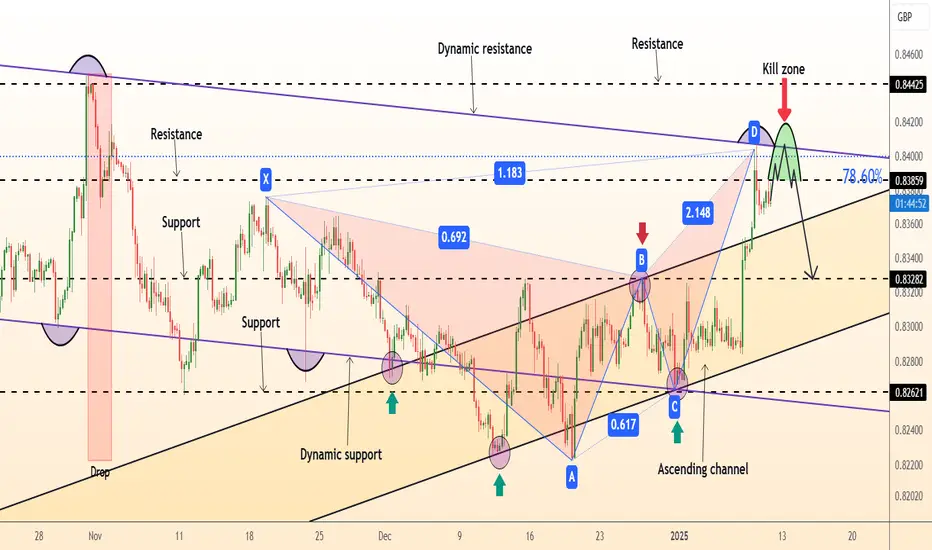
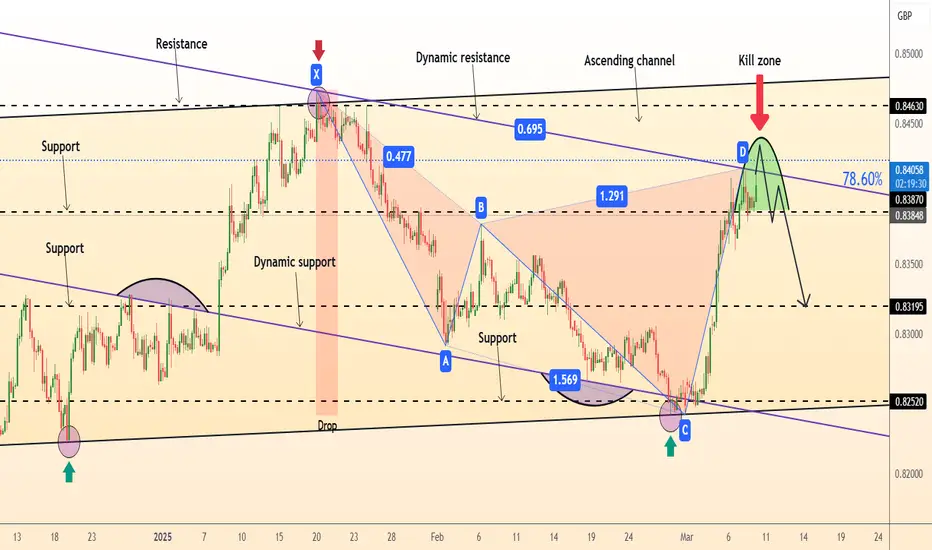
DeGRAM | EURGBP pullback from the trend lineEURGBP is above the ascending channel between the trend lines.
The price is moving from the dynamic resistance and is now under the 78.6% retracement level.
The chart has formed a harmonic pattern.
We expect a pullback.
-------------------
Share your opinion in the comments and support the idea with like. Thanks for your support!