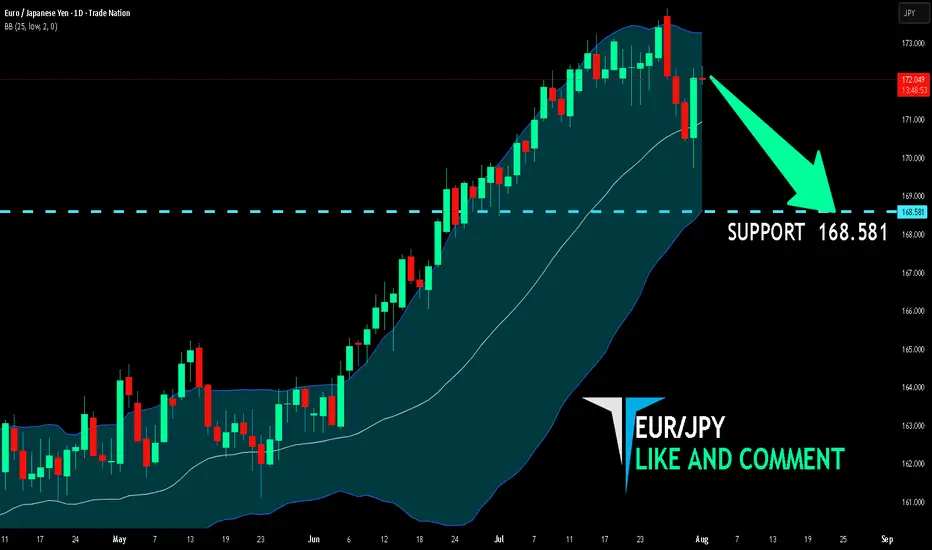
EUR/JPY BEARISH BIAS RIGHT NOW| SHORT
Hello, Friends!
We are now examining the EUR/JPY pair and we can see that the pair is going up locally while also being in a uptrend on the 1W TF. But there is also a powerful signal from the BB upper band being nearby, indicating that the pair is overbought so we can go short from the resistance line above and a target at 168.581 level.
Disclosure: I am part of Trade Nation's Influencer program and receive a monthly fee for using their TradingView charts in my analysis.
✅LIKE AND COMMENT MY IDEAS✅
EURJPY
EURJPY Bullish Setup : EURJPY Forecast + Demand Zone🧠 Introduction: What's Happening on the Chart?
Today’s analysis on EURJPY is built on the MMC trading framework, which emphasizes the identification of institutional supply and demand zones, reaction points, QFL patterns, and volume bursts to map out high-probability trading paths.
We are currently observing a market in a corrective phase following a significant bearish drop. However, the presence of a major demand zone, along with a positive bullish pattern, suggests potential upside reversal or at least a short-term retracement.
🔍 Technical Breakdown – Zone by Zone
🔻 1. The Drop from 2x Supply Zone
EURJPY experienced a significant decline from the 173.60–174.00 area, which acted as a 2x confirmed supply zone.
Sellers took control with strong bearish candles that broke through previous minor support levels.
This drop was impulsive, showing momentum-driven selling, often linked with institutional activity.
🟩 2. Demand Reaction at Major Zone
Price entered a key demand zone marked in green (170.80–171.00), where historically buyers have stepped in.
A "Volume Burst" is visible here—large volume candles with long wicks to the downside, which typically indicate accumulation.
A positive pattern (possibly engulfing or a pin bar structure) has formed, signaling a potential bullish reversal or relief rally.
🧱 3. QFL Structure (Quantum Flat Line)
The chart highlights a QFL base, where the price consolidates after an initial drop, then continues lower before a sharp bounce.
QFL is often used to identify trap zones where retail traders are shaken out, and smart money enters.
The recent bounce from the QFL base suggests smart money might be accumulating for a reversal move.
📐 Key Levels and Zones
Type Zone/Level Role
🔵 Volume Burst Area ~170.80–171.00 Aggressive buyer entry; accumulation zone
🟢 Major Demand 170.80–171.20 Key structural low supporting bullish bias
🟠 SR Flip Zone 171.80–172.00 Crucial breakout/retest level
🔴 Minor Resistance 172.60–173.00 Short-term pullback zone
🟥 2x Supply 173.60–174.00 Strong reversal point; ideal target
🔁 Scenarios to Watch
📈 Scenario 1: Bullish Breakout and Rally (Blue Box 1)
If price breaks above 172.00, we expect:
A potential retest (bullish confirmation).
Continuation toward minor resistance at 173.00, and possibly the 2x supply zone at 174.00.
This aligns with the positive pattern formed at the base and the idea of a market rotation from bearish to bullish structure.
📉 Scenario 2: Rejection and Retest of Lows (Blue Box 2)
If the price fails to sustain above 172.00, sellers may step in:
Price could revisit the major demand zone again or even break down to 170.50.
This would invalidate the bullish setup in the short term and imply a larger continuation of the bearish trend.
🧠 Strategic Insights (MMC-Based Thinking)
The MMC approach teaches us to mirror the market’s emotion and behavior.
In this case, we see signs of:
Panic selling → smart money accumulation.
Institutional traps (QFL drop) → bullish absorption.
Traders applying MMC would anticipate reactive setups at the SR Flip Zone to determine next directional bias.
💡 Trade Ideas (For Educational Purposes Only)
Strategy Entry SL TP1 TP2
Aggressive Long 171.30–171.50 170.70 172.50 173.50
Breakout Retest Long 172.10 (after breakout) 171.50 173.00 174.00
Sell on Rejection 172.00 (bearish confirmation) 172.60 171.00 170.40
📌 Conclusion & Final Thoughts
EURJPY is showing a potential bullish reversal setup from a well-defined demand zone, supported by volume bursts and positive price action patterns. However, the SR Zone at 172.00 remains the key pivot—how the price reacts here will determine whether we see a deeper pullback or a continuation to test upper resistance levels.
Stay flexible and responsive. Let the market give confirmation before execution. As always, follow proper risk management and trade the reaction, not the prediction.
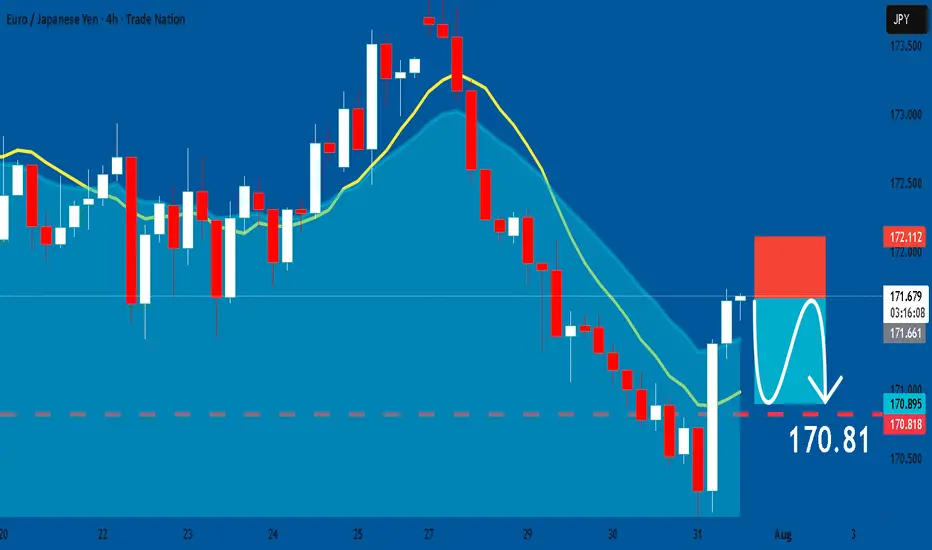
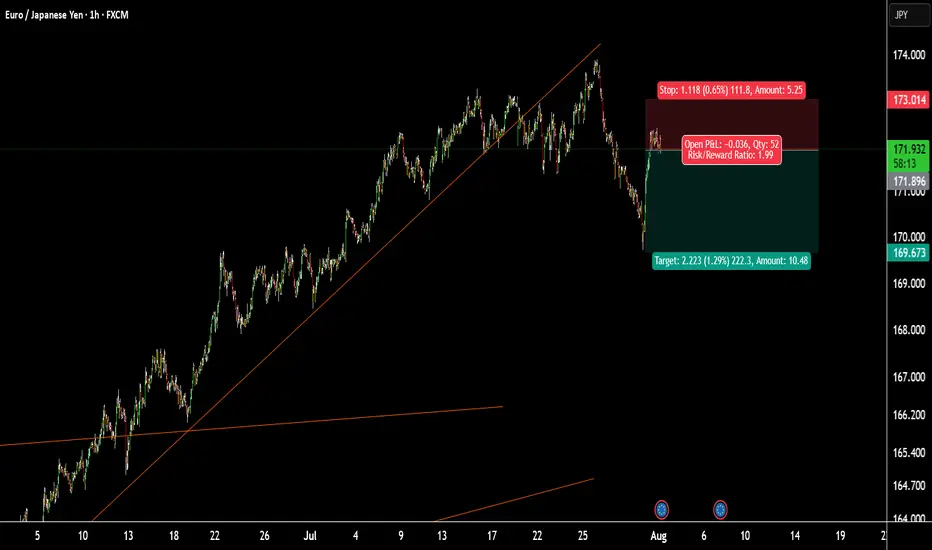
EURJPY: Short Trade Explained
EURJPY
- Classic bearish formation
- Our team expects pullback
SUGGESTED TRADE:
Swing Trade
Short EURJPY
Entry - 171.66
Sl - 172.11
Tp - 170.81
Our Risk - 1%
Start protection of your profits from lower levels
Disclosure: I am part of Trade Nation's Influencer program and receive a monthly fee for using their TradingView charts in my analysis.
❤️ Please, support our work with like & comment! ❤️
How I’m Trading the EURJPY Break of Structure Setup📈 EURJPY Analysis Update 🔍
I'm currently watching EURJPY closely. On the weekly timeframe, the pair is clearly in a strong bullish trend 🚀. Price has recently tapped into a previous daily bullish order block 🧱 — a key zone of interest.
Now, I’m watching for a break of structure (BoS) 📉 followed by a bullish continuation, especially if price pulls back into the fair value gap (FVG) 📊 near the current low.
As always, this setup — along with all key details and trade considerations — is fully broken down in the 🎥 video.
⚠️ This is for educational purposes only and not financial advice.

Trading the Pullback on EURJPY My Trade PlanThe EURJPY is clearly in a strong bullish trend 📈, as shown by a consistent pattern of higher highs and higher lows on the 1H timeframe ⏱️. In this video, I’m looking to capitalize on a pullback as a potential buy opportunity 🎯.
We dive into my entry strategy, explore how to align with the prevailing trend, and break down key concepts such as price action, market structure, and smart pullback zones 🧠📊.
⚠️ As always, this is for educational purposes only — not financial advice.

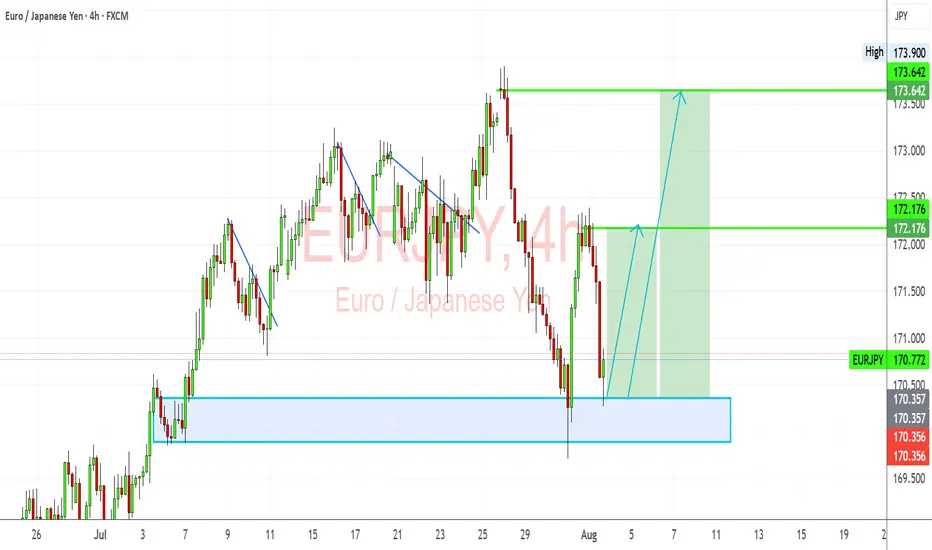
EURJPY: Bullish Rebound from Key Demand ZoneEURJPY has bounced off a critical demand zone and is showing signs of a bullish recovery. Despite the recent pullback, the pair’s structure remains fundamentally and technically bullish, driven by JPY weakness and EUR resilience.
Technical Analysis (4H Chart)
Pattern: Price tested a strong demand zone near 170.35–170.50 and rejected it aggressively.
Current Level: 170.77, starting a potential bullish leg toward higher resistance levels.
Key Support Levels:
170.35 – key demand zone and invalidation level for bulls.
169.90 – deeper support if demand zone breaks.
Resistance Levels:
172.17 – first bullish target and interim resistance.
173.64 – major target if bullish continuation sustains.
Projection: A successful rebound from 170.35 could drive price toward 172.17 initially, then 173.64 if momentum holds.
Fundamental Analysis
Bias: Bullish.
Key Fundamentals:
EUR: ECB’s slower path toward easing supports EUR stability relative to JPY.
JPY: Weakness persists as BoJ maintains dovish bias, though FX intervention risk limits JPY downside speed.
Global Sentiment: Mild risk-on mood supports EUR strength against JPY.
Risks:
BoJ verbal intervention or actual FX intervention could trigger temporary JPY strength.
Sharp reversal in global risk sentiment could weaken EUR/JPY.
Key Events:
ECB speeches and data (CPI, growth updates).
BoJ FX comments and broader market risk appetite.
Leader/Lagger Dynamics
EUR/JPY is a leader among JPY pairs, often moving in sync with GBP/JPY and CHF/JPY. Its movement also tends to precede confirmation in risk-sensitive JPY crosses.
Summary: Bias and Watchpoints
EUR/JPY is bullish from the 170.35 demand zone, with a potential move toward 172.17 and 173.64. Key watchpoints include ECB communication, BoJ stance, and market risk sentiment. As long as 170.35 holds, bulls remain in control.
EURJPY SELLas the main trend line is brake and the lower low is accepted. I think it moves down and good for sell
EURJPY
EURJPY SWEET BLUESEurjpy has hit all take profits with very little drawdown and huge profits very quickly nice pattern, simply followed
UP TREND EURJPYEurjpy will be buying and scalping will be moving my SL to BE or swing with it all the way to the top as it cannot sell forever
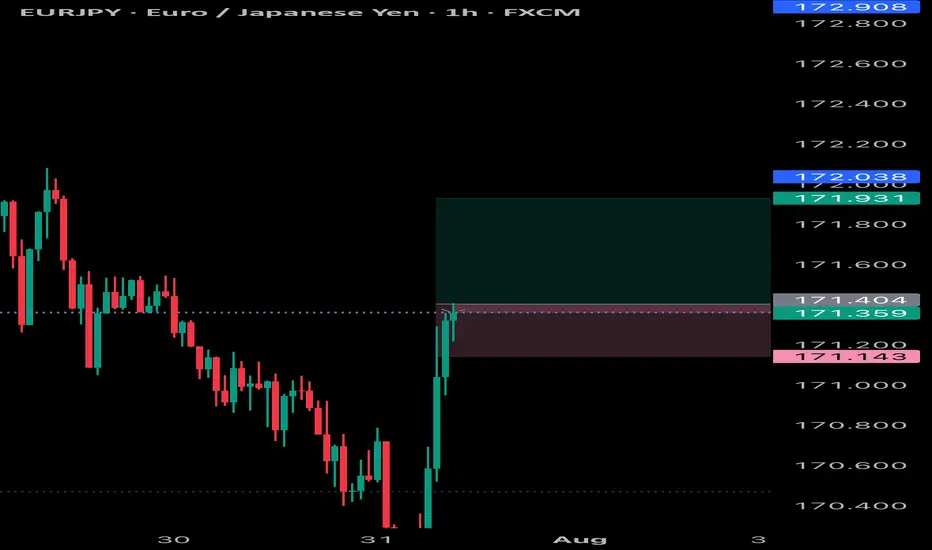
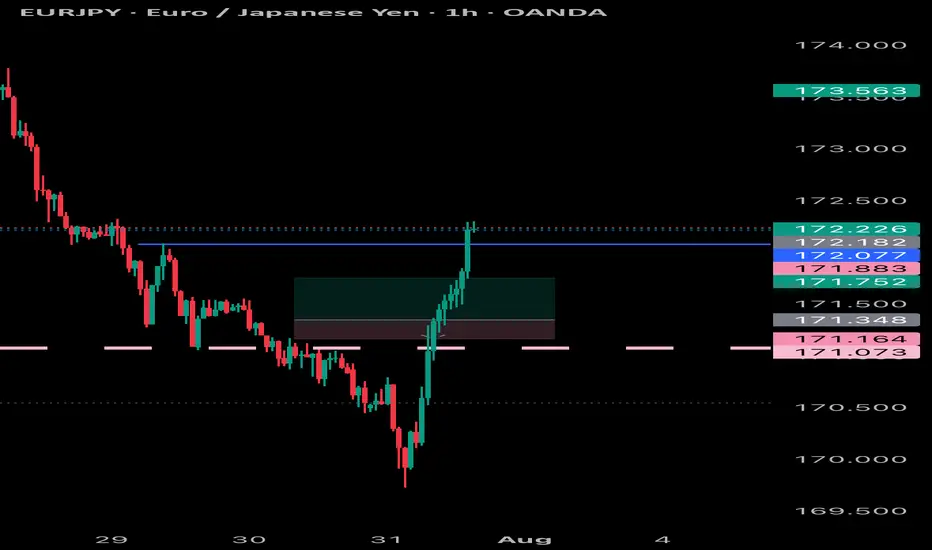
EURJPY 300+ PIP DROPFrom the beginning of the week i have called out shorts on EJ into 170.000 in the video we can see price hit that support and hitting target for a few positions and entry i called out during the week and also some key points for your personal trading

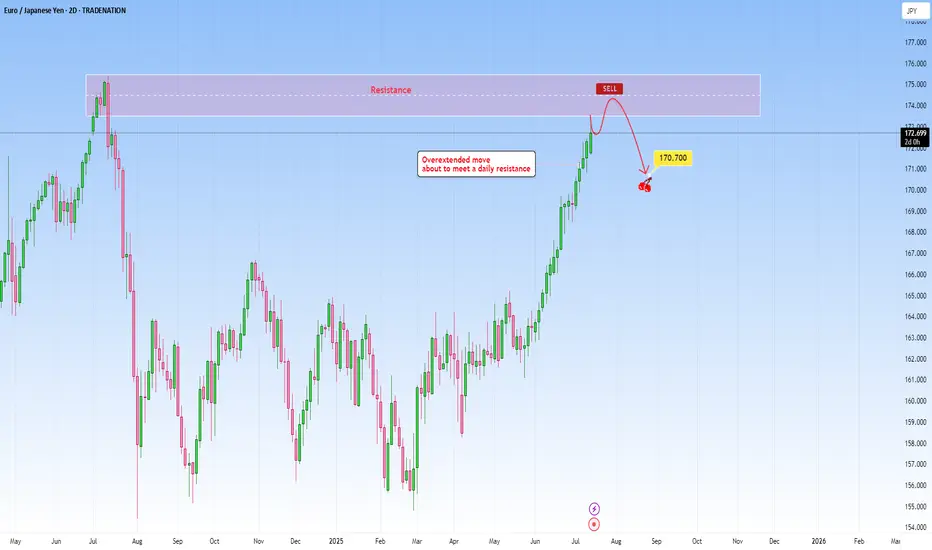
EURJPY: Overextended move to meet daily resistanceThe current market context on EURJPY shows an overextended move that has been pushing higher as price is about to reach a well-established daily resistance. The rally into this resistance lacks healthy retracements, and momentum is likely unsustainable without a deeper correction. The probability of a pause or reversal here under this circumstances increases substantially.
This extension exaggerates this imbalance making it a high probability setup. Volume and price action near this level becomes critical in this case. Signs such as long upper wicks, bearish engulfing patterns will hint that the move may be running out of steam.
I would be targeting a decent pullback towards 170.700.
Just sharing my thoughts for the charts, this isn’t financial advice. Always confirm your setups and manage your risk properly.
Disclosure: I am part of Trade Nation's Influencer program and receive a monthly fee for using their TradingView charts in my analysis.
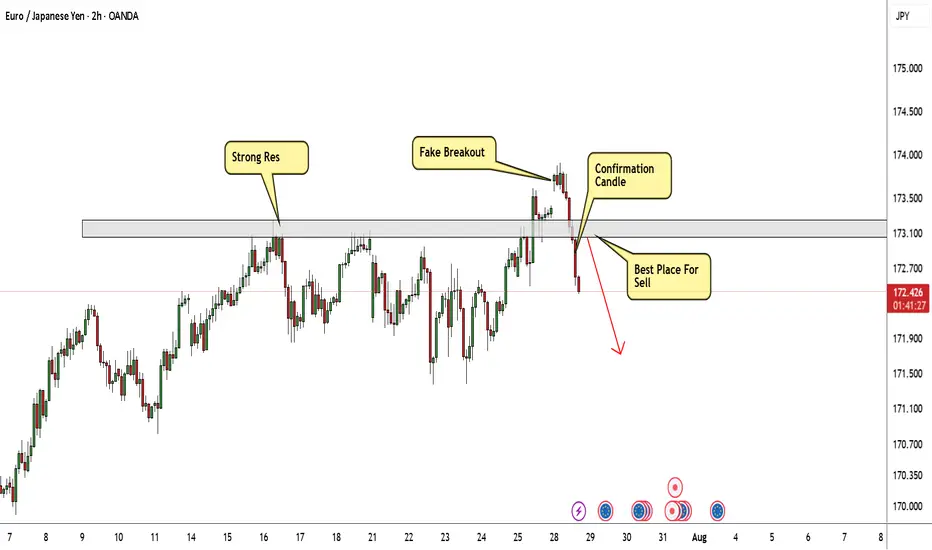
EUR/JPY Again Below My Res , Short Setup Valid To Get 150 Pips !Here is my opinion on EUR/JPY On 2H T.F , We have a fake breakout and Gap and the price back again below my res area and closed with 4H Candle below it , so i have a confirmation and i`m waiting the price to go back to retest this strong res and give me any bearish price action and then we can enter a sell trade and targeting 100 : 150 pips . if we have a daily closure above my res then this analysis will not be valid anymore .
EURJPY ANALYSISAfter seeing the daily still pushing to the downside and breaking below key support of 171.250 we could be looking out for a retest and continuation to the down side target of 170.000

JPY at Key Zone – EURJPY & GBPJPY Could Drop 1k+ PipsExactly one year ago, the JPY Currency Index broke above the falling trendline of a falling wedge, signaling the end of a bearish cycle that had lasted nearly five years.
As is typical after long-term reversals, the reaction was sharp and fast, and the price quickly reached the first resistance target of the pattern.
Since then, the index entered a lateral phase, with clear support forming around the 730 zone.
________________________________________
🔍 Current Price Action
Recently, the price pulled back to test that same support, and at the time of writing it sits at 737, forming a tight consolidation.
This suggests we’re again at an inflection point.
________________________________________
📊 Trade Outlook
From a medium-term perspective, I believe the index is preparing for another leg higher, potentially toward resistance at 780.
➡️ That would mean a 7% rise on the JPY Index – and this move could translate into more than 1,000 pips of downside for pairs like EURJPY and GBPJPY.
________________________________________
🔄 What’s Next?
In the coming sessions, I’ll focus on these two pairs as they offer the clearest setups and have the strongest volatility.
Stay tuned — follow for the next updates. 🚀

EUROYENEurjpy has shorter pullbacks within an ascending structure ,shall keep following it and expect it to reach a fair mount of highs or levels
EURJPY SCALP Eurjpy quick scalp trade as it can still drop so it would be wise to not target higher than normal take profits , but will scalp it
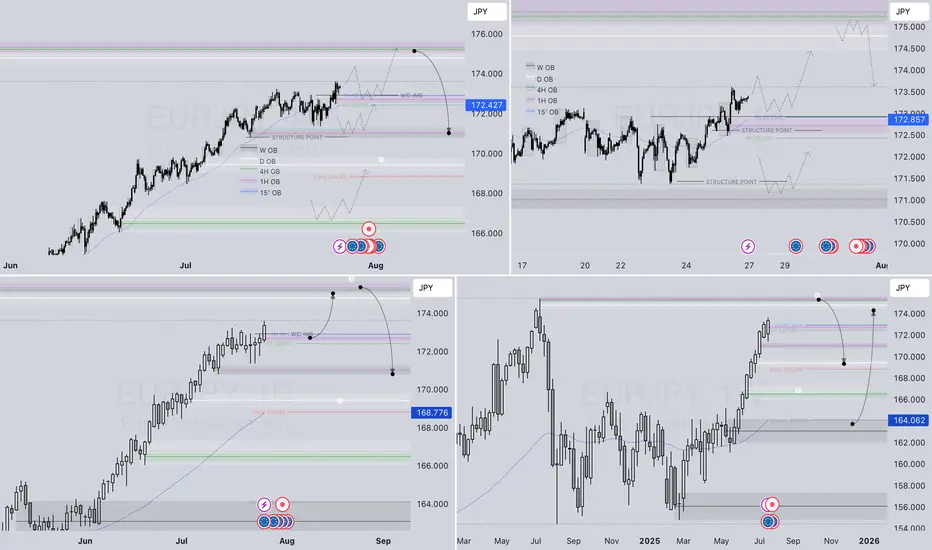
EURJPY – DAILY FORECAST Q3 | W31 | D29 | Y25📊 EURJPY – DAILY FORECAST
Q3 | W31 | D29 | Y25
Daily Forecast 🔍📅
Here’s a short diagnosis of the current chart setup 🧠📈
Higher time frame order blocks have been identified — these are our patient points of interest 🎯🧭.
It’s crucial to wait for a confirmed break of structure 🧱✅ before forming a directional bias.
This keeps us disciplined and aligned with what price action is truly telling us.
📈 Risk Management Protocols
🔑 Core principles:
Max 1% risk per trade
Only execute at pre-identified levels
Use alerts, not emotion
Stick to your RR plan — minimum 1:2
🧠 You’re not paid for how many trades you take, you’re paid for how well you manage risk.
🧠 Weekly FRGNT Insight
"Trade what the market gives, not what your ego wants."
Stay mechanical. Stay focused. Let the probabilities work.
OANDA:EURJPY

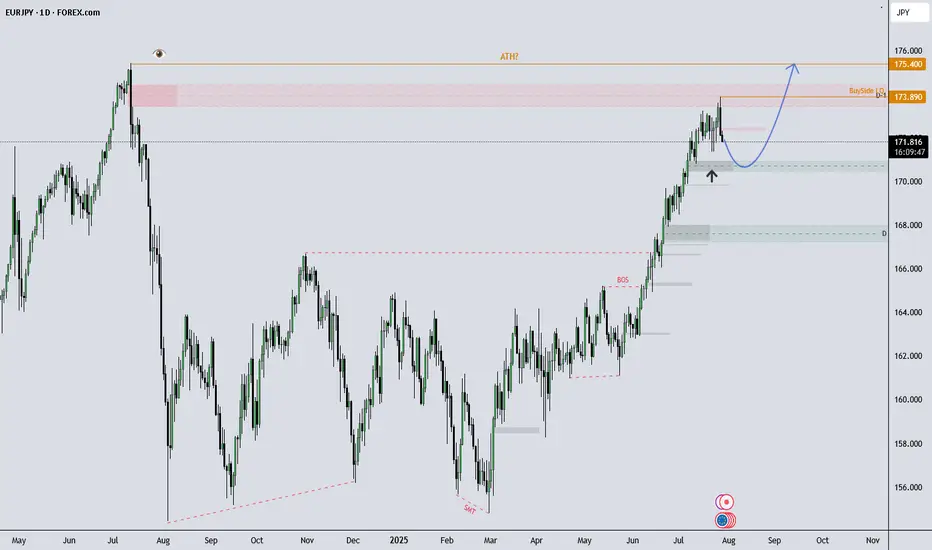
EURJPY Eyes New Highs After Pullback?What I see!
EURJPY Technical Outlook –
EURJPY remains in a strong uptrend and recently tapped into buy-side liquidity at 173.89, which now marks the All-Time High (ATH). After a brief rejection from that level, price is currently showing signs of a healthy pullback.
I’m observing the 170.00–171.00 zone, which aligns with previous demand. If price continues to respect this area, the overall bullish structure remains intact, with potential for a move back toward (and possibly beyond) the ATH.
A sustained break below 170.00 could indicate room for a deeper pullback, potentially toward the 168.00s, which would be a key area to monitor.
This analysis is shared for educational and discussion purposes only.
EURJPY Sellers In Panic! BUY!
My dear friends,
Please, find my technical outlook for EURJPY below:
The price is coiling around a solid key level - 172.51
Bias - Bullish
Technical Indicators: Pivot Points Low anticipates a potential price reversal.
Super trend shows a clear buy, giving a perfect indicators' convergence.
Goal - 173.00
Safe Stop Loss - 172.29
About Used Indicators:
The pivot point itself is simply the average of the high, low and closing prices from the previous trading day.
Disclosure: I am part of Trade Nation's Influencer program and receive a monthly fee for using their TradingView charts in my analysis.
———————————
WISH YOU ALL LUCK

EURJPY – DAILY FORECAST Q3 | W31 | D28 | Y25📊 EURJPY – DAILY FORECAST
Q3 | W31 | D28 | Y25
Daily Forecast 🔍📅
Here’s a short diagnosis of the current chart setup 🧠📈
Higher time frame order blocks have been identified — these are our patient points of interest 🎯🧭.
It’s crucial to wait for a confirmed break of structure 🧱✅ before forming a directional bias.
This keeps us disciplined and aligned with what price action is truly telling us.
📈 Risk Management Protocols
🔑 Core principles:
Max 1% risk per trade
Only execute at pre-identified levels
Use alerts, not emotion
Stick to your RR plan — minimum 1:2
🧠 You’re not paid for how many trades you take, you’re paid for how well you manage risk.
🧠 Weekly FRGNT Insight
"Trade what the market gives, not what your ego wants."
Stay mechanical. Stay focused. Let the probabilities work.
OANDA:EURJPY

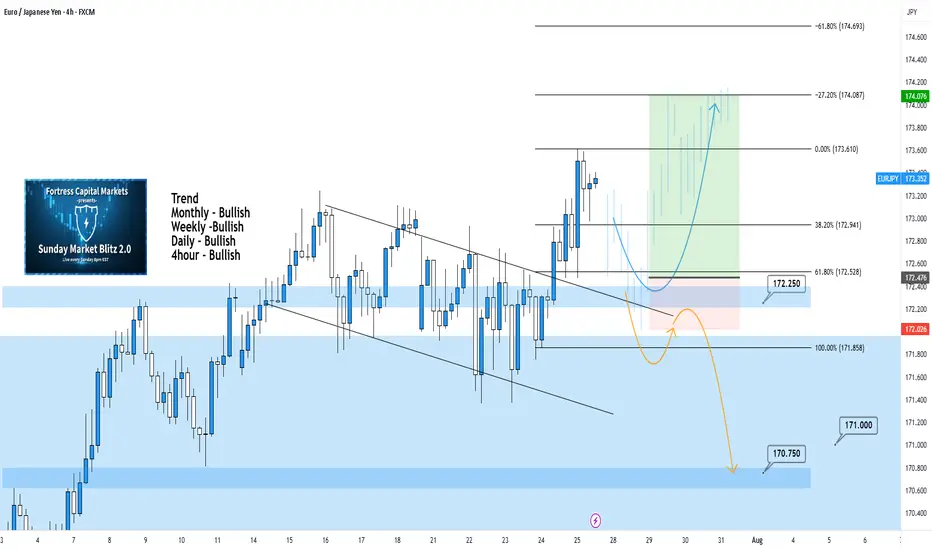
EURJPY 4Hour TF - July 27th, 2025EURJPY 7/27/2025
EURJPY 4hour Bullish Idea
Monthly - Bullish
Weekly - Bullish
Daily - Bullish
4hour - Bullish
All timeframes suggest we are bullish and after last week that is clear. We’re expecting a bit of a pullback but let’s get into two potential setups for the week ahead:
Bullish Continuation - If we are to continue with the bullish trend we would like to enter a trade at the next point of structure. In this scenario, the next point of structure would be a higher low as close to 172.250 support & our 61.8% fib level as possible.
Look to target higher toward our -27% fib level if this happens.
Bearish Reversal - For us to consider EJ bearish again we would need to see a strong break below our support at 172.250.
If we see bearish structure below this zone we can say price action will most likely fall lower, potentially down to 170.750.
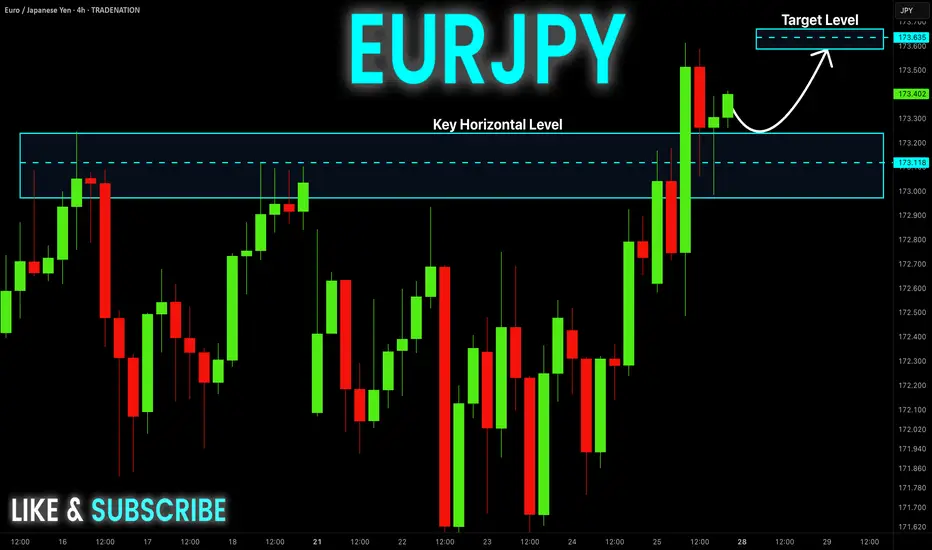
EUR-JPY Local Long! Buy!
Hello,Traders!
EUR-JPY is trading in an
Uptrend and the pair made
A breakout, a retest and
A bullish rebound from the
Horizontal support of 173.200
So we are bullish biased and
We will be expecting a
Further bullish move up
On Monday!
Buy!
Comment and subscribe to help us grow!
Check out other forecasts below too!
Disclosure: I am part of Trade Nation's Influencer program and receive a monthly fee for using their TradingView charts in my analysis.
EURJPY – WEEKLY FORECAST Q3 | W31 | Y25📊 EURJPY – WEEKLY FORECAST
Q3 | W31 | Y25
Weekly Forecast 🔍📅
Here’s a short diagnosis of the current chart setup 🧠📈
Higher time frame order blocks have been identified — these are our patient points of interest 🎯🧭.
It’s crucial to wait for a confirmed break of structure 🧱✅ before forming a directional bias.
This keeps us disciplined and aligned with what price action is truly telling us.
📈 Risk Management Protocols
🔑 Core principles:
Max 1% risk per trade
Only execute at pre-identified levels
Use alerts, not emotion
Stick to your RR plan — minimum 1:2
🧠 You’re not paid for how many trades you take, you’re paid for how well you manage risk.
🧠 Weekly FRGNT Insight
"Trade what the market gives, not what your ego wants."
Stay mechanical. Stay focused. Let the probabilities work.
OANDA:EURJPY