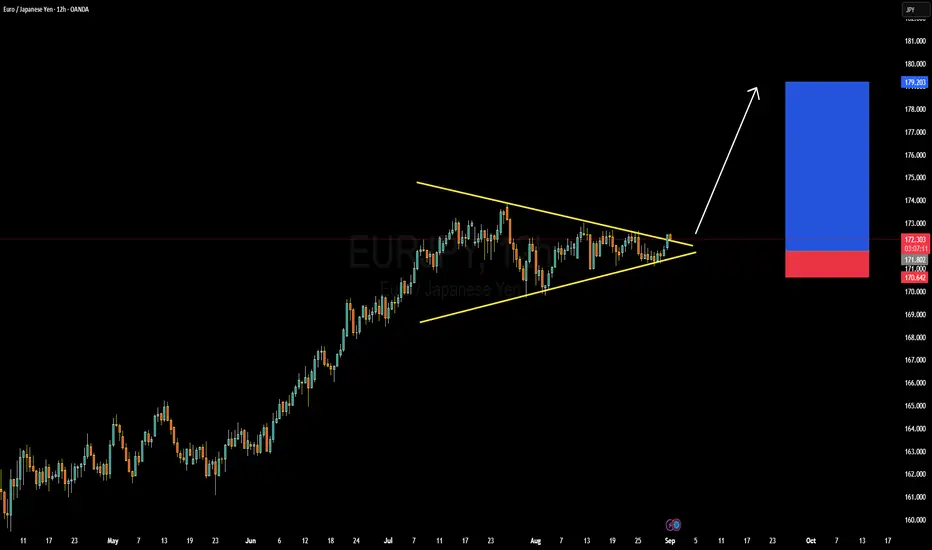
EURJPY Forming Symmetrical TriangleEURJPY is currently trading around 172.30, consolidating within a clear symmetrical triangle formation after a strong bullish rally from June. This pattern generally indicates accumulation before the next impulsive move, and given the dominant uptrend, the probability leans toward a bullish breakout. The immediate resistance lies near 173.00, and a decisive close above this zone can trigger continuation toward the 179.20 level, aligning with the projected target area shown on the chart. On the downside, 171.00 and 170.60 remain the key supports that protect the bullish structure.
From a fundamental perspective, the euro is finding support as investors focus on upcoming ECB policy signals, especially with inflation across the eurozone still above the bank’s comfort zone. Meanwhile, the yen remains under pressure as the Bank of Japan continues to maintain its ultra-loose monetary stance despite slight interventions to limit yen weakness. The widening interest rate differential keeps favoring EURJPY upside momentum, while safe-haven flows into JPY have been limited with global risk sentiment still steady.
The technical compression within this triangle combined with strong fundamentals creates a setup for potential volatility expansion in the coming sessions. A bullish breakout could attract momentum buyers and carry traders, targeting the 179–180 zone. However, if price slips back below 171.00, it would indicate short-term weakness and invite corrective moves before any continuation.
This pair remains one of the most attractive for trend-following strategies, with the carry trade advantage supporting euro strength against the yen. Traders should monitor the breakout direction closely, as the next leg will likely set the tone for September’s trading.
Eurjpy!
GBP/JPY, EUR/JPY Bulls Eye Breakout, USD/JPY RangingLooking at market positioning, I outline why I think futures traders are anticipating a stronger Japanese yen in the coming weeks. Though as you'll see on the daily charts, momentum is currently against yen bulls with USD/JPY lifting from its range lows and both EUR/JPY and GBP/JPY eyeing bullish breakouts.
Matt Simpson, Market Analyst at City Index and Forex.com

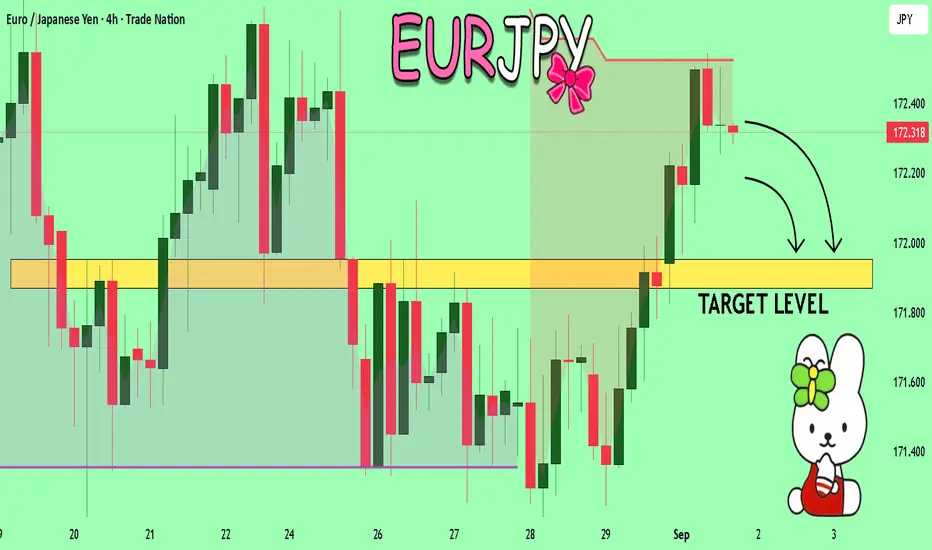
EURJPY Under Pressure! SELL!
My dear subscribers,
EURJPY looks like it will make a good move, and here are the details:
The market is trading on 172.30 pivot level.
Bias - Bearish
Technical Indicators: Both Super Trend & Pivot HL indicate a highly probable Bearish continuation.
Target - 171.95
About Used Indicators:
The average true range (ATR) plays an important role in 'Supertrend' as the indicator uses ATR to calculate its value. The ATR indicator signals the degree of price volatility.
Disclosure: I am part of Trade Nation's Influencer program and receive a monthly fee for using their TradingView charts in my analysis.
———————————
WISH YOU ALL LUCK
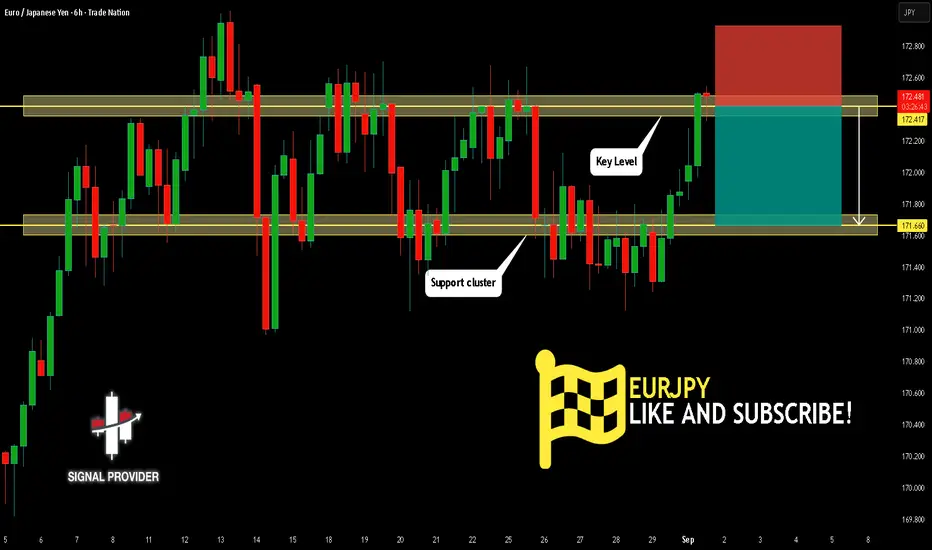
EURJPY Will Go Down! Short!
Please, check our technical outlook for EURJPY.
Time Frame: 6h
Current Trend: Bearish
Sentiment: Overbought (based on 7-period RSI)
Forecast: Bearish
The market is approaching a significant resistance area 172.417.
Due to the fact that we see a positive bearish reaction from the underlined area, I strongly believe that sellers will manage to push the price all the way down to 171.660 level.
P.S
The term oversold refers to a condition where an asset has traded lower in price and has the potential for a price bounce.
Overbought refers to market scenarios where the instrument is traded considerably higher than its fair value. Overvaluation is caused by market sentiments when there is positive news.
Disclosure: I am part of Trade Nation's Influencer program and receive a monthly fee for using their TradingView charts in my analysis.
Like and subscribe and comment my ideas if you enjoy them!
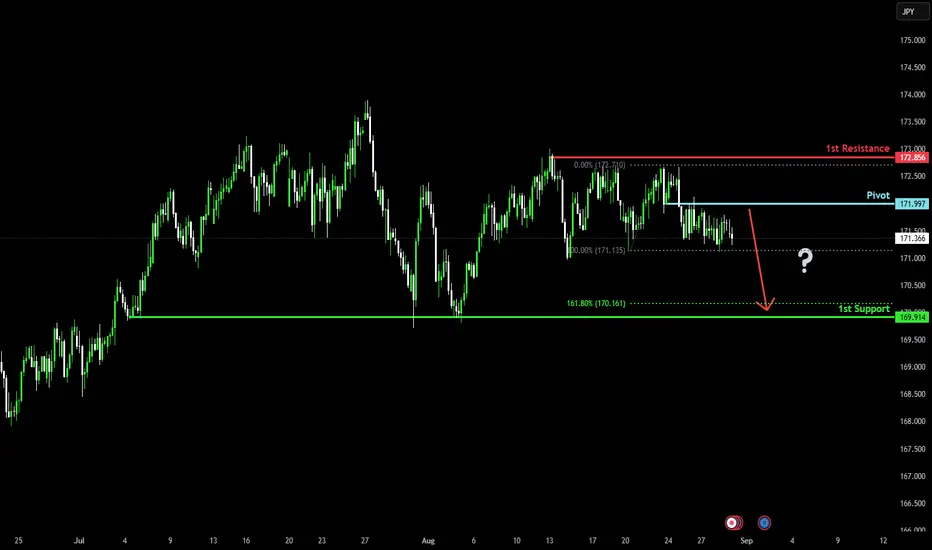
Bearish drop off pullback resistance?EUR/JPY has rejected off the pivot which has been identified as a pullback resistance and could drop to the major support.
Pivot: 171.99
1st Support: 169.91
1st Resistance: 172.85
Risk Warning:
Trading Forex and CFDs carries a high level of risk to your capital and you should only trade with money you can afford to lose. Trading Forex and CFDs may not be suitable for all investors, so please ensure that you fully understand the risks involved and seek independent advice if necessary.
Disclaimer:
The above opinions given constitute general market commentary, and do not constitute the opinion or advice of IC Markets or any form of personal or investment advice.
Any opinions, news, research, analyses, prices, other information, or links to third-party sites contained on this website are provided on an "as-is" basis, are intended only to be informative, is not an advice nor a recommendation, nor research, or a record of our trading prices, or an offer of, or solicitation for a transaction in any financial instrument and thus should not be treated as such. The information provided does not involve any specific investment objectives, financial situation and needs of any specific person who may receive it. Please be aware, that past performance is not a reliable indicator of future performance and/or results. Past Performance or Forward-looking scenarios based upon the reasonable beliefs of the third-party provider are not a guarantee of future performance. Actual results may differ materially from those anticipated in forward-looking or past performance statements. IC Markets makes no representation or warranty and assumes no liability as to the accuracy or completeness of the information provided, nor any loss arising from any investment based on a recommendation, forecast or any information supplied by any third-party.
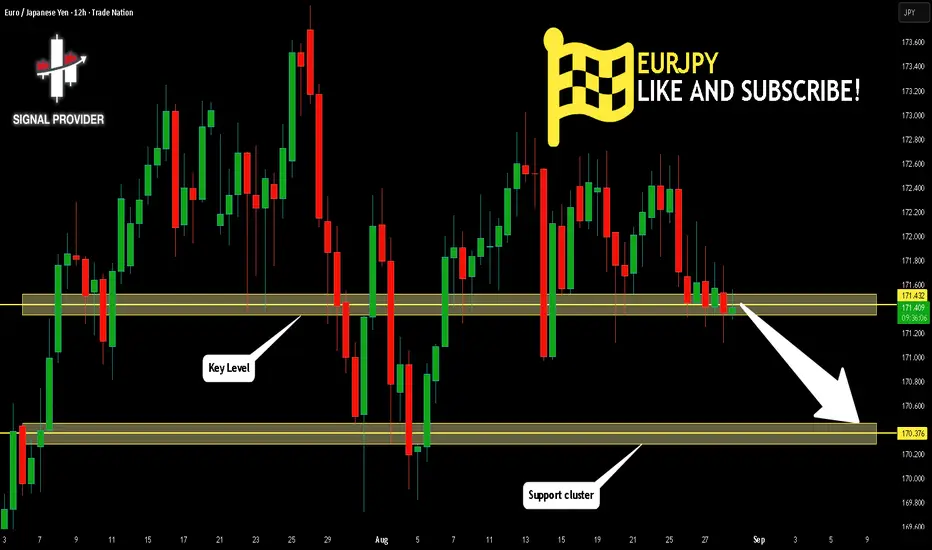
EURJPY Will Fall! Sell!
Take a look at our analysis for EURJPY.
Time Frame: 12h
Current Trend: Bearish
Sentiment: Overbought (based on 7-period RSI)
Forecast: Bearish
The price is testing a key resistance 171.432.
Taking into consideration the current market trend & overbought RSI, chances will be high to see a bearish movement to the downside at least to 170.376 level.
P.S
Overbought describes a period of time where there has been a significant and consistent upward move in price over a period of time without much pullback.
Disclosure: I am part of Trade Nation's Influencer program and receive a monthly fee for using their TradingView charts in my analysis.
Like and subscribe and comment my ideas if you enjoy them!
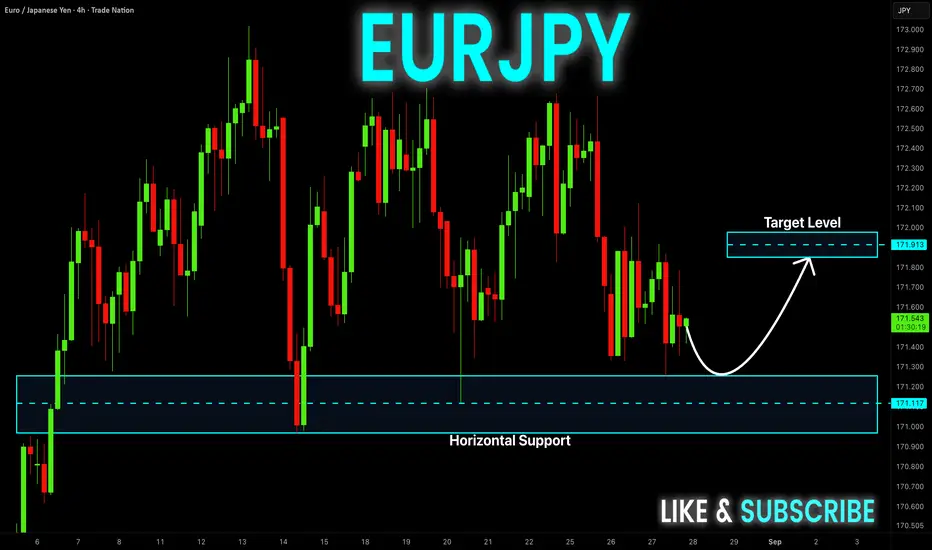
EUR-JPY Rebound Ahead! Buy!
Hello,Traders!
EUR-JPY will soon make
A retest of the horizontal
Support of 171.117 and
After that a local bullish
Rebound is to be expected
Buy!
Comment and subscribe to help us grow!
Check out other forecasts below too!
Disclosure: I am part of Trade Nation's Influencer program and receive a monthly fee for using their TradingView charts in my analysis.
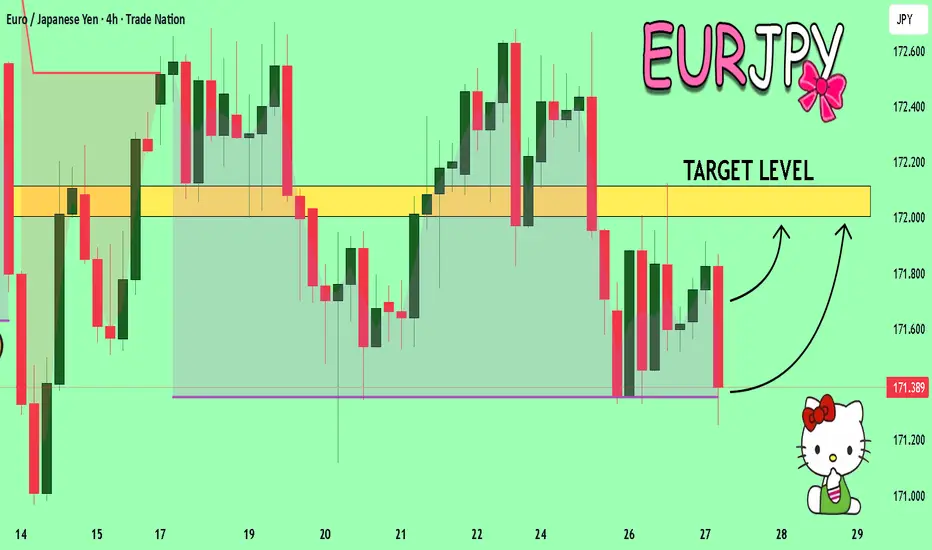
EURJPY My Opinion! BUY!
My dear followers,
This is my opinion on the EURJPY next move:
The asset is approaching an important pivot point 171.50
Bias - Bullish
Technical Indicators: Supper Trend generates a clear long signal while Pivot Point HL is currently determining the overall Bullish trend of the market.
Goal - 172.00
About Used Indicators:
For more efficient signals, super-trend is used in combination with other indicators like Pivot Points.
Disclosure: I am part of Trade Nation's Influencer program and receive a monthly fee for using their TradingView charts in my analysis.
———————————
WISH YOU ALL LUCK
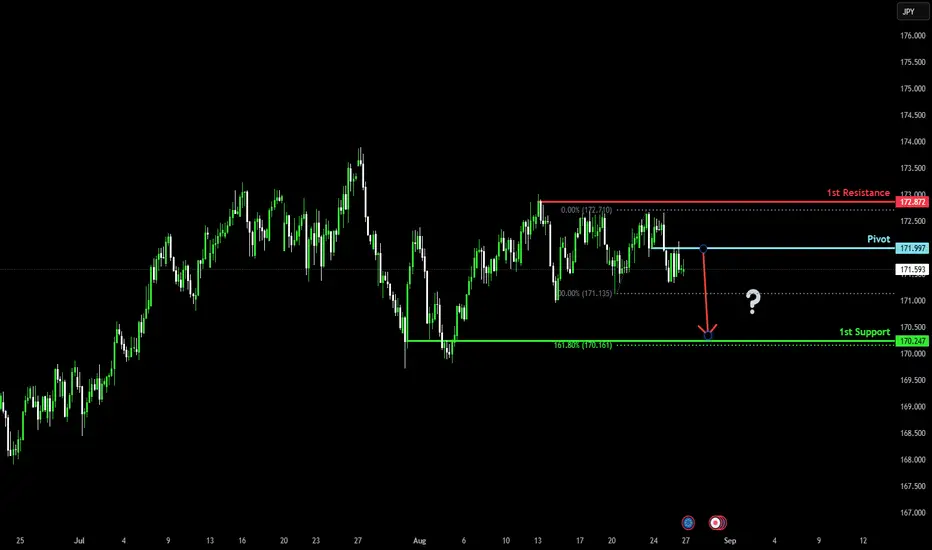
Bearish drop?EUR/JPY has rejected off the pivot which acts as a pullback resistance and could drop to the 1st support.
Pivot: 171.99
1st Support: 170.24
1st Reistance: 172.87
Risk Warning:
Trading Forex and CFDs carries a high level of risk to your capital and you should only trade with money you can afford to lose. Trading Forex and CFDs may not be suitable for all investors, so please ensure that you fully understand the risks involved and seek independent advice if necessary.
Disclaimer:
The above opinions given constitute general market commentary, and do not constitute the opinion or advice of IC Markets or any form of personal or investment advice.
Any opinions, news, research, analyses, prices, other information, or links to third-party sites contained on this website are provided on an "as-is" basis, are intended only to be informative, is not an advice nor a recommendation, nor research, or a record of our trading prices, or an offer of, or solicitation for a transaction in any financial instrument and thus should not be treated as such. The information provided does not involve any specific investment objectives, financial situation and needs of any specific person who may receive it. Please be aware, that past performance is not a reliable indicator of future performance and/or results. Past Performance or Forward-looking scenarios based upon the reasonable beliefs of the third-party provider are not a guarantee of future performance. Actual results may differ materially from those anticipated in forward-looking or past performance statements. IC Markets makes no representation or warranty and assumes no liability as to the accuracy or completeness of the information provided, nor any loss arising from any investment based on a recommendation, forecast or any information supplied by any third-party.
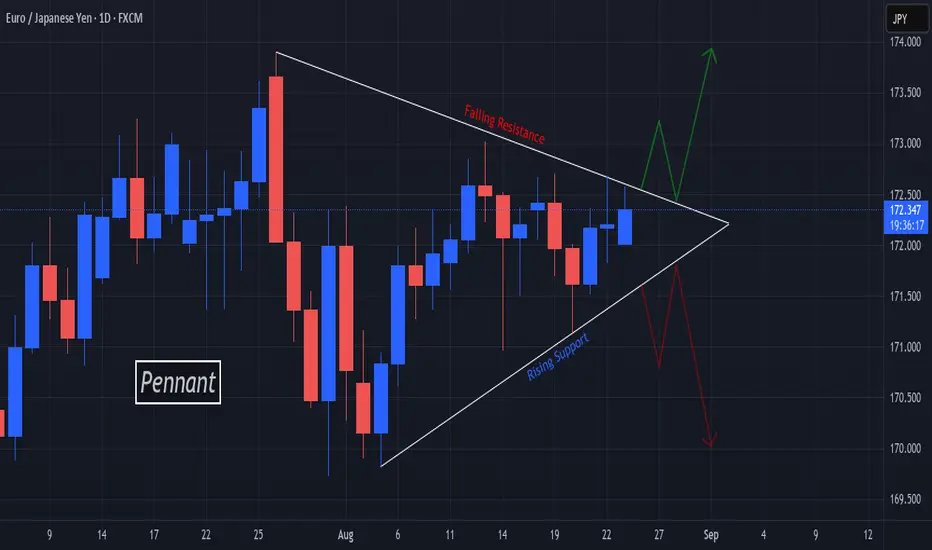
Battle Of Wicks Confirms Pennant On EJ, Which Leg Will Break?!Here on OANDA:EURJPY we can see Price has been volleyed back and forth between a Falling Resistance and Rising Support at similar degrees forming a Pennant Pattern!
Currently we can see the Consolidation is getting tight and likely to breakout soon, the question is which leg will break?!
Fundamentally EUR and JPY have news events littered throughout this week that will give us some good insight into both currencies corresponding economies, like Tokyo Core CPI y/y on Thursday, Aug. 28th with a Bearish forecast of 2.6%, down from 2.9%!
For now, we must wait for Price to give us a Breakout and Retest!
EURJPY QUICK TRADE Will be trading this pair and wait for it to give profits with minimum drawdown , always remember to close partials
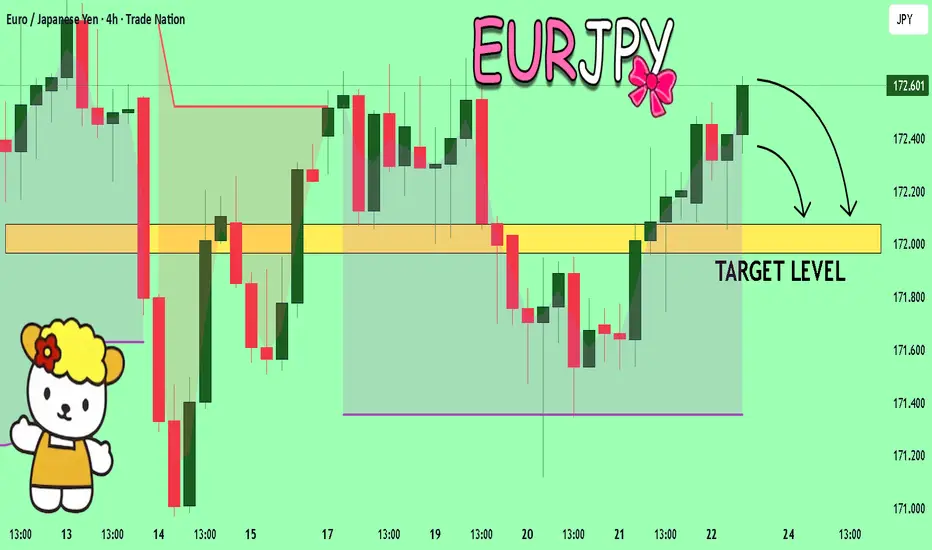
EURJPY Trading Opportunity! SELL!
My dear subscribers,
EURJPY looks like it will make a good move, and here are the details:
The market is trading on 172.60 pivot level.
Bias - Bearish
Technical Indicators: Both Super Trend & Pivot HL indicate a highly probable Bearish continuation.
Target - 172.07
About Used Indicators:
The average true range (ATR) plays an important role in 'Supertrend' as the indicator uses ATR to calculate its value. The ATR indicator signals the degree of price volatility.
Disclosure: I am part of Trade Nation's Influencer program and receive a monthly fee for using their TradingView charts in my analysis.
———————————
WISH YOU ALL LUCK
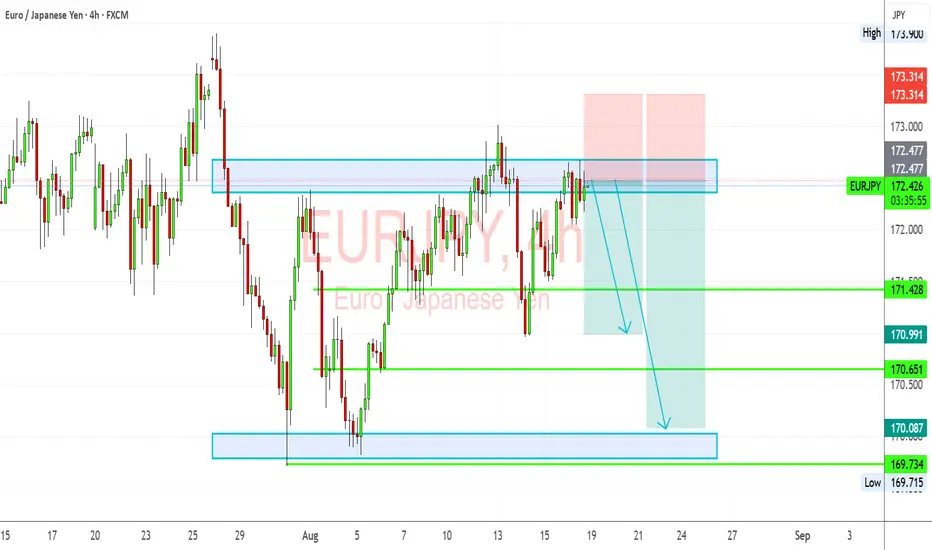
EURJPY Testing Supply Zone Can Bears Regain Control?EURJPY has climbed back into a key resistance area near 172.40–172.50, a zone that previously triggered sharp selling pressure. Price action suggests exhaustion at these highs, with a possible rotation back toward support if sellers defend this zone again. Given the yen’s safe-haven role and the euro’s sensitivity to ECB policy shifts, this setup is primed for a potential reversal play.
Current Bias
Bearish – The pair is showing rejection signs at resistance, favoring downside toward lower support levels.
Key Fundamental Drivers
ECB Outlook: The ECB is cautious, with slowing eurozone growth limiting room for further tightening, reducing euro strength.
BOJ Policy & Yen Flows: Yen remains supported by safe-haven demand and speculation around BOJ gradually tightening, even if modestly.
Risk Sentiment: Global equity volatility and tariff/geopolitical risks support yen buying when risk-off flows emerge.
Macro Context
Interest Rates: ECB is holding policy steady but leans dovish relative to other central banks. Japan remains ultra-loose, but any hint of normalization sparks yen strength.
Economic Growth: Eurozone growth is fragile, with Germany’s industrial sector under pressure. Japan’s economy is steady, though export-driven, making it vulnerable to global demand.
Geopolitics: Trade tariffs, US-China tensions, and Middle East risks all lean supportive for the yen as a safe haven.
Primary Risk to the Trend
A hawkish ECB surprise or strong eurozone inflation rebound could shift bias back to the upside, invalidating the bearish setup.
Most Critical Upcoming News/Event
ECB Minutes & Eurozone CPI Flash Estimate
BOJ Commentary on Yield Curve Control (YCC)
Leader/Lagger Dynamics
EURJPY tends to act as a lagger, following flows in broader yen crosses like USDJPY (as a leader) and EURUSD (for euro sentiment). Movements in EURJPY often confirm rather than lead directional bias in FX markets.
Key Levels
Support Levels: 171.42, 170.99, 170.65, 170.08, 169.73
Resistance Levels: 172.47, 173.31
Stop Loss (SL): 173.31 (above resistance zone)
Take Profit (TP):
TP1: 171.42
TP2: 170.65
TP3: 170.08
Summary: Bias and Watchpoints
Bias on EURJPY is bearish, with sellers looking to defend the 172.40–172.50 resistance area. A stop loss is best placed above 173.31, while downside targets stretch toward 171.42 → 170.65 → 170.08. Fundamentally, the euro faces growth headwinds while the yen benefits from safe-haven demand, though BOJ policy risks remain in play. The most important watchpoint is ECB and Eurozone CPI data, which could either reinforce the bearish case or shift sentiment sharply. For now, EURJPY looks vulnerable to a deeper correction, with price action aligned to favor sellers.
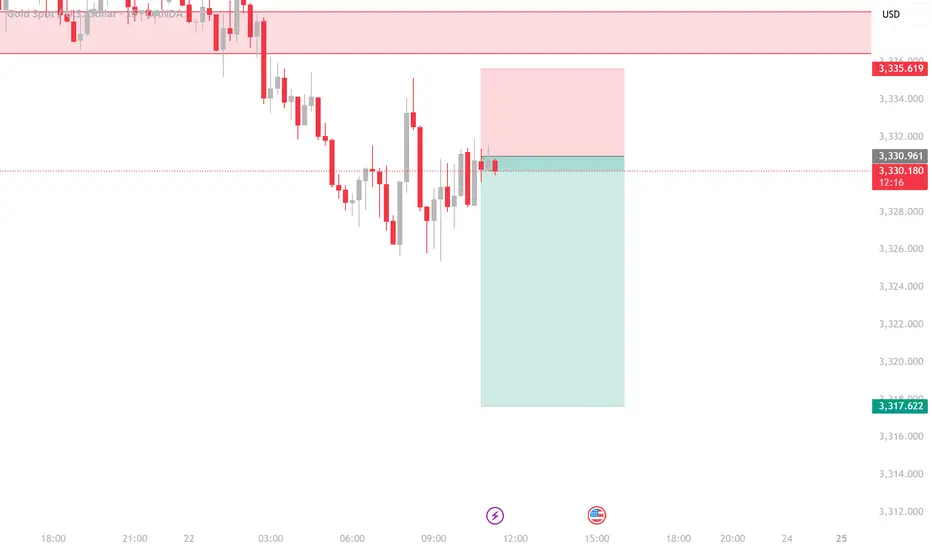
XAUUSD Short GoldGold good setup to execute short order,I see gold going even more down until 3302.
Subjected to market risks.Investors welcomed
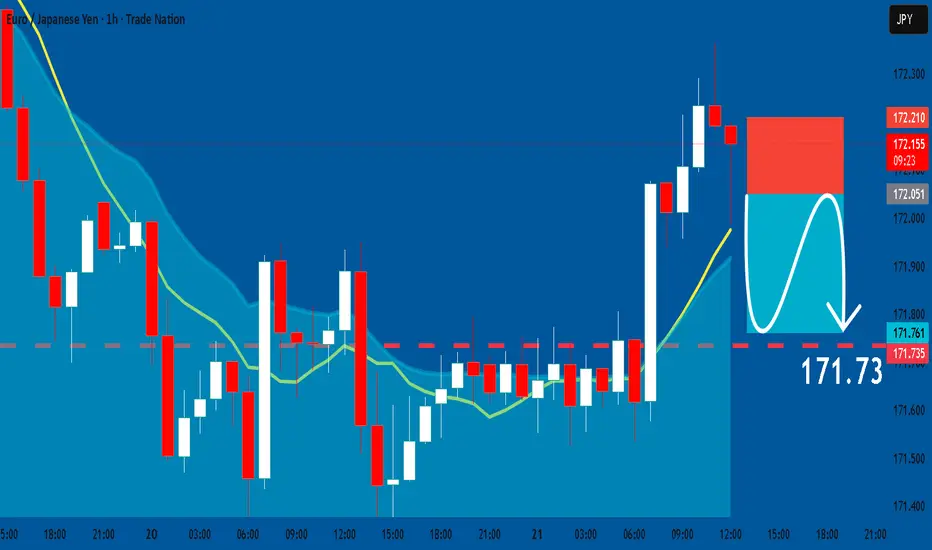
EURJPY: Bearish Continuation & Short Trade
EURJPY
- Classic bearish setup
- Our team expects bearish continuation
SUGGESTED TRADE:
Swing Trade
Short EURJPY
Entry Point - 172.05
Stop Loss - 172.21
Take Profit - 171.73
Our Risk - 1%
Start protection of your profits from lower levels
Disclosure: I am part of Trade Nation's Influencer program and receive a monthly fee for using their TradingView charts in my analysis.
❤️ Please, support our work with like & comment! ❤️
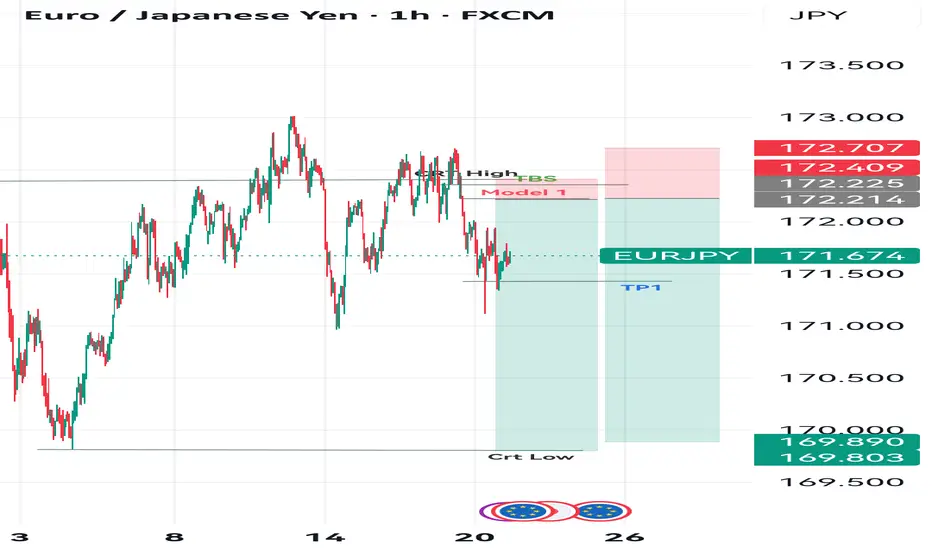
EURJPYUsing M/W CRT Model
Bearish Key Level Identified
High and low Marked out.
TBS Identified
Model 1 for entry.
Stop loss to previous High
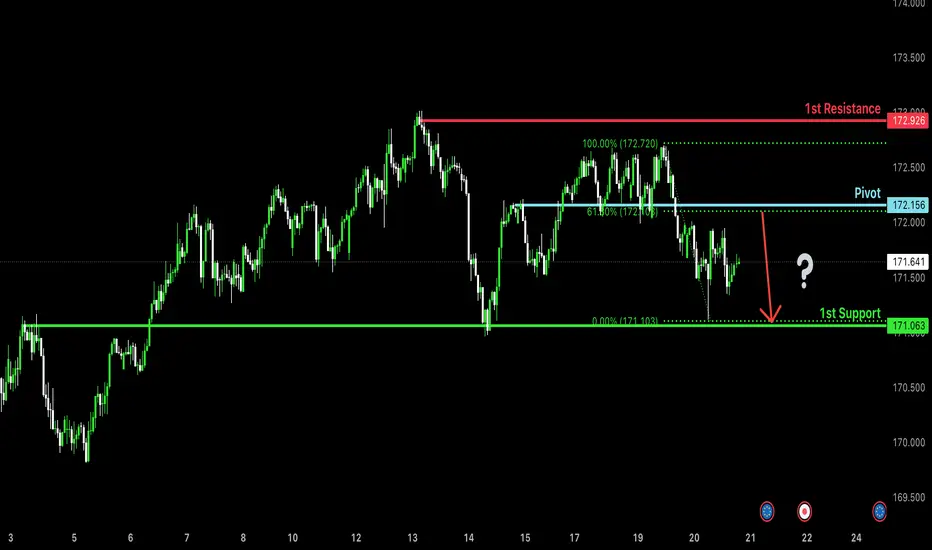
Bearish reversal off overlap resistance?EUR/JPY is rising towards the pivot, which is an overlap resistance, and could reverse to the 1st support, which acts as an overlap support.
Pivot: 172.15
1st Support: 171.06
1st Resistance: 172.92
Risk Warning:
Trading Forex and CFDs carries a high level of risk to your capital and you should only trade with money you can afford to lose. Trading Forex and CFDs may not be suitable for all investors, so please ensure that you fully understand the risks involved and seek independent advice if necessary.
Disclaimer:
The above opinions given constitute general market commentary, and do not constitute the opinion or advice of IC Markets or any form of personal or investment advice.
Any opinions, news, research, analyses, prices, other information, or links to third-party sites contained on this website are provided on an "as-is" basis, are intended only to be informative, is not an advice nor a recommendation, nor research, or a record of our trading prices, or an offer of, or solicitation for a transaction in any financial instrument and thus should not be treated as such. The information provided does not involve any specific investment objectives, financial situation and needs of any specific person who may receive it. Please be aware, that past performance is not a reliable indicator of future performance and/or results. Past Performance or Forward-looking scenarios based upon the reasonable beliefs of the third-party provider are not a guarantee of future performance. Actual results may differ materially from those anticipated in forward-looking or past performance statements. IC Markets makes no representation or warranty and assumes no liability as to the accuracy or completeness of the information provided, nor any loss arising from any investment based on a recommendation, forecast or any information supplied by any third-party.
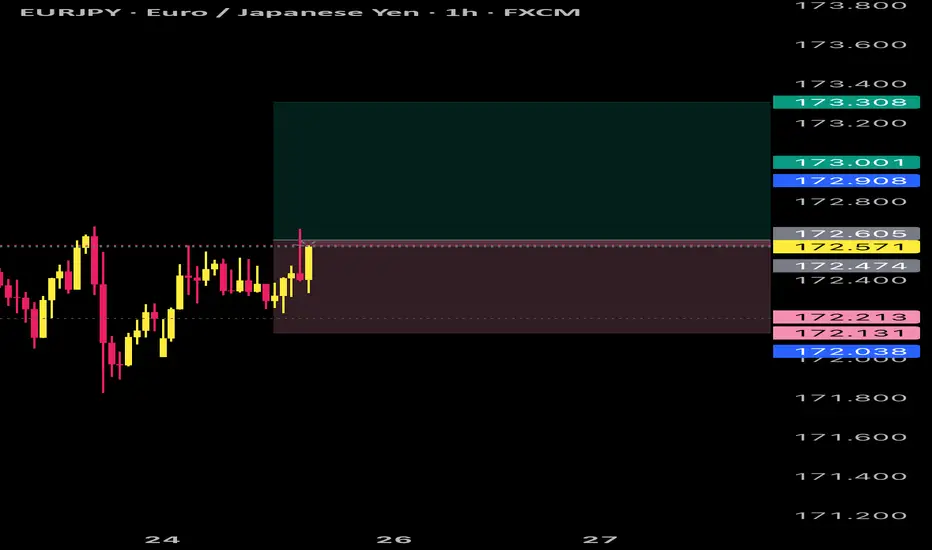
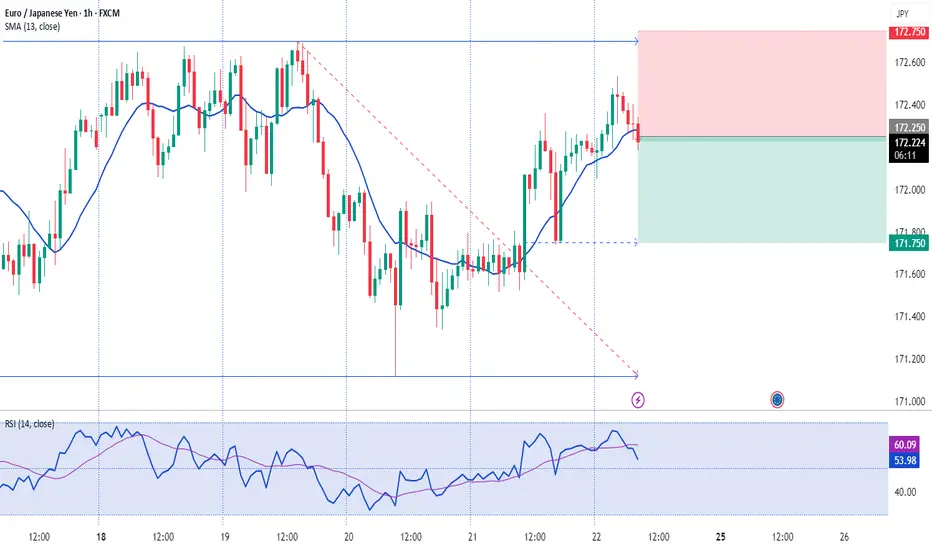
EURJPY Short SetupI’m looking for a short opportunity on EURJPY around 172.545. The pair is showing signs of exhaustion near recent highs, with momentum stalling at a key resistance zone. Structure suggests a potential reversal, supported by rejection wicks and weakening bullish follow-through.
Entry: 172.545
Stop Loss: 172.865 (above recent swing high / resistance)
Target: 170.000 (major support level & clean liquidity zone)
This setup offers a solid risk-to-reward ratio of roughly 1:8, targeting a move back toward the lower structure support. If price invalidates and closes above 172.865, I’ll consider this idea void.
📉 Bias remains short while below resistance.

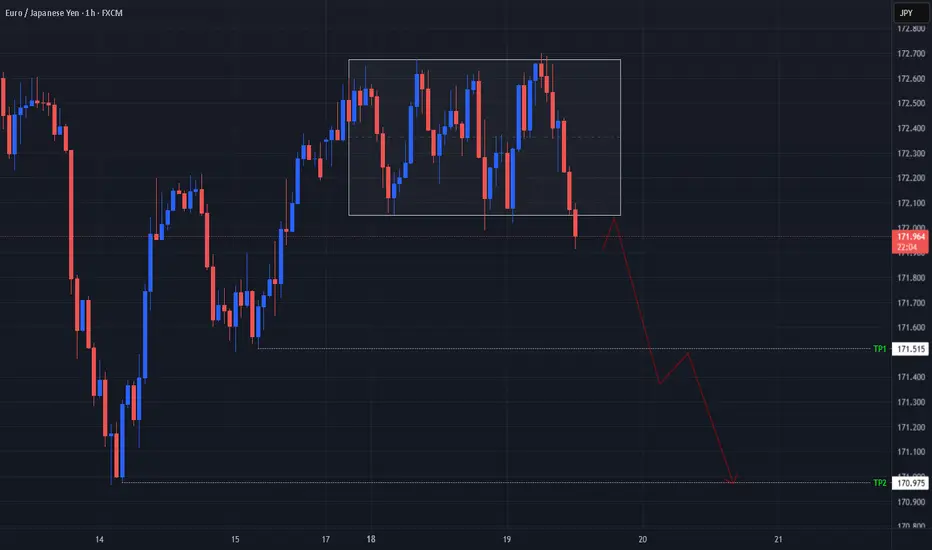
EJ Bears Breakout Of The BoxOANDA:EURJPY has been consolidating pretty tightly between Resistance and Support creating a Rectangle Pattern where Price has currently broken out to the downside!
If Price makes a Retest of the Breakout and is successfully rejected, this could deliver some potential Short Opportunities!!
After a Retest, Price has a couple Support Areas it could visit:
TP1 @ 171.515
TP2 @ 170.975
Ready To Raid The EUR/JPY? Bullish Breakout Plan Inside!🌟 ATTENTION ALL YEN YAKUZA & EURO EAGLES! 🌟
Dear Ladies & Gentleman of the High-Finance Underworld, 🕴️💎
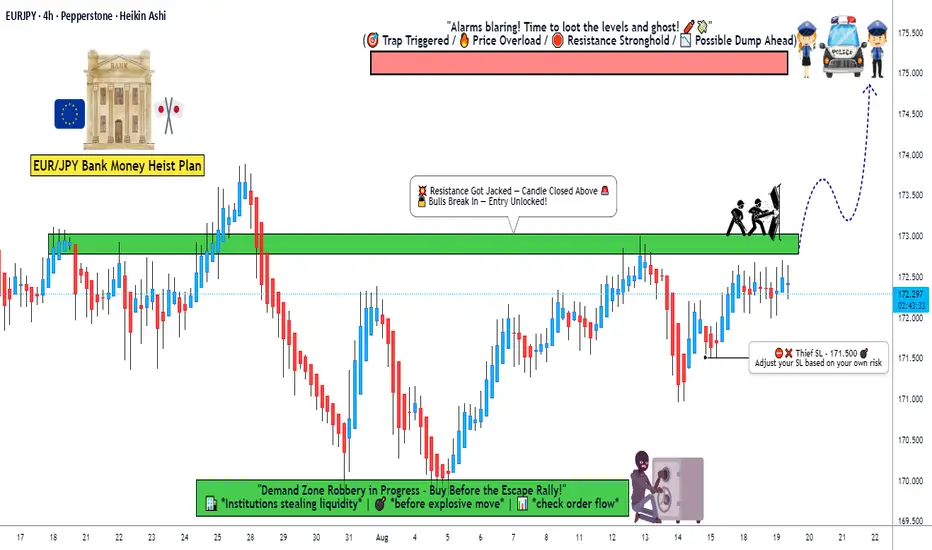
Based on the 🔥ULTIMATE THIEF TRADING HEIST MANUAL🔥, here is the master plan to rob the EUR/JPY "The Yuppy" bank blind! This is a BULLISH pending order assault. Our aim is the luxurious 175.000 VIP Money Vault. 🏦💰✨
Entry: The Grand Heist Begins! ⚡
The Trigger: We wait for the BREAKOUT & HOLD above 173.000. This is when the guards change shifts! 🚨
The Layering Strategy (The Genius Move): The Thief doesn't just kick the door down; he picks all the locks at once! Place MULTIPLE BUY LIMIT ORDERS on any dip or retest to create a powerful average entry. Think like a pro!
1st Layer (The Decoy): @173.000 (After breakout confirm)
2nd Layer (The Bag Filler): @172.700
3rd Layer (The Masterstroke): @172.500
4th Layer (The Insurance Policy): @172.300
🤑 YOU CAN ADD MORE LAYERS BASED ON YOUR RISK APPETITE! 🤑
Stop Loss: The Escape Route! 🛑
"Yo, listen up! 🗣️" Do NOT set your stop loss until AFTER the 173.000 breakout is confirmed! The Thief's ultimate safety net is placed at @171.500. This is our emergency exit if the heist goes sideways.
⚠️ WARNING: You OG's can adjust this SL based on your own risk tolerance and number of layers. But remember, a real thief always has an exit plan! 👊😎
Target: The Getaway! 🎯
The police have set up a barricade at 175.500. We are not greedy! Our escape chopper is waiting at @175.000. GRAB THE STOLEN CASH AND GO! Don't wait for the cops! 🚁💵💨
⚠️TRADING ALERT: News Releases & Managing the Loot 📰🗞️
News can bring swat teams (volatility). To protect your stolen profits:
Avoid placing new layers during high-impact news.
Use a TRAILING STOP once we're in profit to lock in those stacks! 🔒💰
💖SUPPORT THE HEIST CREW!
💥SMASH THAT BOOST BUTTON!💥 It fuels our next grand robbery! Let's make stealing from the market look easy every single day. 🏆💪🤝❤️🎉🚀
I'll be back with another flawless plan. Stay sharp, stay profitable! 🤑🐱👤🤗🤩
August 11, Forex Outlook: Key Market Expectations for the Week!Welcome back, traders!
In today’s video, we’ll be conducting a Forex Weekly Outlook, analyzing multiple currency pairs from a top-down perspective—starting from the higher timeframes and working our way down to the lower timeframes.
Pairs to focus on this Week:
USDCAD
EURGBP
EURJPY
GBPCHF
USDCHF
NZDCHF
EURNZD
Our focus will be on identifying high-probability price action scenarios using clear market structure, institutional order flow, and key confirmation levels. This detailed breakdown is designed to give you a strategic edge and help you navigate this week’s trading opportunities with confidence.
📊 What to Expect in This Video:
1. Higher timeframe trend analysis
2. Key zones of interest and potential setups
3. High-precision confirmations on lower timeframes
4. Institutional insight into where price is likely to go next
Stay tuned, take notes, and be sure to like, comment, and subscribe so you don’t miss future trading insights!
Have a great week ahead, God bless you!
The Architect 🏛️📉

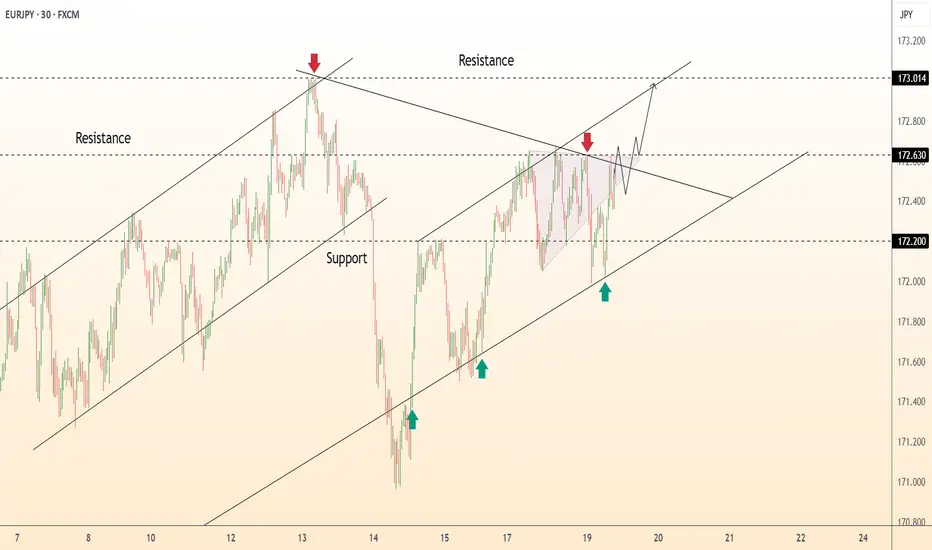
DeGRAM | EURJPY is trying to break through resistance📊 Technical Analysis
● EUR/JPY is ascending within a rising channel and has rebounded off support near 172.20–172.30, forming a fresh higher low (green arrow).
● Price is now approaching a tight wedge toward the downward-sloping resistance. A break above ~172.63 opens the path toward 173.01—and potentially further up toward the rising channel top near 173.90.
💡 Fundamental Analysis
● EUR/JPY remains steady above 172.00, holding its recent range amid calm sentiment.
● The cross also benefits from buoyant market sentiment and sustained optimism in risk assets, leading to continued yen weakness. Bullish momentum is reinforced by its position above the 100-day EMA and an RSI elevated above the 50 level.
✨ Summary
Long above 172.60–172.63; first target 173.01, with extension toward 173.90. Invalidation only upon break below 172.20.
-------------------
Share your opinion in the comments, and support the idea with a like. Thanks for your support!