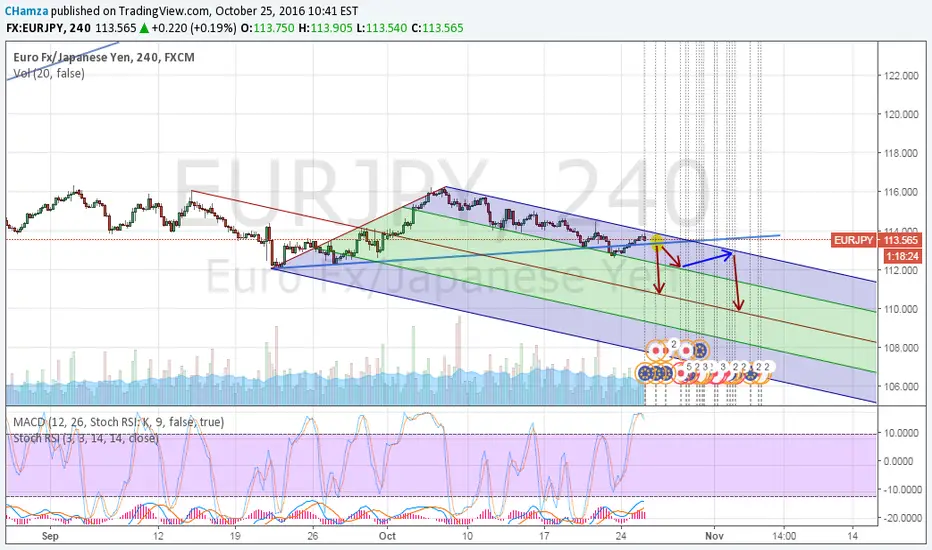
Eurjpyprediction
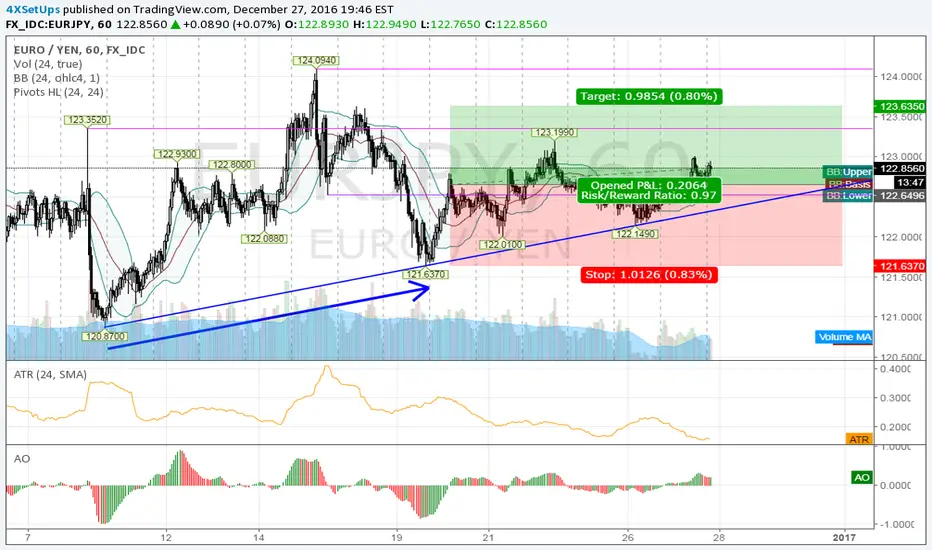
still long EURJPY @ 1h @ trading capability this 52nd week `16This is only a trading capability - no recommendation !!!
Next week i`ll confirm or change my opinion about this SetUp :)
Buying/Selling or even only watching is always your own responsibility ...
Best regards
Aaron
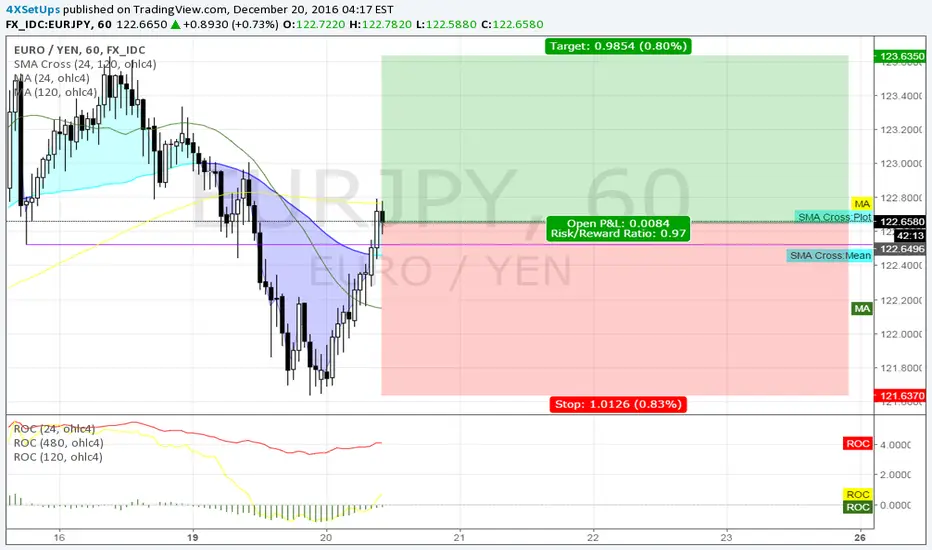
long EURJPY @ 60 min @ trading capability for this 51st week`16This is only a trading capability - no recommendation !!!
Next week i`ll confirm or change my opinion about this SetUp :)
Buying/Selling or even only watching is always your own responsibility ...
Best regards
Aaron
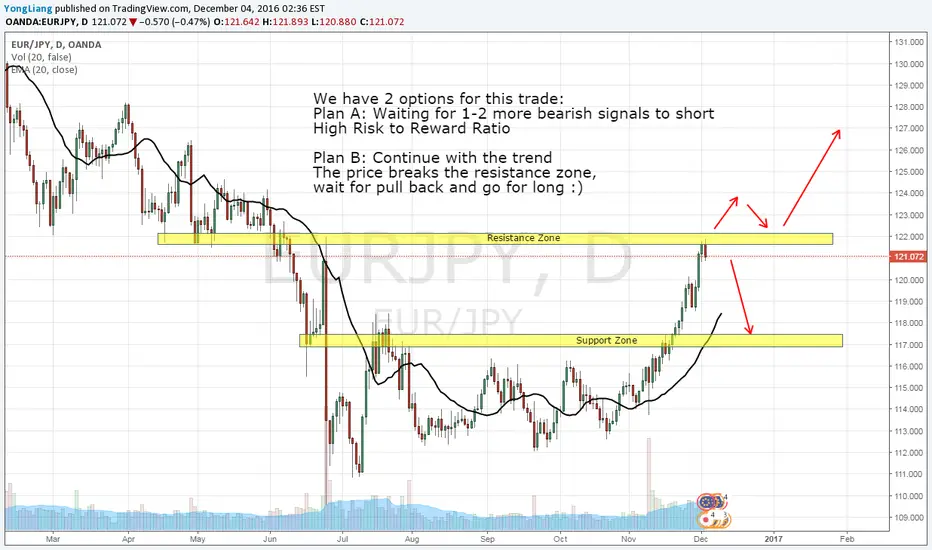
EUR/JPY, DAY CHART, NEUTRAL-SHORT (4-DEC-2016)We have 2 options for this trade:
Plan A: Waiting for 1-2 more bearish signals to short
High Risk to Reward Ratio
Plan B: Continue with the trend
The price breaks the resistance zone,
wait for pullback and go for long :)
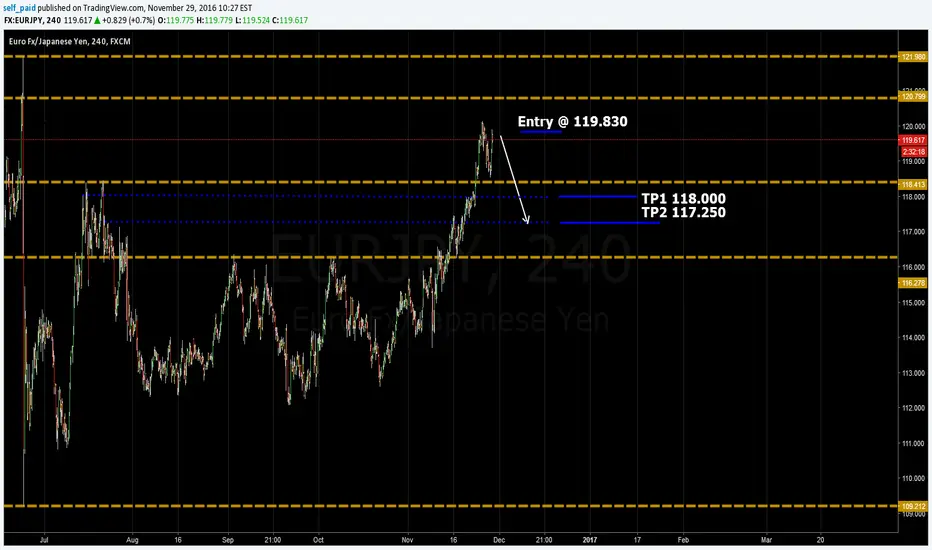
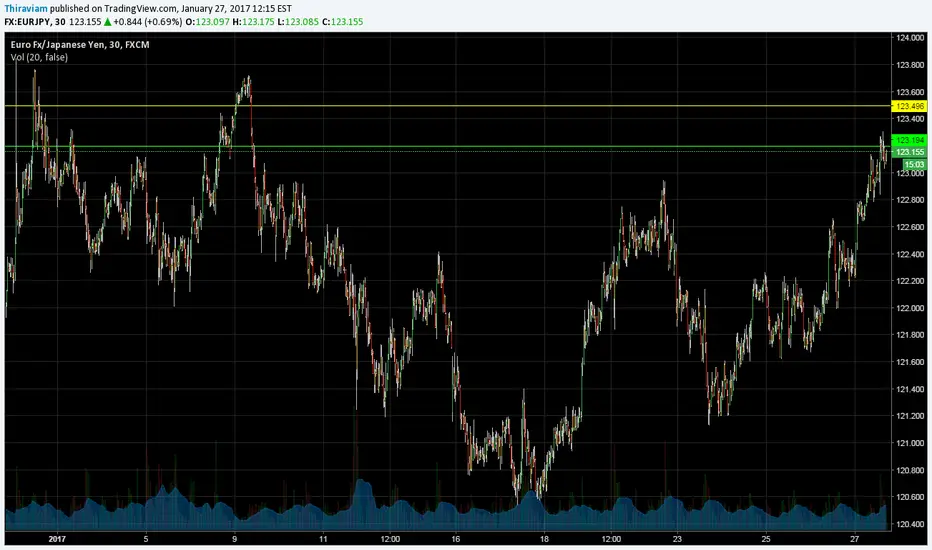
yen will gain on eur temporary yen will gain on eur on temporary basis by this week or maybe until next week...
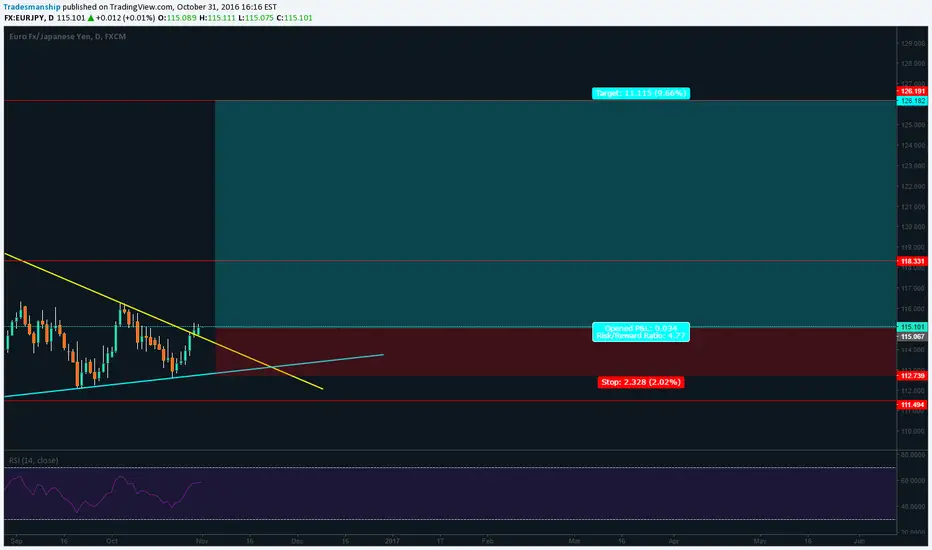
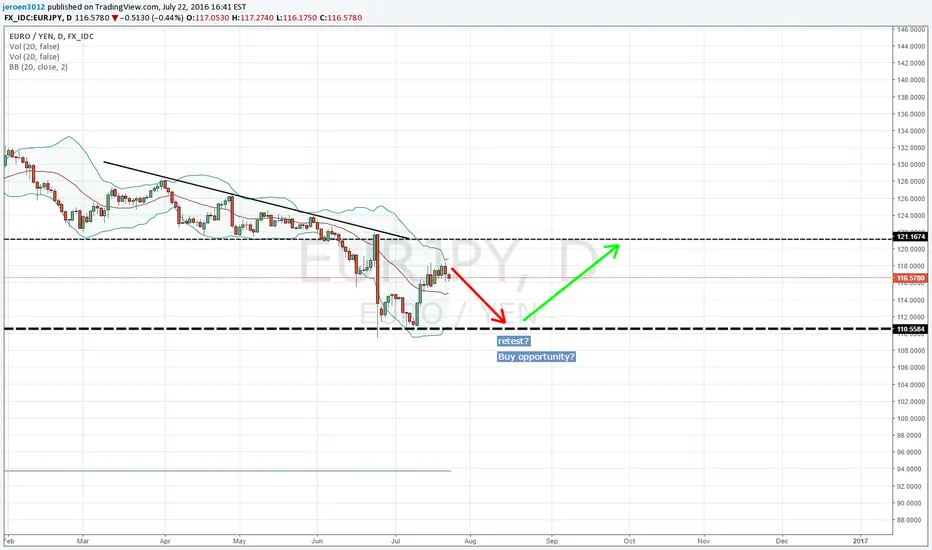
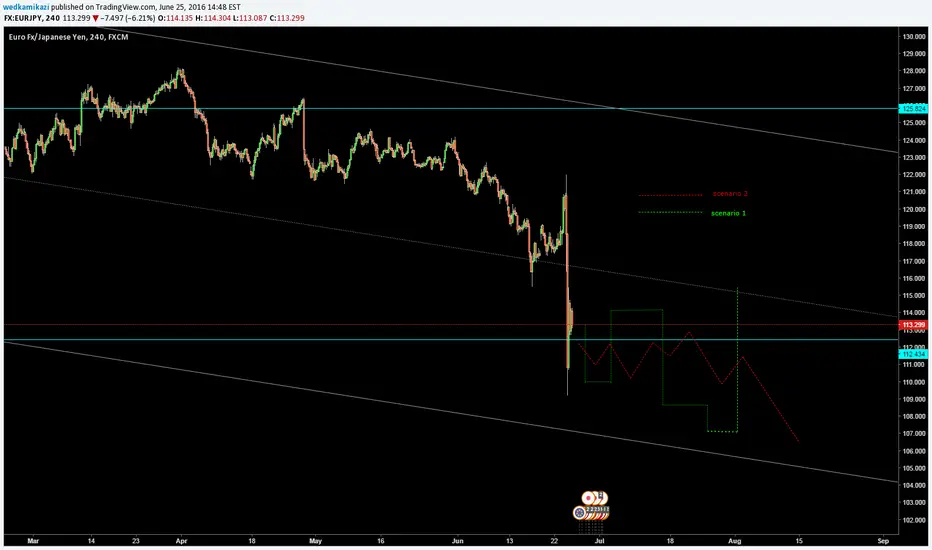
(EURJPY) - Daily - SpeculationWe have a big trend line stretching as far as January 2016 which finally broke yesterday. we might have a small pull back before our setup is ready.
buy whenever you feel it fits your strategy.
---------------------------------------------------------------------------------------------------------------------------------------------------------------------------------------------------------
Liability Disclaimer : All trades posted here are my personal view of the market.
If your planning to use them as signals, do your own research first and you are responsible for your own entries, exit, profit and loss management.
---------------------------------------------------------------------------------------------------------------------------------------------------------------------------------------------------------
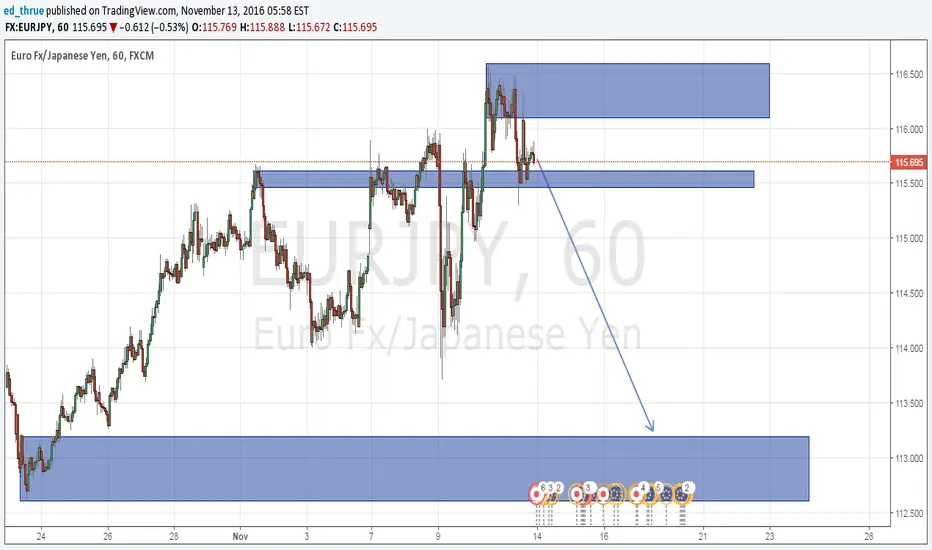
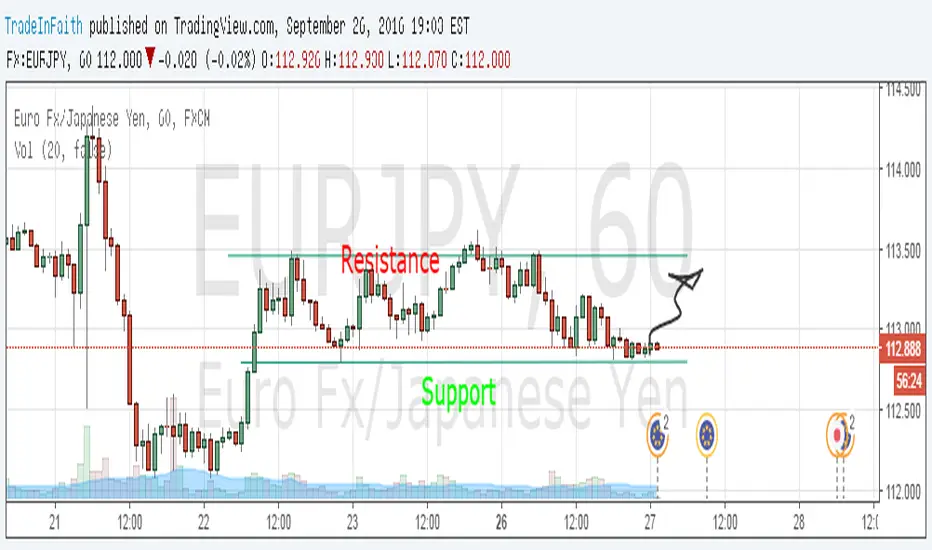
Range - Easy Support/Resistance Trade for Beginners - LONGApproximately 55 pips available. Market has reached a level of support on the 1hour chart. Market has been in this range since 22 September, with reliable recent evidence of market activity remaining within this range. Low risk entry of around 9 pips, with a reward of around 55 pips.
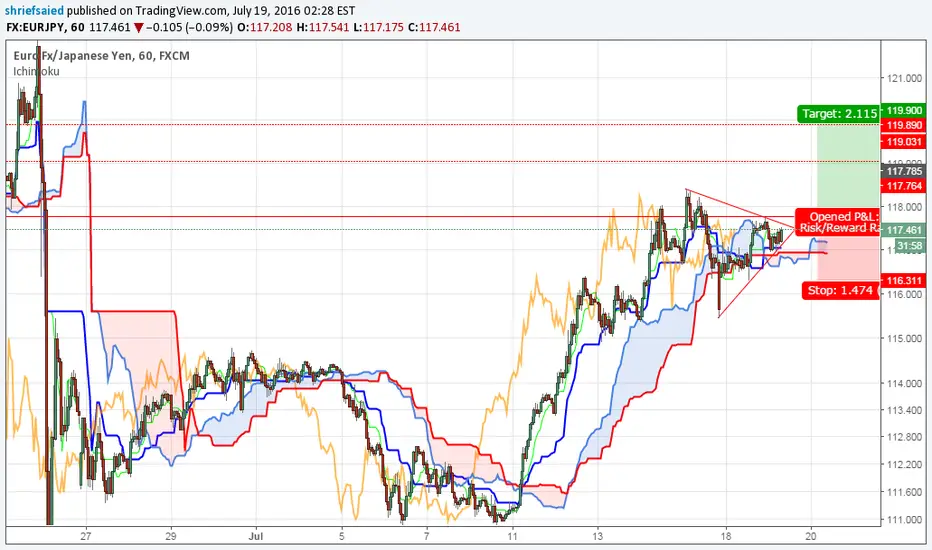
EURJPY BULLISH SIGNAL CALL.The price finding support area at 115.46-116.63. Bullish as long as support area at 115.46 remains intact. As intraday trading strategy. we must get bullish signal confirmed by trading above 117.764 with potential target at 119.03- 119.89.
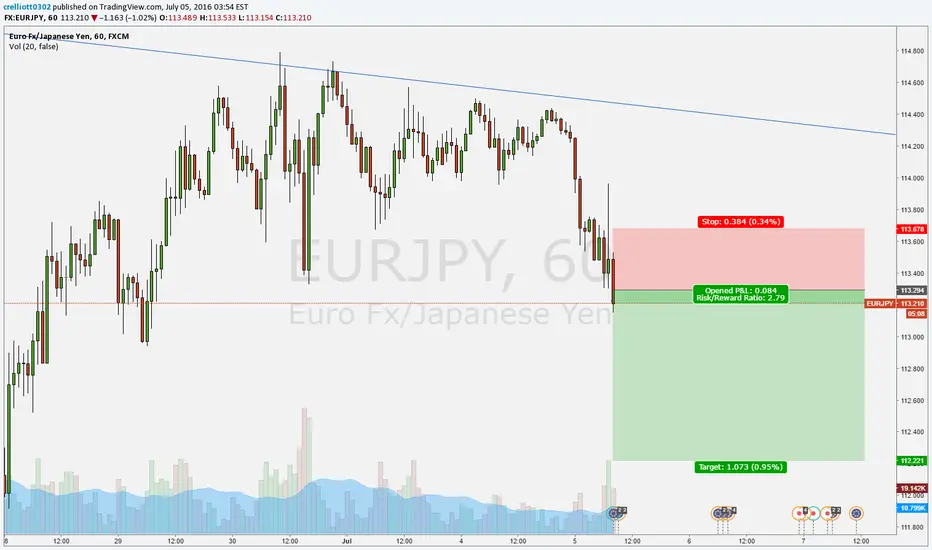
Trade activeMultiple pin bars signaling strong selling pressure along the 113.300 support. Price action broke through finally and activated my short.
Entry 113.296.
TP 112.220
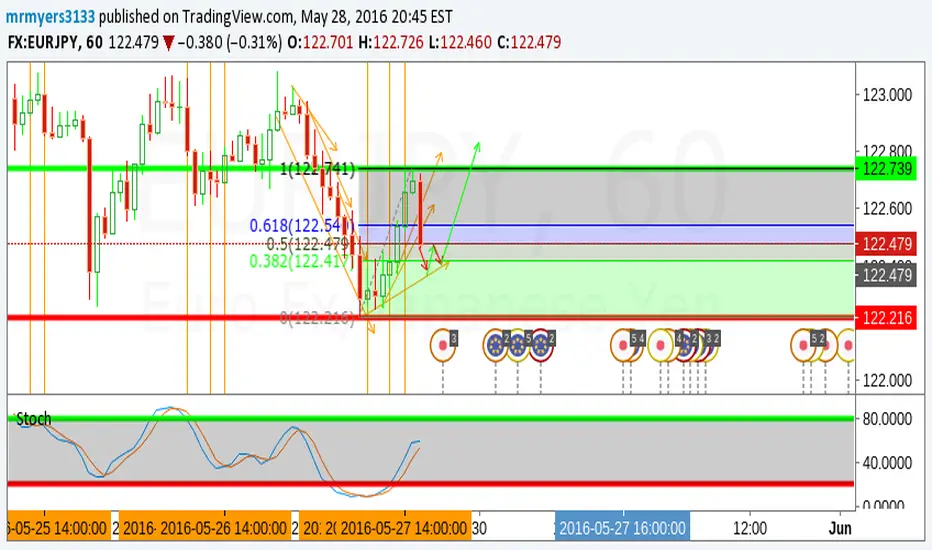
EUR/JPY1. Price may continue going down to .382 (S3), if it breaks the S3 price should retrace off the channel and go into an uptrend.
2. Possible reversal at 122.417 & 122.216
4. Once the resistance level at 122.739 is broken it turns into support for the uptrend
5. Once uptrend starts price may retrace 2 times before reaching target.
6. Watch for the retracement and exit trade "long and re-enter "Short" until the indication of the next uptrend
1,260 or more Possible Pips gained, if entries are on time
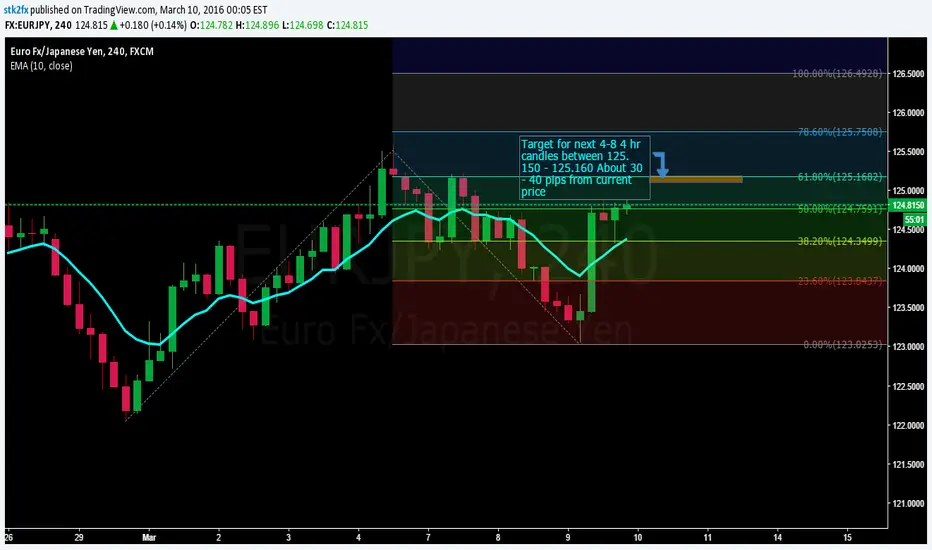
EURJPY Going up 30 - 40 PipsIn next few hours EURJPY will hit 125.150 - 125.160 target and may continue uptrend even another 100 or pips upto 126.400. This is not advice or recommendation for any trade. It's my own trade journal to keep track of accuracy of chart readings.
Today's Chart - EUR/JPY
Today's Chart: :EUR/JPY ( HOURLY )
The primary trend of EUR/JPY is bullish on charts and price is trading below the trend line in its hourly chart. In hourly chart the price is sustaining above 200 day SMA and taking resistance of 50 day SMA indicating downtrend of the pair. It is having an important resistance at the level of 131.65 and support at the level of 130.02. If it breaks its support level on the downside and sustains below it then we can expect it to show further bearish movement in the pair.
INDICATORS
MACD is sustaining in its negative territory indicating the bearish trend in the pair.
RSI is sustaining in its selling zone indicating the upcoming bearish trend in the pair.
STRATEGY
EUR/JPY is looking bearish on charts for next few trading session. One can go for sell on higher level strategy for this pair for intra-day to mid-term positions in it.
www.tradingsignalreviews.com

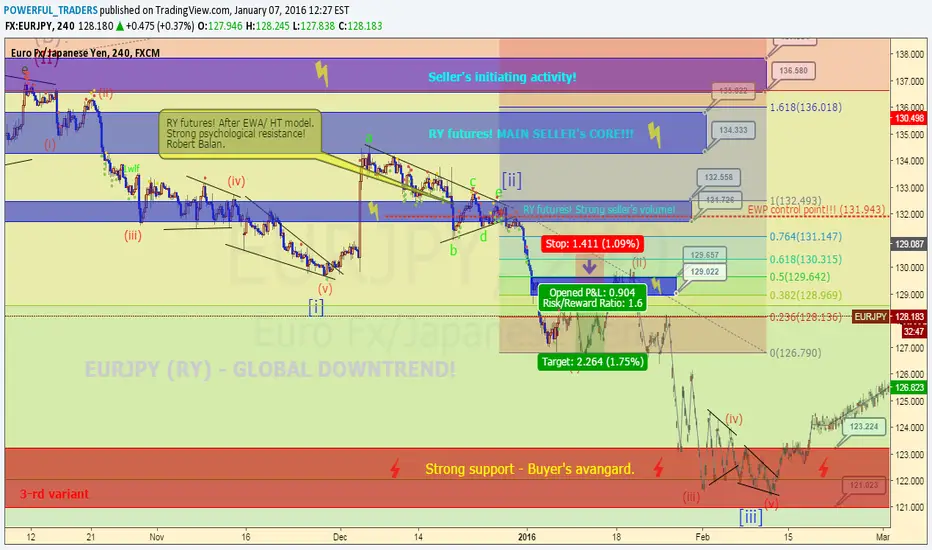
EURJPY (RY) - Weekly ForecastHello Traders!
We would like to present EurJpy forecast. (3-rd variant)
Sell limit - 129.000, S/L - 130.500, T/P - 126.900
Best regards, Powerful Traders.
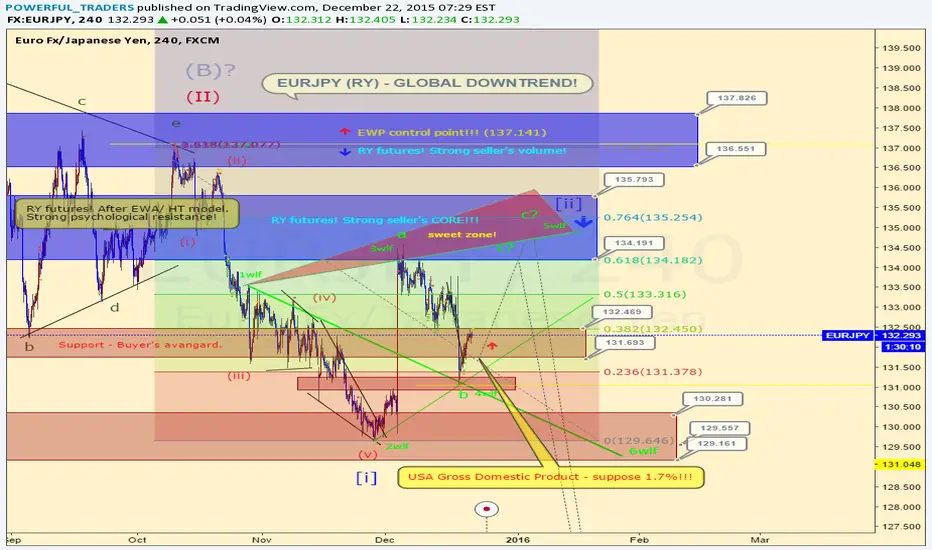
EURJPY (RY) - Long&ShortHello!
Definitely, there is the Global Downtrend! But to the end of this year, we have two variants.
1) Long - S/L131.000, T/P133.700-134.000
2) SHORT - Sell Limits near 134.500 - 135.000, S/L 137.140 (EWP rules), T/P 123.500
Please, if you want to enter the market, first of all, use the Market Profile, Volume, Cluster&Delta analysis, Depth of Market and Footprint, when combined with the Wave Theory! Because without the above methods, the wave analysis is incomplete and inaccurate.
Best Regards! Powerful Traders.
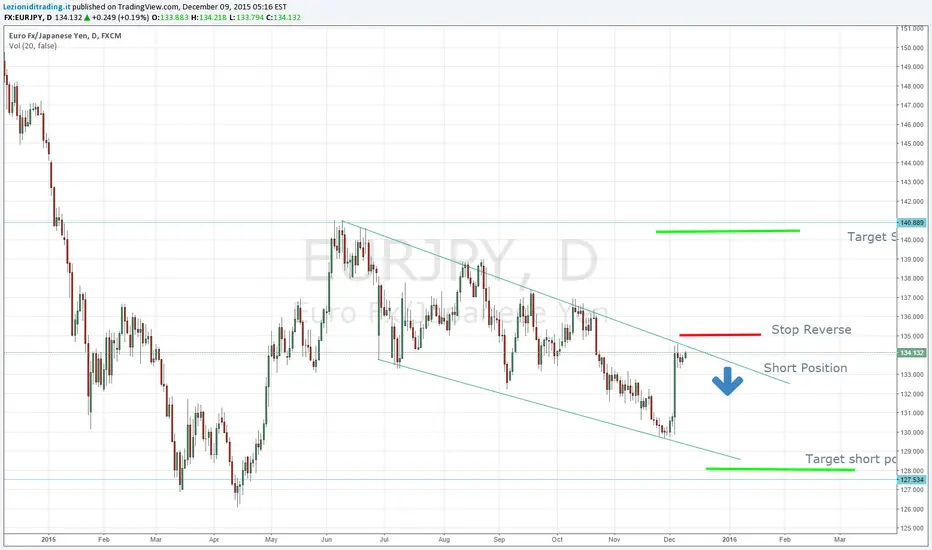
EURJPY short to 134.13 on D1My position on EURJPY is Short to 134.13 in charts D1 with possible target a 128.00 end stop reverse to 135.00