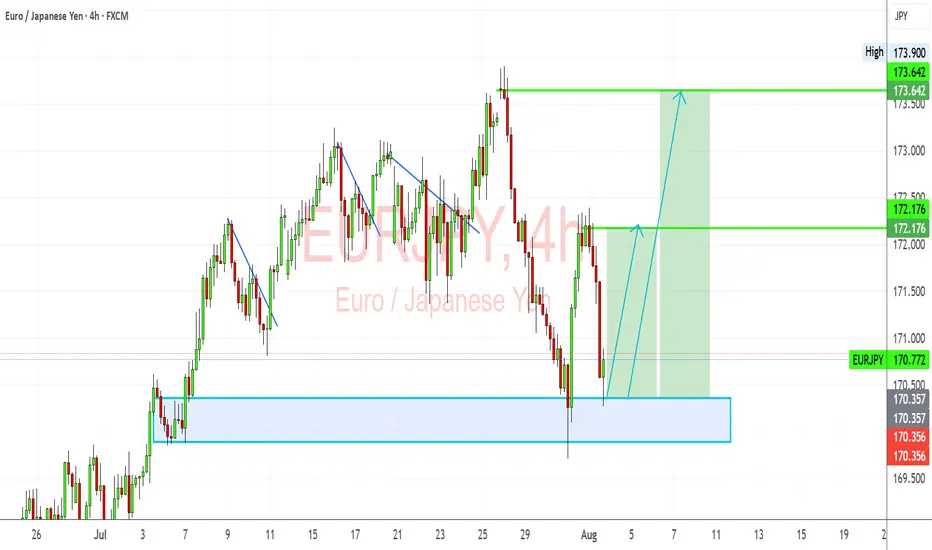
EURJPY: Bullish Rebound from Key Demand ZoneEURJPY has bounced off a critical demand zone and is showing signs of a bullish recovery. Despite the recent pullback, the pair’s structure remains fundamentally and technically bullish, driven by JPY weakness and EUR resilience.
Technical Analysis (4H Chart)
Pattern: Price tested a strong demand zone near 170.35–170.50 and rejected it aggressively.
Current Level: 170.77, starting a potential bullish leg toward higher resistance levels.
Key Support Levels:
170.35 – key demand zone and invalidation level for bulls.
169.90 – deeper support if demand zone breaks.
Resistance Levels:
172.17 – first bullish target and interim resistance.
173.64 – major target if bullish continuation sustains.
Projection: A successful rebound from 170.35 could drive price toward 172.17 initially, then 173.64 if momentum holds.
Fundamental Analysis
Bias: Bullish.
Key Fundamentals:
EUR: ECB’s slower path toward easing supports EUR stability relative to JPY.
JPY: Weakness persists as BoJ maintains dovish bias, though FX intervention risk limits JPY downside speed.
Global Sentiment: Mild risk-on mood supports EUR strength against JPY.
Risks:
BoJ verbal intervention or actual FX intervention could trigger temporary JPY strength.
Sharp reversal in global risk sentiment could weaken EUR/JPY.
Key Events:
ECB speeches and data (CPI, growth updates).
BoJ FX comments and broader market risk appetite.
Leader/Lagger Dynamics
EUR/JPY is a leader among JPY pairs, often moving in sync with GBP/JPY and CHF/JPY. Its movement also tends to precede confirmation in risk-sensitive JPY crosses.
Summary: Bias and Watchpoints
EUR/JPY is bullish from the 170.35 demand zone, with a potential move toward 172.17 and 173.64. Key watchpoints include ECB communication, BoJ stance, and market risk sentiment. As long as 170.35 holds, bulls remain in control.
Eurjpysell
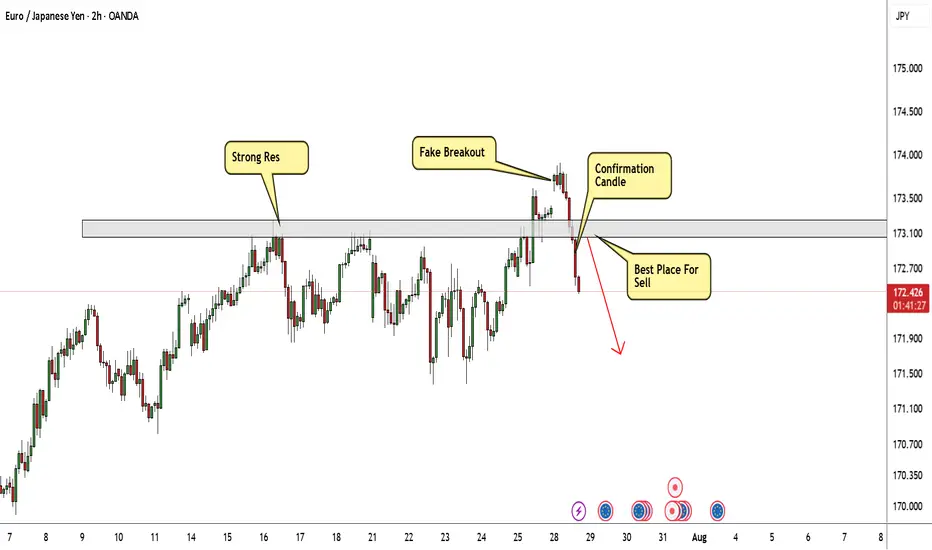
EUR/JPY Again Below My Res , Short Setup Valid To Get 150 Pips !Here is my opinion on EUR/JPY On 2H T.F , We have a fake breakout and Gap and the price back again below my res area and closed with 4H Candle below it , so i have a confirmation and i`m waiting the price to go back to retest this strong res and give me any bearish price action and then we can enter a sell trade and targeting 100 : 150 pips . if we have a daily closure above my res then this analysis will not be valid anymore .
EURJPY: A Big Move In Making, Please Share Your Views! Date: 22/06/2025
Hello everyone,
I hope you’re all having a good weekend. As we previously discussed, we expected a sharp decline in Europe/JPY, but unfortunately, it didn’t work out in our favour due to the extremely bullish US dollar. This led to the crossing and invalidation of our two selling zones.
Looking at next week’s price projection, we can confirm that the price is heading towards 170.50 and may be selling at this level. Therefore, we will be keeping a stop loss at 171.50.
Once the trade is activated, we can set our target at 166.0, 163.50, and the final target will be placed at 158.50.
If you like our work, please like our idea.
Good luck and trade safely next week.
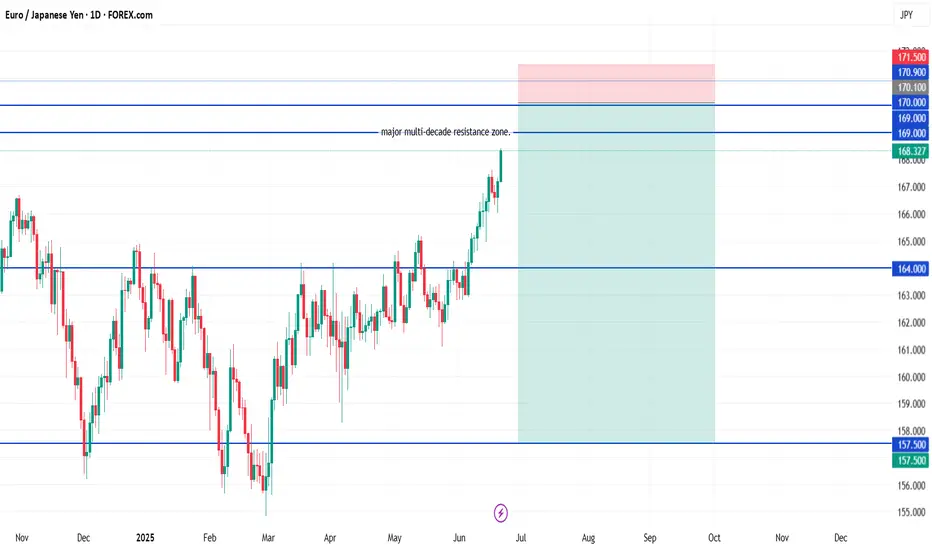
EUR/JPY Short✅ EUR/JPY Swing Short Setup (Multi-Entry)
🎯 Entries:
Entry 1: 169.00 (light position)
Entry 2: 170.10 (core entry)
Entry 3: 170.90 (final top entry)
🛡️ Stop Loss (Unified):
171.50
Placed above the entire resistance zone and previous all-time wick highs, allowing for normal trap behavior without overexposure.
🎯 Take Profits:
TP1: 164.00
TP2: 157.50
You can scale out partially at TP1 or run the full position to TP2 depending on how momentum builds.
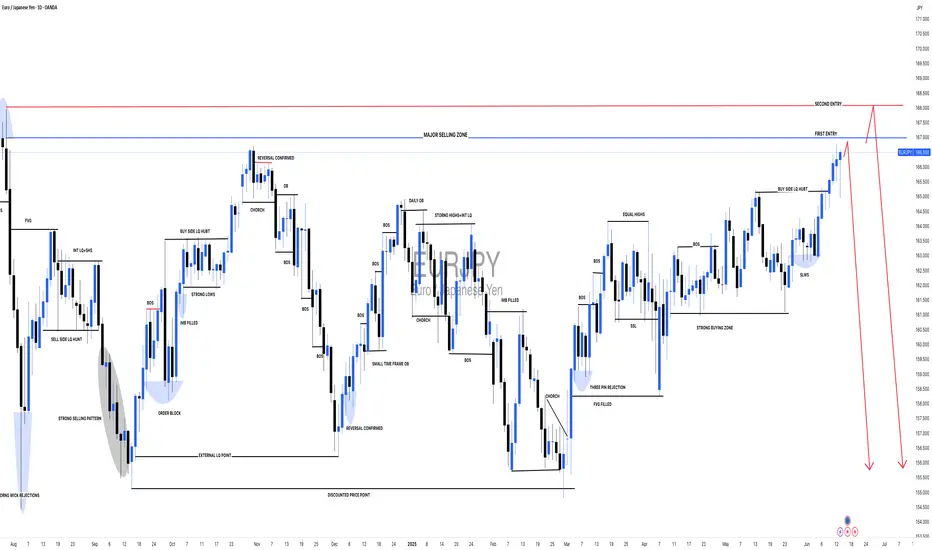
#EURJPY: Major Swing Sell +1100 Pips, One Not To Miss! The Japanese Yen (JPY) is most likely to continue its bullish trend, as the Dollar Index (DXY) is expected to decline due to the ongoing conflict between Israel and Iran. Historically, JPY and CHF, alongside gold and silver, have been favoured by global investors and remain bullish. Strong fundamentals and technical support further support our analysis.
The 167-169 price region remains a critical point for sellers, where we anticipate significant selling volume. There are two entry points to consider: one near the current price and another slightly further away. Please monitor volume and use smaller time frames for entries.
Our Swing Target is at 154, but you can also target smaller zones once the trade is activated. For instance, set take-profit levels at 164, 160, and finally, at 154.
To encourage and support us, you can like the idea, comment on it, or share it.
Team Setupsfx_
❤️❤️🚀🚀
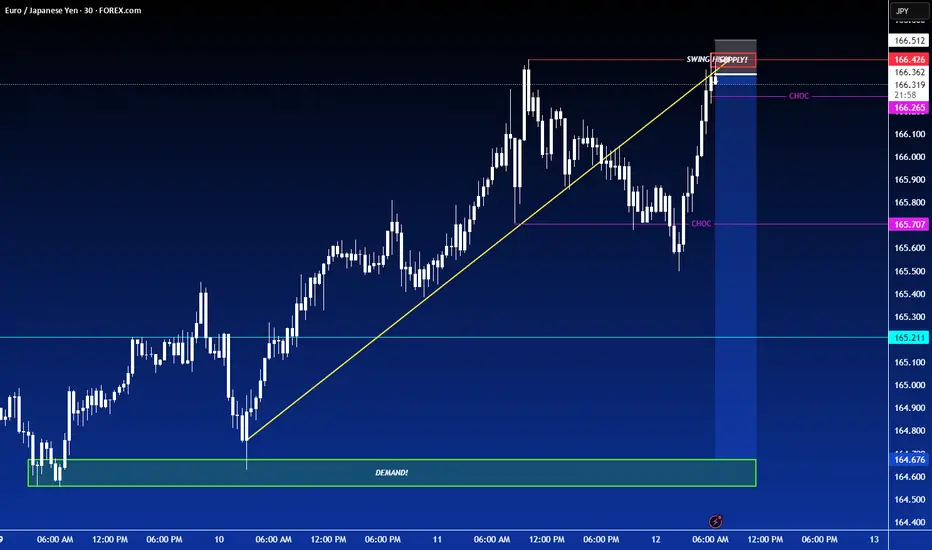
SHORT ON EUR/JPYOn the 1 min Timeframe EJ has given us a choc (change of character) to the downside with a nice break and retest to a major supply area.
The JPY index is bullish which should cause EJ to fall.
I will be selling EJ to the next level of demand looking to catch 100-200 pips.
Technical Analysis: JPY Price Action Near Resistance – Potential📊 Technical Analysis: JPY Price Action Near Resistance – Potential Reversal Ahead? ⚠️
---
🔍 Overview:
This chart illustrates the recent price action of a JPY-based asset (likely a JPY forex pair), currently testing a major resistance zone around the 165.286–165.500 area. The market is reacting sharply at this level, suggesting a possible rejection and correction downward. The setup is marked with well-defined support/resistance levels and potential retracement targets.
---
🟧 Key Zones:
🛑 Resistance Zone (165.286 – 165.500): Price is currently reacting at this overhead supply zone. This level has historically rejected bullish attempts, as seen in previous price action.
🟩 Support Zone (161.302 – 161.550): This demand zone has served as a strong base previously and is marked as the final potential retracement level (labeled "4") in the chart.
---
🔻 Retracement Levels:
Labeled as 1 through 4 in purple lines:
1. Level 1 – 163.948 🟣: Initial minor support; might provide a short-term pause if price pulls back.
2. Level 2 – 162.803 🔄: Mid-level support; watch for consolidation or bounce.
3. Level 3 – 162.091 🧲: Stronger support and possible bounce level.
4. Level 4 – 161.550 🛡️: Key support aligning with historical demand zone. A break below this could signal trend reversal.
---
🔄 Price Projection:
The curved arrow indicates a potential correction from the resistance zone down toward the support levels, especially targeting Zone 4. This move reflects a typical market reaction when price meets strong resistance after a steep rally.
---
📈 Strategic Implications:
For Bulls 🐂: Wait for confirmation of support at any of the retracement levels (especially 3 or 4) before entering.
For Bears 🐻: This is an optimal area to look for short entries, especially if bearish candlestick patterns confirm rejection from the resistance zone.
---
✅ Conclusion:
Price is at a critical decision point near major resistance. A bearish reversal is likely if the resistance holds, with a corrective move toward 161.302–161.550 being the most probable target range. Traders should watch for confirmation signals before committing to positions.
---
📌 Tip: Keep an eye on candlestick patterns and volume at the resistance zone to validate the reversal hypothesis.

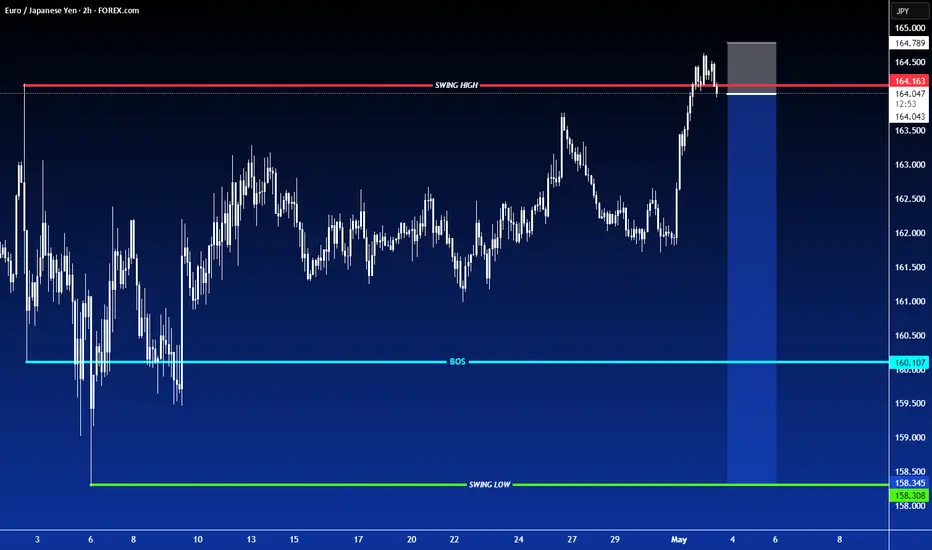
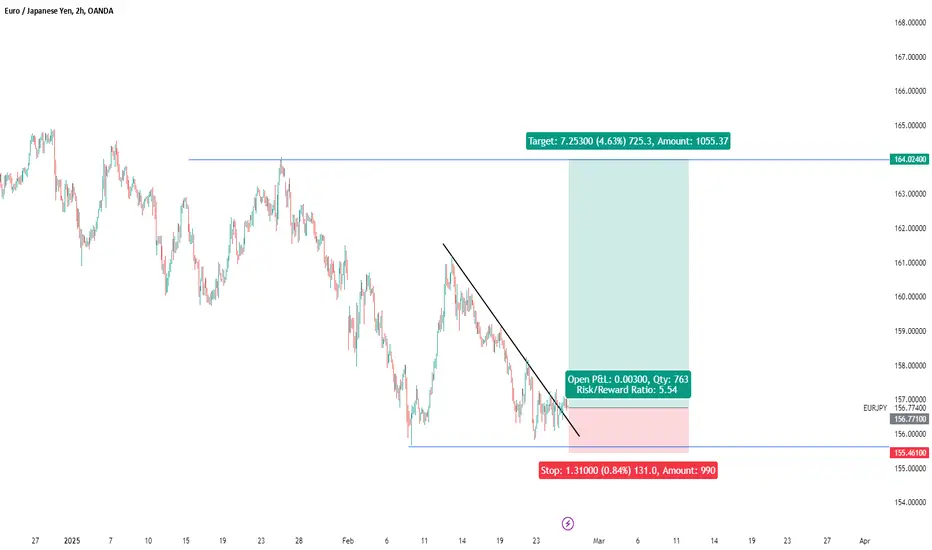
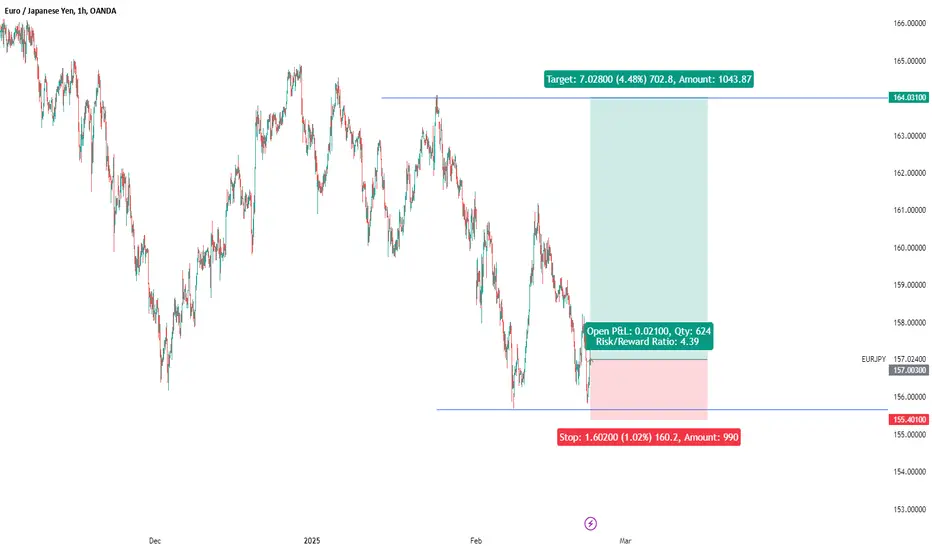
EURJPY - Look for Short (SWING) 1:XX!It’s been a while since I last shared a trading idea — here’s one for you.
EURJPY has spent the past few weeks in an accumulation phase and now looks poised to shift into a distribution phase to the downside. Let’s see how it unfolds.
Disclaimer:
This is simply my personal technical analysis, and you're free to consider it as a reference or disregard it. No obligation! Emphasizing the importance of proper risk management—it can make a significant difference. Wishing you a successful and happy trading experience!
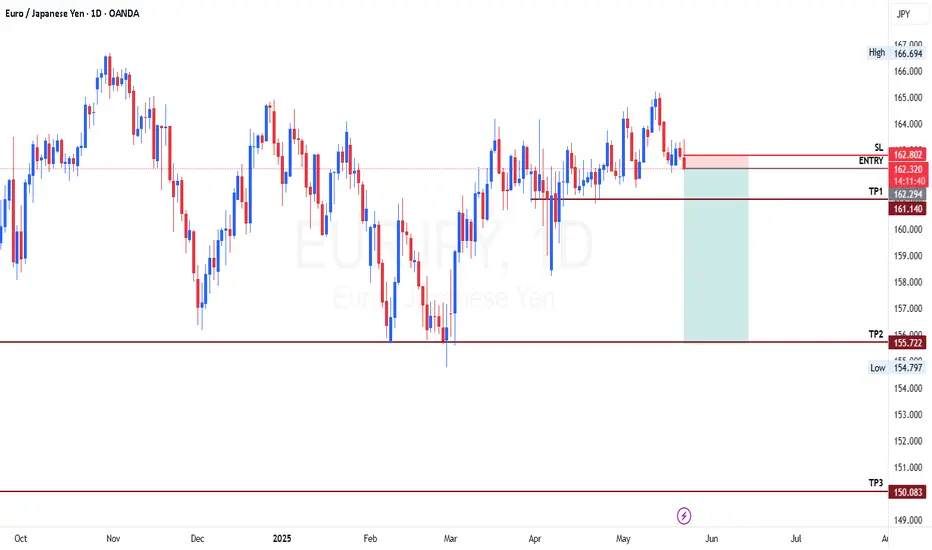
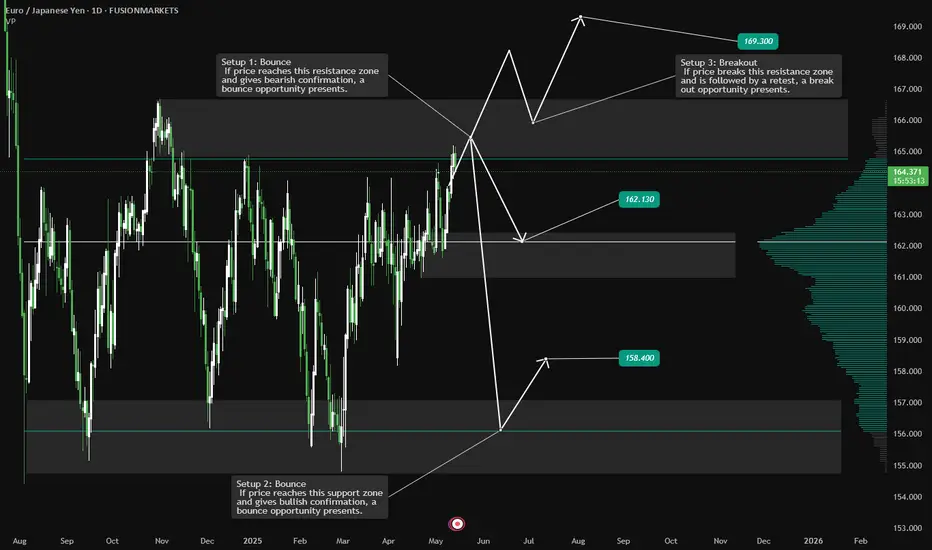
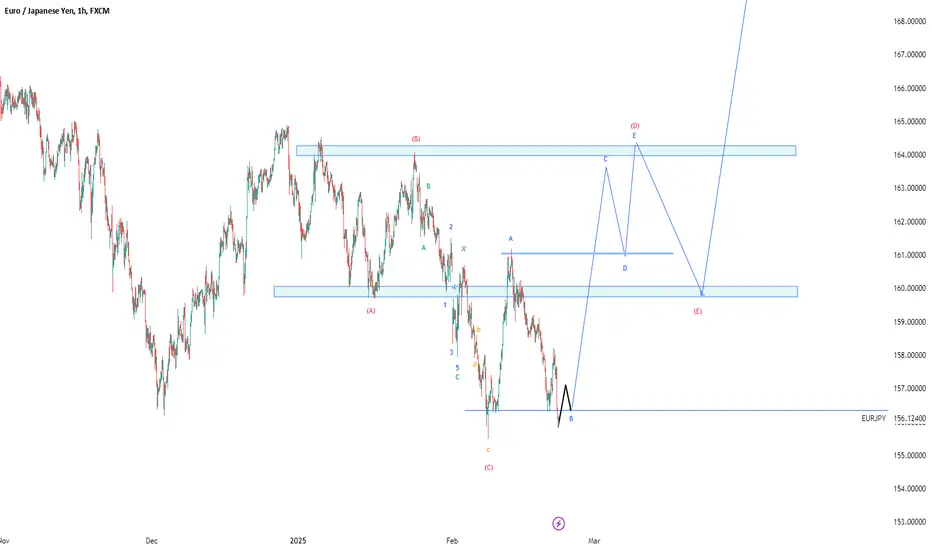
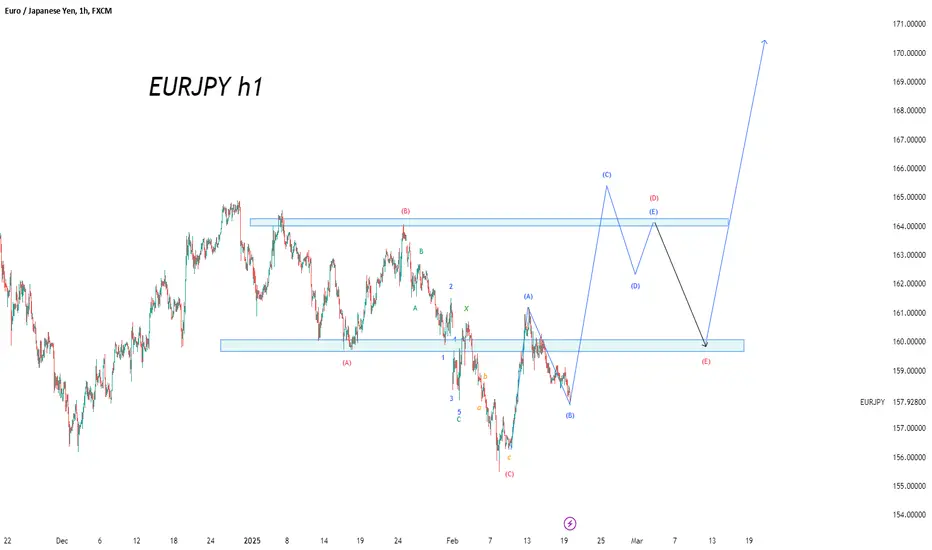
EURJPY Analysis: Range Bounces & BreakoutHello traders!
EURJPY is in a daily range and is offering three trading scenarios.
The first scenario suggests the pair may react bearishly from the currently approached zone, setting up a bounce opportunity that could drive price lower toward the 162.130 area.
The second scenario anticipates a bounce toward the 158.400 area, if price reaches the support zone of the range.
The third scenario anticipates a breakout above the resistance zone, followed by a retest, which could present a strong opportunity for continuation toward the 169.300 area.
Discretionary Trading: Where Experience Becomes the Edge
Discretionary trading is all about making decisions based on what you see, what you feel, and what you've learned through experience. Unlike systematic strategies that rely on fixed rules or algorithms, discretionary traders use their judgment to read the market in real time. It's a skill that can't be rushed, because it's built on screen time, pattern recognition, and the ability to stay calm under pressure.
There's no shortcut here. You need to see enough market conditions, wins, and losses to build that intuition—the kind that tells you when to pull the trigger or sit on your hands. Charts might look the same, but context changes everything, and that's something only experience can teach you.
At the end of the day, discretionary trading is an art, refined over time, sharpened through mistakes, and driven by instinct. It's not for everyone, but for those who've put in the work, it can be a powerful way to trade.
SHORT ON EUR/JPYEUR/JPY has created a head and shoulders pattern at a major resistance area.
I will be selling EJ to the pervious swing low / demand level.
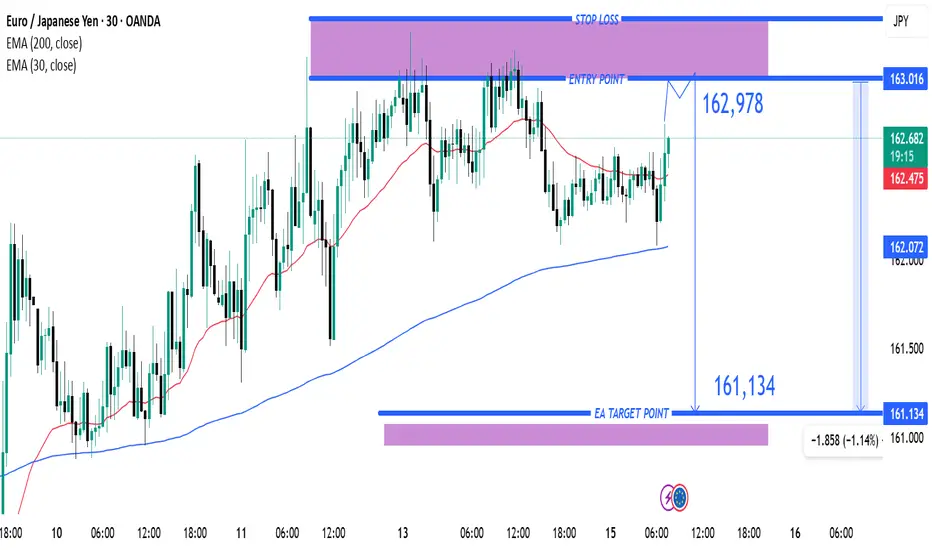
EUR/JPY Short Setup – Bearish Reversal Targeting 161.134 with TiEMA 30 (red): Currently at 162.470
EMA 200 (blue): Currently at 162.071
Trade Setup:
Entry Point: Around 162.978
Stop Loss: Slightly above 163.016 (highlighted in purple zone)
Target (Take Profit): 161.134 (labeled as “EA TARGET POINT”)
Analysis:
Trend: The pair has been trending upwards recently, as shown by the price staying above the 200 EMA.
Current Price: 162.604, just below the proposed entry.
Risk/Reward:
Risk: ~3.8 pips (entry to stop loss)
Reward: ~184.4 pips (entry to target)
This implies a favora
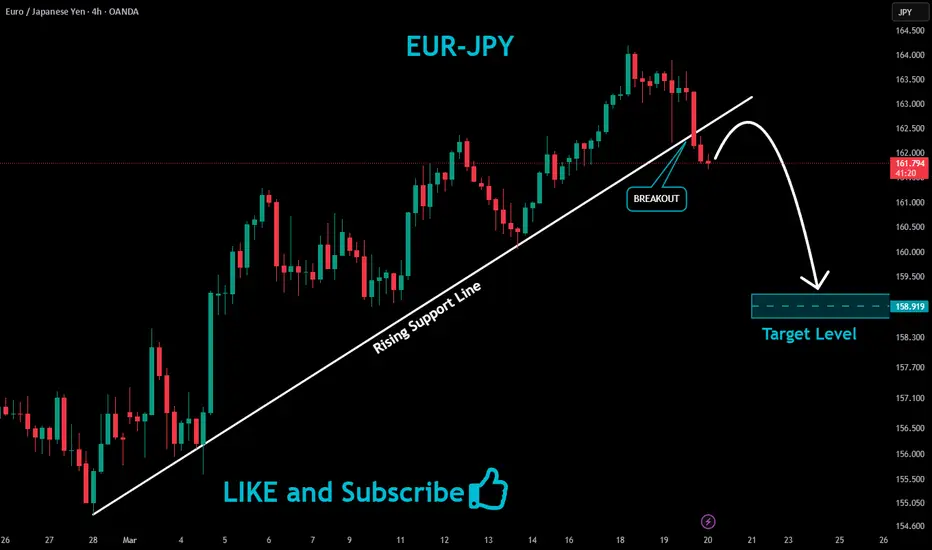
EURJPY Bearish Breakout!
HI,Traders !
EUR-JPY broke the rising
Support line and the breakout
Is confirmed so we are
Bearish biased and we
Will be expecting a
Further move down !
Comment and subscribe to help us grow !
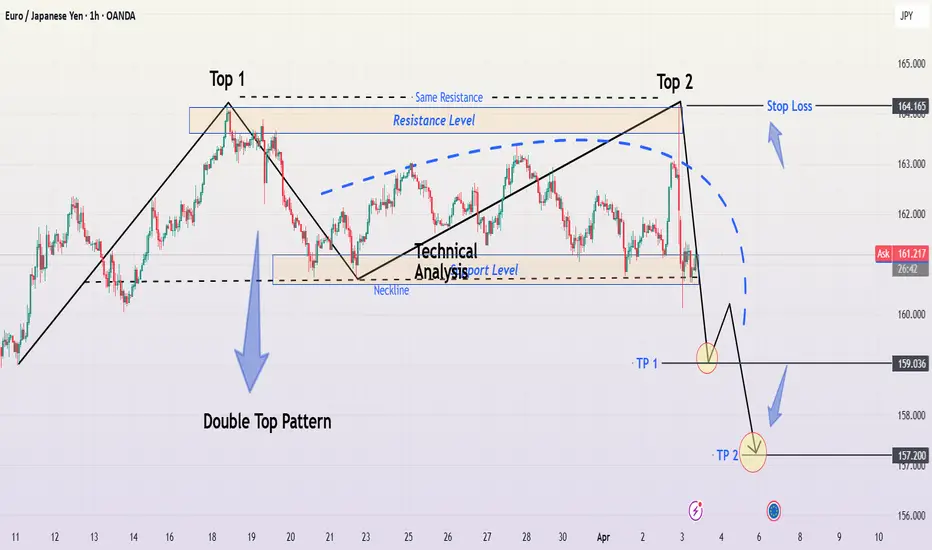
EURJPY Double Top - Bearish Reversal Ahead Toward Target!🔍 Chart Analysis: Identifying the Double Top Pattern
The EURJPY (Euro/Japanese Yen) 1-hour chart shows a classic Double Top pattern, which is a strong bearish reversal formation. This pattern occurs when the price reaches a significant resistance level twice but fails to break above it, indicating a potential shift from bullish momentum to bearish control.
1️⃣ Top 1: The first peak formed as buyers pushed the price higher, but strong resistance forced a pullback.
2️⃣ Top 2: The price attempted to break the same resistance level again but failed, forming a second peak at approximately 164.165, confirming that sellers are overpowering buyers.
3️⃣ Neckline (Support Level): The critical support level around 160.000 acted as a trigger for the bearish move. Once this level broke, the double top pattern was confirmed.
📌 Key Levels and Market Structure
🔹 Resistance (164.165): The highest level where sellers dominated, preventing further upward movement.
🔹 Support/Neckline (160.000): This level acted as a crucial pivot. Once broken, it signaled a trend reversal.
🔹 Take Profit Levels:
TP1 – 159.036: This serves as the first profit target, aligning with a prior demand zone.
TP2 – 157.200: The full projected downside move based on the double top pattern.
🔹 Stop Loss (SL): Above 164.165, ensuring a risk-managed approach in case of trend invalidation.
📉 Trading Strategy: How to Trade This Setup?
1️⃣ Entry Confirmation:
The ideal entry was after the price broke the neckline at 160.000 and retested it as resistance.
A breakdown candle with high volume confirmed seller dominance.
2️⃣ Stop-Loss Placement:
A stop-loss above 164.165 provides room for price fluctuations while protecting against false breakouts.
3️⃣ Profit Targets:
TP1: 159.036, securing partial profits.
TP2: 157.200, completing the double top measured move.
📊 Market Psychology & Price Action Insights
The double top pattern reflects a shift in market sentiment from bullish to bearish.
The repeated rejection at 164.165 signals a lack of buying strength, increasing the probability of a downward move.
The breakdown of the 160.000 neckline confirms that sellers have taken control.
The price action also shows a lower-high formation, reinforcing bearish momentum.
✅ Conclusion: Bearish Bias Until 157.200
This setup strongly favors short positions, as long as the price stays below 162.500.
A break above 164.165 invalidates the bearish setup, signaling a potential reversal.
Until then, the market remains bearish, with TP1 & TP2 as achievable downside targets.
💬 What’s your outlook on EURJPY? Drop your analysis below! 👇
EURJPY Approaching Key Resistance — Potential Sell SetupOANDA:EURJPY is approaching a key resistance level, an area that has been a key point of interest where sellers have regained control, leading to notable reversals in the past. Given this, there is potential for a bearish reaction if price action confirms rejection, such as a bearish engulfing candle, long upper wicks or increased selling volume.
If the resistance level holds, I anticipate a downward move toward 161.20, which represents a logical target based on previous price behavior and market structure.
However, if the price breaks above this zone and sustains above it, the bearish outlook may be invalidated, opening the door for further upside.
Just my take on support and resistance zones—not financial advice. Always confirm your setups and trade with solid risk management.
Best of luck!

eurjpy analysis ellio. Don't forget about stop-loss.
Write in the comments all your questions and instruments analysis of which you want to see.
Friends, push the like button, write a comment, and share with your mates - that would be the best THANK YOU.
P.S. I personally will open entry if the price will show it according to my strategy.
Always make your analysis before a trade

eurjpy buy signal
Don't forget about stop-loss.
Write in the comments all your questions and instruments analysis of which you want to see.
Friends, push the like button, write a comment, and share with your mates - that would be the best THANK YOU.
P.S. I personally will open entry if the price will show it according to my strategy.
Always make your analysis before a trade
eurjpy buy signal. Don't forget about stop-loss.
Write in the comments all your questions and instruments analysis of which you want to see.
Friends, push the like button, write a comment, and share with your mates - that would be the best THANK YOU.
P.S. I personally will open entry if the price will show it according to my strategy.
Always make your analysis before a trade
EURJPY sell signal. Don't forget about stop-loss.
Write in the comments all your questions and instruments analysis of which you want to see.
Friends, push the like button, write a comment, and share with your mates - that would be the best THANK YOU.
P.S. I personally will open entry if the price will show it according to my strategy.
Always make your analysis before a trade
eurjpy buy signal. Don't forget about stop-loss.
Write in the comments all your questions and instruments analysis of which you want to see.
Friends, push the like button, write a comment, and share with your mates - that would be the best THANK YOU.
P.S. I personally will open entry if the price will show it according to my strategy.
Always make your analysis before a trade
EURJPY buy signal. Don't forget about stop-loss.
Write in the comments all your questions and instruments analysis of which you want to see.
Friends, push the like button, write a comment, and share with your mates - that would be the best THANK YOU.
P.S. I personally will open entry if the price will show it according to my strategy.
Always make your analysis before a trade
gbpjpy buy signal. Don't forget about stop-loss.
Write in the comments all your questions and instruments analysis of which you want to see.
Friends, push the like button, write a comment, and share with your mates - that would be the best THANK YOU.
P.S. I personally will open entry if the price will show it according to my strategy.
Always make your analysis before a trade
eurjpy analysis. Don't forget about stop-loss.
Write in the comments all your questions and instruments analysis of which you want to see.
Friends, push the like button, write a comment, and share with your mates - that would be the best THANK YOU.
P.S. I personally will open entry if the price will show it according to my strategy.
Always make your analysis before a trade
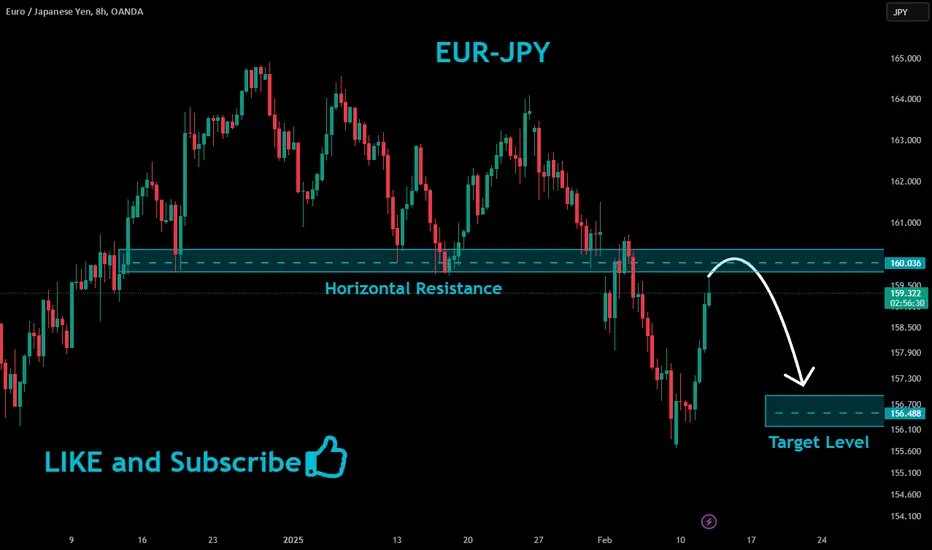
EURJPY Will Fall!
HI,Traders !
EUR-JPY will now hit a
Horizontal resistance
Of 160.036 and as the
Pair is locally overbought
We will be expecting a
Local bearish pullback
Towards the target !
Comment and subscribe to help us grow !