Technical Analysis: JPY Price Action Near Resistance – Potential📊 Technical Analysis: JPY Price Action Near Resistance – Potential Reversal Ahead? ⚠️
---
🔍 Overview:
This chart illustrates the recent price action of a JPY-based asset (likely a JPY forex pair), currently testing a major resistance zone around the 165.286–165.500 area. The market is reacting sharply at this level, suggesting a possible rejection and correction downward. The setup is marked with well-defined support/resistance levels and potential retracement targets.
---
🟧 Key Zones:
🛑 Resistance Zone (165.286 – 165.500): Price is currently reacting at this overhead supply zone. This level has historically rejected bullish attempts, as seen in previous price action.
🟩 Support Zone (161.302 – 161.550): This demand zone has served as a strong base previously and is marked as the final potential retracement level (labeled "4") in the chart.
---
🔻 Retracement Levels:
Labeled as 1 through 4 in purple lines:
1. Level 1 – 163.948 🟣: Initial minor support; might provide a short-term pause if price pulls back.
2. Level 2 – 162.803 🔄: Mid-level support; watch for consolidation or bounce.
3. Level 3 – 162.091 🧲: Stronger support and possible bounce level.
4. Level 4 – 161.550 🛡️: Key support aligning with historical demand zone. A break below this could signal trend reversal.
---
🔄 Price Projection:
The curved arrow indicates a potential correction from the resistance zone down toward the support levels, especially targeting Zone 4. This move reflects a typical market reaction when price meets strong resistance after a steep rally.
---
📈 Strategic Implications:
For Bulls 🐂: Wait for confirmation of support at any of the retracement levels (especially 3 or 4) before entering.
For Bears 🐻: This is an optimal area to look for short entries, especially if bearish candlestick patterns confirm rejection from the resistance zone.
---
✅ Conclusion:
Price is at a critical decision point near major resistance. A bearish reversal is likely if the resistance holds, with a corrective move toward 161.302–161.550 being the most probable target range. Traders should watch for confirmation signals before committing to positions.
---
📌 Tip: Keep an eye on candlestick patterns and volume at the resistance zone to validate the reversal hypothesis.
Eurjpyshort

eurjpy sell signal. Don't forget about stop-loss.
Write in the comments all your questions and instruments analysis of which you want to see.
Friends, push the like button, write a comment, and share with your mates - that would be the best THANK YOU.
P.S. I personally will open entry if the price will show it according to my strategy.
Always make your analysis before a trade
EURJPY SELL Signal. Don't forget about stop-loss.
Write in the comments all your questions and instruments analysis of which you want to see.
Friends, push the like button, write a comment, and share with your mates - that would be the best THANK YOU.
P.S. I personally will open entry if the price will show it according to my strategy.
Always make your analysis before a trade

EURJPY: First red day, new monthly cycle!Hello everyone and welcome back to my channel! As always, my analysis are not a financial suggestion, neither a way to predict the market direction.
Predicting and guessing is quite 50/50, my job is hunting the best trade setup for the day, and my analysis are only a tool to identify a great risk reward and to align the setup with the overall thesis.
EURJPY, ended the month of May with an interesting signal, and I'm looking to potentially complete a two week Pump and dump, if it will setup correctly during the upcoming days.
Let's see it in depth, zooming into the previous week!
Monday, opening range of the week, the weekly boundaries are in place, long triggered in the market, starting the day with a pump before Asia session.
Tuesday, initial balance, the market pumped stronger higher, expanding the range, setting the currently weekly high low.
Long traders have been triggered for the second time, and the market closed in breakout. (Other time frames may be driving this move!)
Wednesday, midpoint range of the week, nothing really happened, the market stayed inside, up high into the weekly high, closing the day as an "inside" signal, which typically can be an interesting signal for explosive move.
Thursday, the weekly high has been broken for the third time, long traders are triggered one more time, and eventually (we don't know it certainly), volume can be trapped up high, and the market could shift soon. The breakout of the weekly high, looks like failed and we might start watching for a great reversal.
Friday, last trading day of the week and the month of May, placed a lower low (breaking in structure) and pumped back up inside the daily range, near the Thursday closing price, closing the week as a first red day.
FIRST RED DAY, typical is a reversal signal when it setup properly, but as per my experience and backtest, I don't have many templates where the market fall on Monday. It might happen because it is the first day of the new month and we can see interesting moves, but currently I do not see the setup for today, unless major red news on schedule at 10am NYT might be particularly volatile.
What am I looking for?
In order to validate this signal, I want to partecipate in a pump and dump scenario, setting up during the 3 session Asia, London and NY, not necessarily today, but until the signal will be valid.
Can this market go higher?
Absolutely yes, I repeat, I'm not Nostradamus ahah I do not use technical analysis to forecast, but only to research for the risk reward eventually I will position myself in the market.
I will update this post until FRD signal will be valid!
Gianni

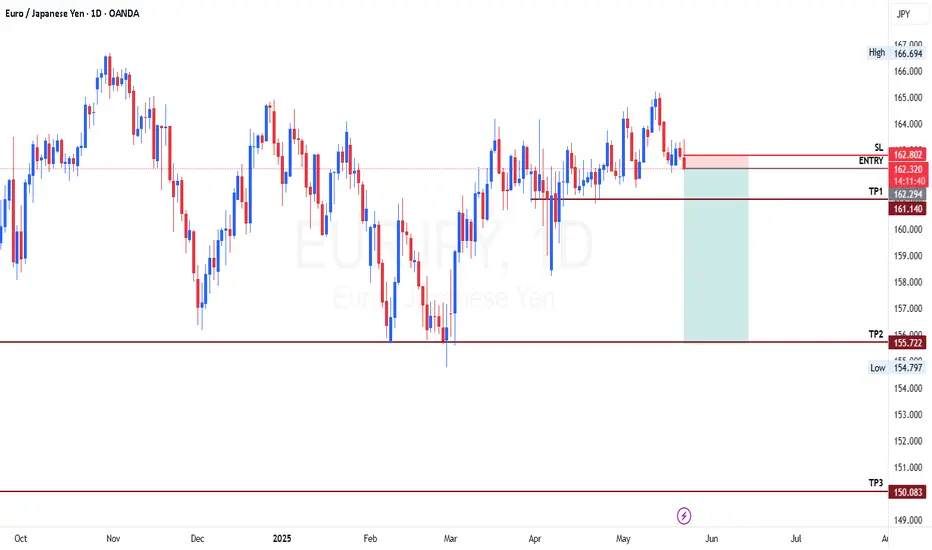
EURJPY - Look for Short (SWING) 1:XX!It’s been a while since I last shared a trading idea — here’s one for you.
EURJPY has spent the past few weeks in an accumulation phase and now looks poised to shift into a distribution phase to the downside. Let’s see how it unfolds.
Disclaimer:
This is simply my personal technical analysis, and you're free to consider it as a reference or disregard it. No obligation! Emphasizing the importance of proper risk management—it can make a significant difference. Wishing you a successful and happy trading experience!
EURJPY 15-MIN-BEARISHEURJPY is showing a bearish bias on the 15-minute chart after breaking a key demand zone, indicating a shift in intraday market structure. The break of demand suggests that buyers failed to hold their level, allowing sellers to take control.
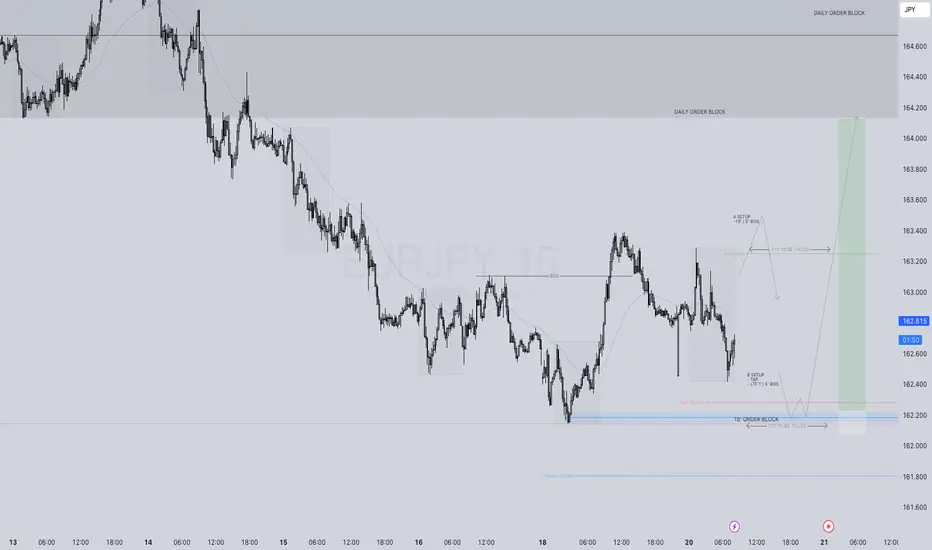
DAILY HOT PICK EURJPY LONG FORECAST Q2 W21 D20 Y25DAILY HOT PICK
FX:EURJPY
EURJPY LONG FORECAST Q2 W21 D20 Y25
GOOD MORNIG EJ, Due to higher time frame nothing-ness, the pair has been somewhat neglected BUT, We are starting so see some charting action within the lower time frame that excited pattern recognition.
Professional Risk Managers👋
Welcome back to another FRGNT chart update📈
Diving into some Forex setups using predominantly higher time frame order blocks alongside confirmation breaks of structure.
Let’s see what price action is telling us today!
💡Here are some trade confluences📝
✅HTF 50 EMA
✅Intraday 15' order block
✅Tokyo ranges to be filled
🔑 Remember, to participate in trading comes always with a degree of risk, therefore as professional risk managers it remains vital that we stick to our risk management plan as well as our trading strategies.
📈The rest, we leave to the balance of probabilities.
💡Fail to plan. Plan to fail.
🏆It has always been that simple.
❤️Good luck with your trading journey, I shall see you at the very top.
🎯Trade consistent, FRGNT X
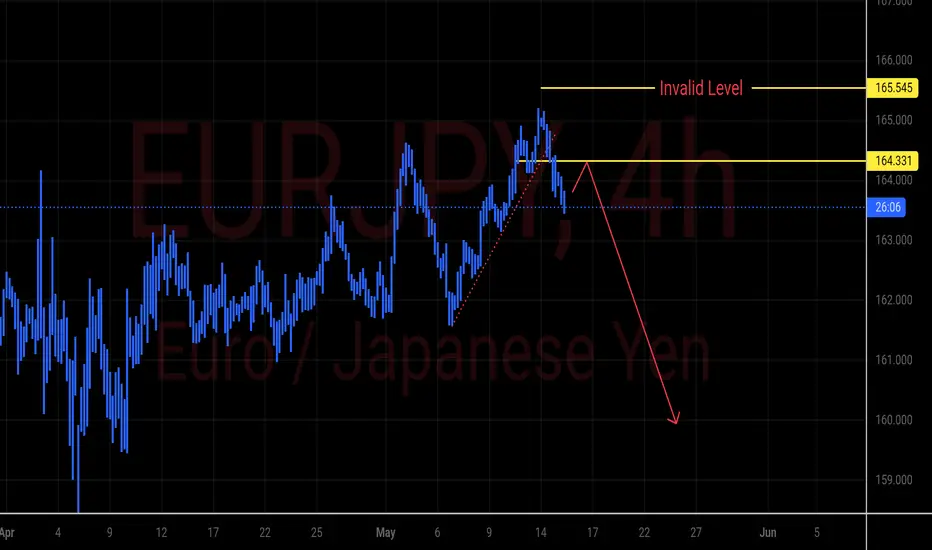
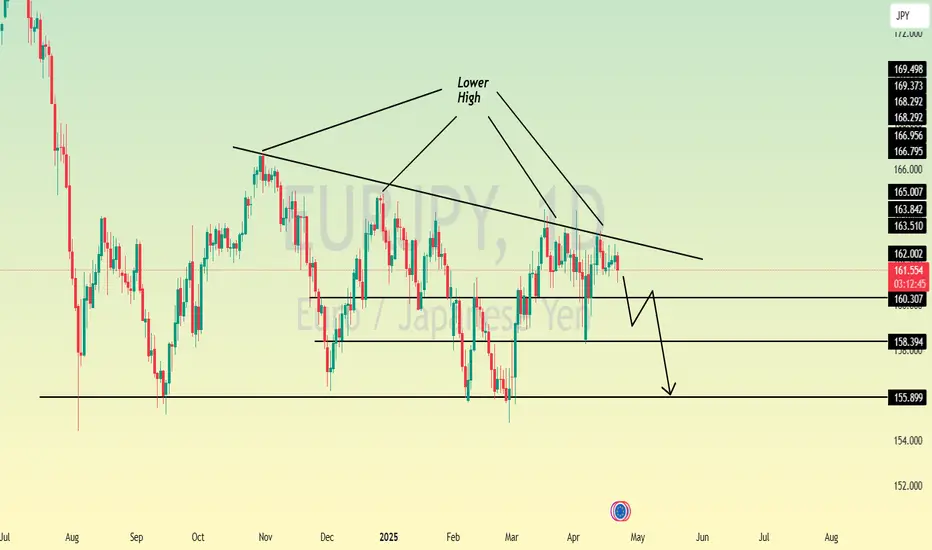
EURJPY - Breakdown Confirmation Toward Bearish ContinuationEURJPY has broken below the ascending trendline and is now trading under the key structure at **164.331**. The price appears to be forming a lower high before potentially continuing its downward move. As long as price stays below the **165.545** invalidation level, the bearish bias remains intact, with a projected target around **160.000**.
**Key Levels:**
- **Resistance (Invalid Level):** 165.545
- **Structure Break:** 164.331
- **Bearish Target:** ~160.000
**Outlook:**
Bearish continuation likely as long as price remains under resistance.
**Disclaimer:**
This is not financial advice. Trade at your own risk and always use proper risk management.
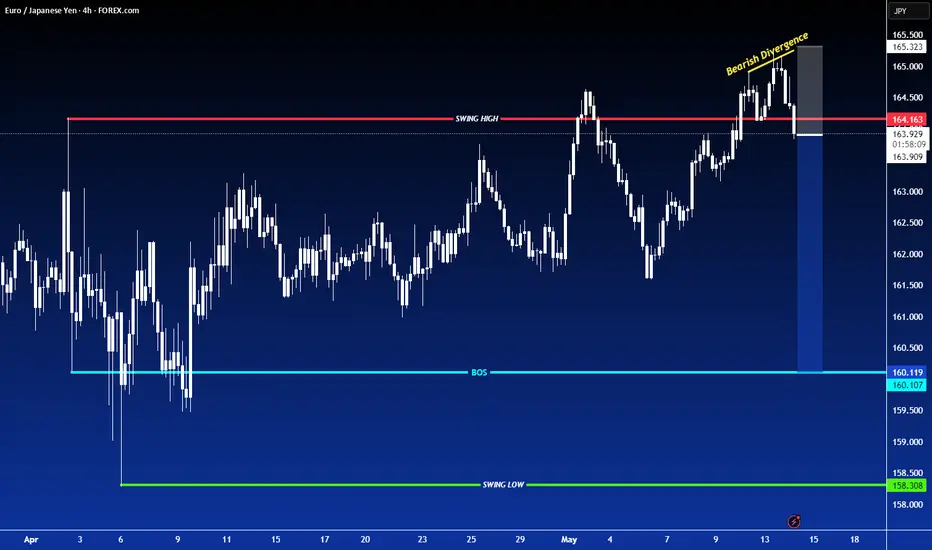
SHORT ON EUR/JPYOANDA:EURJPY has created a double top with bearish divergence at a major supply zone.
I will be selling EJ to the next level of support/demand for over 200 pips.
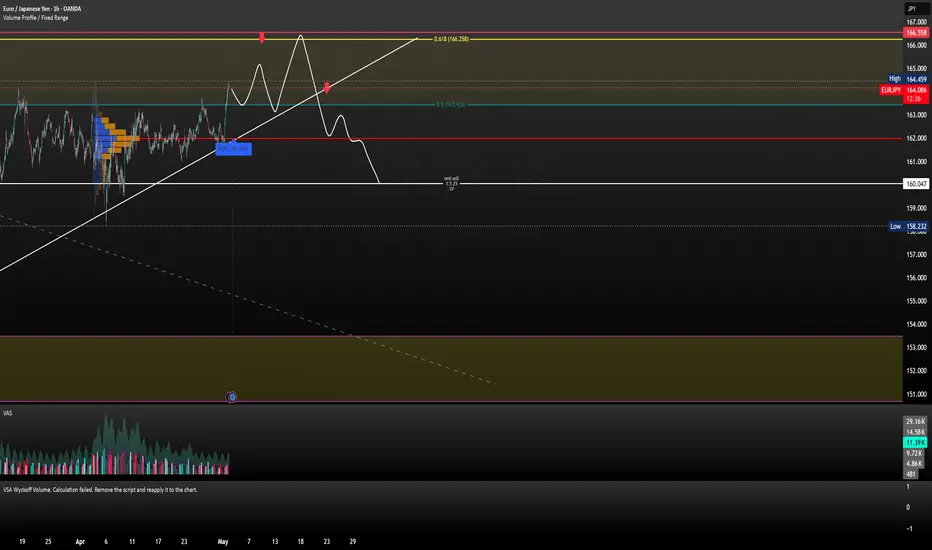
EURJPY SELLTargets @ 160 - W 618 Fib @ 166.3 - LVN @ 154 which can be seen as Target - Waiting for Volume but already scaled in!
EURJPY hit TP within 16 minutes.Yes! I love the EUR :) The signal I shared just moments ago has reached Take Profit. You can still wait for the other TP levels to be hit. That’s enough for today.
🔔 I post detailed trade ideas and daily market analysis like this every day on my TradingView profile.
👉 Follow me to get notified and read the full breakdowns.
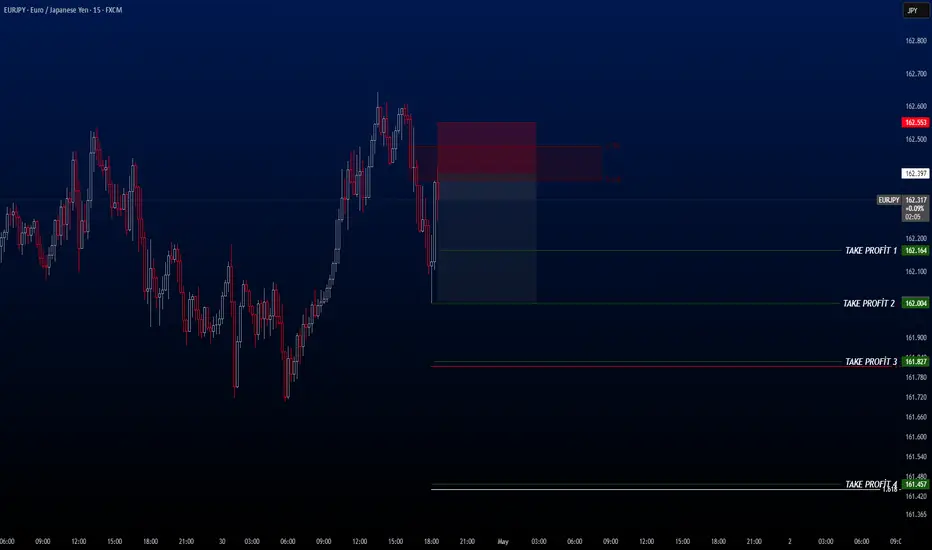
EURJPY SellLadies and gentlemen, I’ve activated a sell position on EURJPY. The TP level looks quite promising. As shown on the chart, there are 4 different TP levels — feel free to adjust your trade accordingly. I’ll personally be setting my position with a 1:2.50 Risk-Reward Ratio.
🔔 I post detailed trade ideas and daily market analysis like this every day on my TradingView profile.
👉 Follow me to get notified and read the full breakdowns.
Mid Term Short on EURJPYIn the short term, I predict a bounce back to the trendline as we sweep some liquidity around this current location. If/When we break the 155 support, we will hit a minimum of 140 and even lower.
This is an idea. If you agree with the fundamentals of the chart you can follow my trade.
Short-term target with price reversal from 1.55
Target 1 - 159
Target 2 - 161.500 (I will look for a reversal and short from this location)
Price target with price breaking below 1.55 support zone
Short Term Target - 140
Mid Term Target - 135
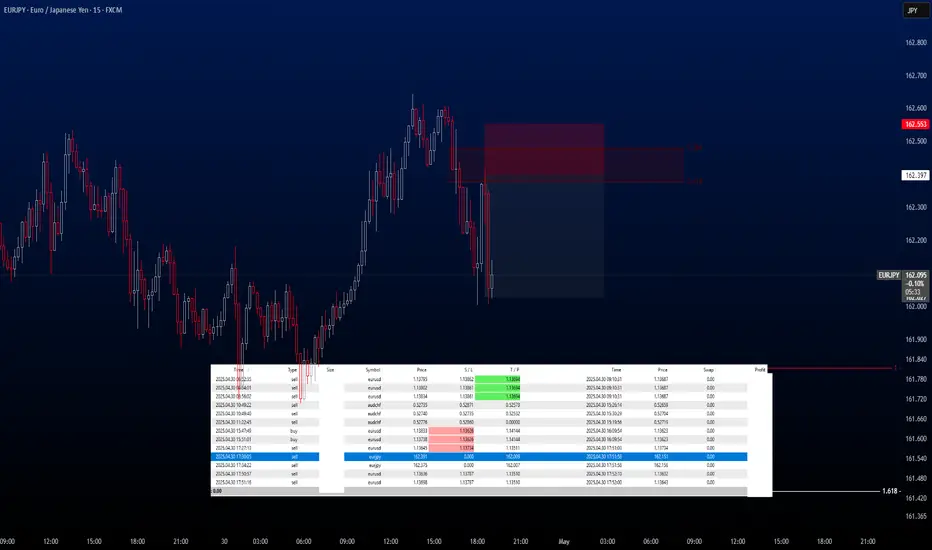
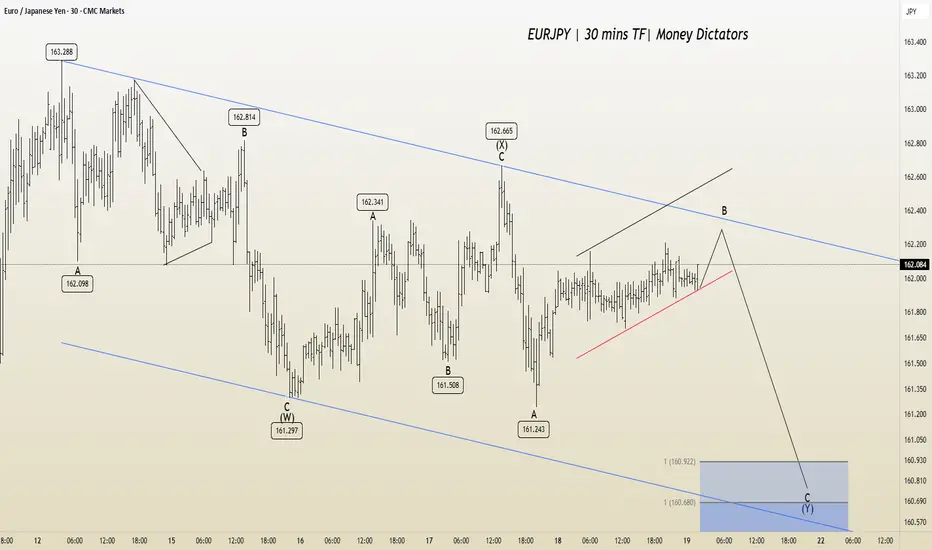
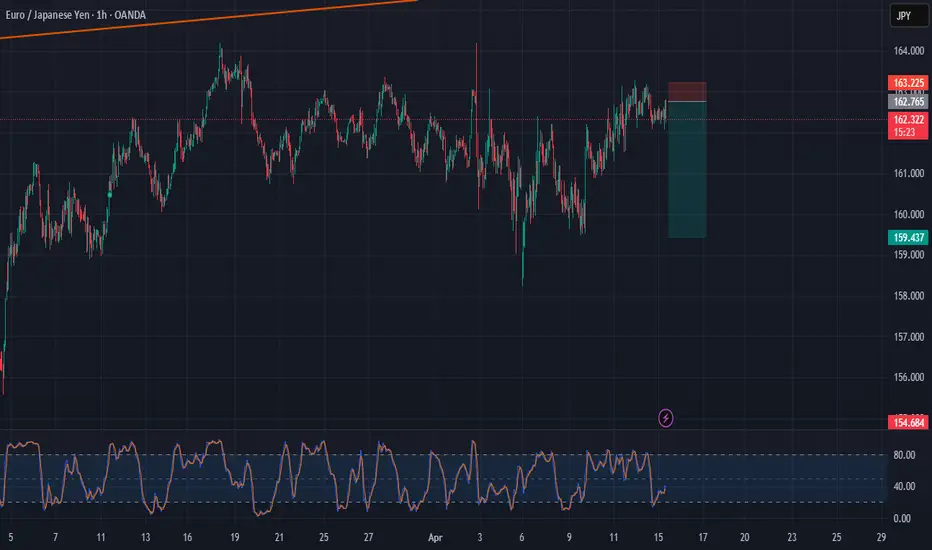
EURJPY: Short Setup with Target Zones in FocusEURJPY outlines a clear W-X-Y corrective pattern. Wave (W) ended at 161.297 , followed by an upward corrective move in Wave (X), which topped at 162.665 with a classic ABC formation.
Currently, the price is hovering around 162.084, likely forming Wave B of the final Y leg. A brief move higher could complete this B wave before the pair resumes its decline toward the 160.922–160.680 area, which marks the projected end of Wave C of (Y).
The broader correction is framed by two descending blue trendlines, providing dynamic resistance and support, while a short-term red ascending trendline is currently holding the price action but may soon give way. If the price stalls or rejects around the 162.3–162.5 zone, it could signal the start of the next leg down, making it a potential setup for short positions. After the reversal from Wave Y, potential upside targets are 161.600, 162.500 , and 163.100 .
We will update it soon!
EURJPY is in the Sell Trend after testing Lower HighHello Traders
In This Chart EURJPY HOURLY Forex Forecast By FOREX PLANET
today CADJPY analysis 👆
🟢This Chart includes_ (EURJPY market update)
🟢What is The Next Opportunity on EURJPY Market
🟢how to Enter to the Valid Entry With Assurance Profit
This CHART is For Trader's that Want to Improve Their Technical Analysis Skills and Their Trading By Understanding How To Analyze The Market Using Multiple Timeframes and Understanding The Bigger Picture on the Charts
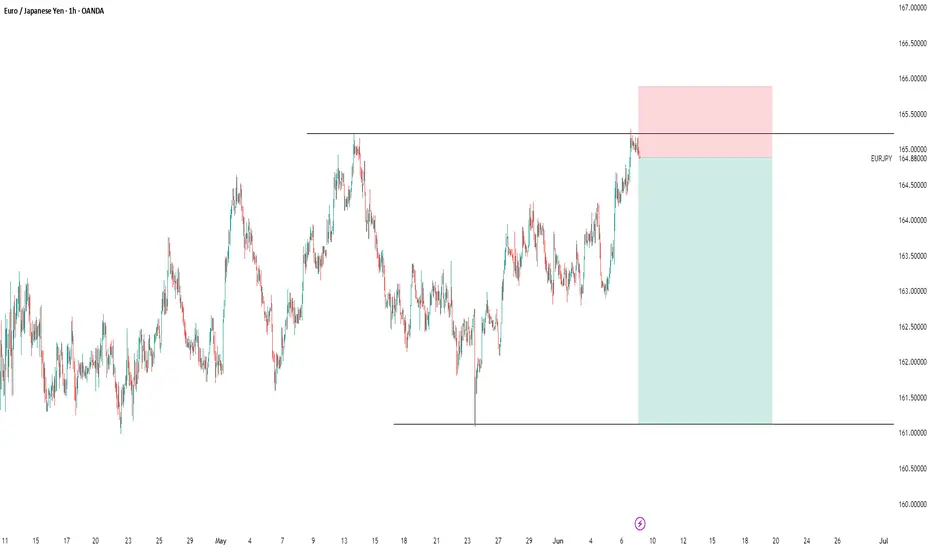
Setup of the Week: EURJPY Long Toward LiquidityI'm currently watching EURJPY for a potential long setup. Price is showing signs of bullish structure, and there’s a clean upside target sitting at 164.20, where equal highs rest on the weekly chart. That level also ends in a .20—an institutional number often used for stop placement—which adds confluence that price may be drawn toward it.
Why I'm Bullish
The Euro is showing strength across the board this week, supporting directional alignment.
Structure is starting to build bullish pressure, especially as price grinds upward toward liquidity.
We have weekly equal highs at 164.20, which is a clear magnet. (zoom out)
This setup is pretty straightforward: I’m anticipating that price wants to make a move toward those untouched highs. No extra complexity needed.
Recent Price Action
Looking at structure from April 9th:
Price sold off, took out a daily low, and then reversed sharply—classic manipulation and reclaim. The idea is that smart money will need to close those sell orders out if price returns to that zone.
The April 9th move down into 160 created what I believe is an institutional footprint.
This move took out liquidity, reversed hard, and left behind a zone I expect to be defended.
On Sunday’s weekly open, price quickly ran last week’s high, then reversed hard during the Tokyo session—a likely short-term trap. This tells me we might see some short-term bearish pressure before a larger move up, which is fine since I want price to return to the institutional buy zone around 160.00–160.30.
📍 Key Levels
Buy Zone: 160.00–160.30
This is where volume flooded in to drive the initial bullish manipulation move. If price returns, I expect heavy buying interest to step in.
Trap Confirmation: 162.80
During London open today, price ran a low, then reclaimed a high, and retested 162.80—another institutional level (ends in .80). That area acted as a trap and likely marked the start of the move down. We should see price stay under this move for this idea to work.
Target: 164.20
That’s the weekly equal high. Liquidity sits above there. If we return to the buy zone and bulls step in, I’ll be looking to ride the move up into that level.
Summary
I’m looking to long EURJPY on a retracement into 160.00–160.30, ideally after a stop hunt or false breakdown into that zone. The goal is to ride the volume push up toward the weekly target of 164.20, where stops likely sit from early sellers who might take a trendline break trade. If price respects the London trap at 162.80 and moves lower, I’ll be watching closely for reaction and confirmation in the buy zone.
Let me know your thoughts below or if you're watching the same levels.

EURJPYThe pair gave us a bearish impulse, after an impulse we expect a consolidation and continuation
EUR/JPY Bullish Reversal Setup – Entry, Stop Loss & Target StratEMA (30) - Red Line (160.596): Short-term trend.
EMA (200) - Blue Line (161.267): Long-term trend, currently above the 30 EMA indicating a bearish macro trend.
2. Entry Zone:
Marked in purple between 159.751 and 160.161, suggesting a buy (long) opportunity if price retests this demand/support zone.
3. Stop Loss:
Set just below the entry zone at 158.907, protecting against deeper bearish momentum.
4. Target Zone:
163.025 is the profit target, with a purple rectangle showing a resistance/supply zone around that level.
5. Price Action:
The price is currently consolidating near the ent

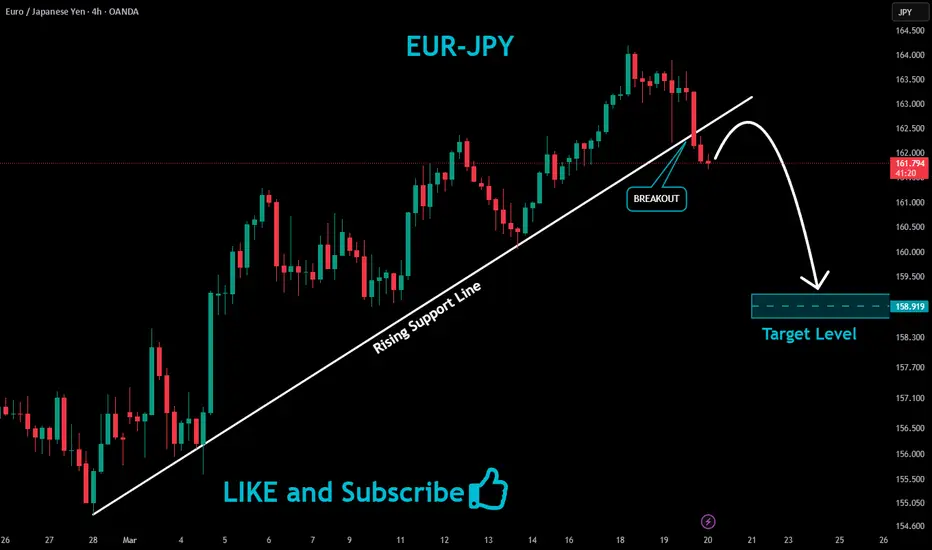
EURJPY Bearish Breakout!
HI,Traders !
EUR-JPY broke the rising
Support line and the breakout
Is confirmed so we are
Bearish biased and we
Will be expecting a
Further move down !
Comment and subscribe to help us grow !
EUR/JPY Bullish Breakout Setup with 2.02% Target PotentialEMA 30 (red): 160.813
EMA 200 (blue): 161.441
---
Highlighted Zones & Points:
1. Entry Point:
Marked around 160.719 (just below EMA 30)
Positioned in a demand/support zone (highlighted purple box)
2. Resistance Point:
Marked at 161.799
Serves as a minor resistance level before the major target
3. EA Target Point:
Final target is 163.880
This represents a potential move of 3.253 units or 2.02%
---
Interpretation:
Bullish Bias: The chart suggests a bullish setup, anticipating a breakout above EMA 200 and the resistance point toward the target of 163…

EUR/JPY – Bearish Setup with Elliott Wave AnalysisThis EUR/JPY daily chart shows an Elliott Wave analysis, suggesting a possible bearish continuation. The current wave structure indicates the pair is moving through the final phase of a five-wave impulsive sequence.
The market has completed three waves of a larger impulsive cycle, with Wave (4)
The price movement between Wave (2) and Wave (4) shows a pause or slowdown after going up. This means the buyers are losing strength, and the price may soon start to fall
If the price gets rejected near 162.900 , it could confirm further downside.
If it breaks below the 159.674 level, it may speed up the decline, with a possible target around 155.526 level.

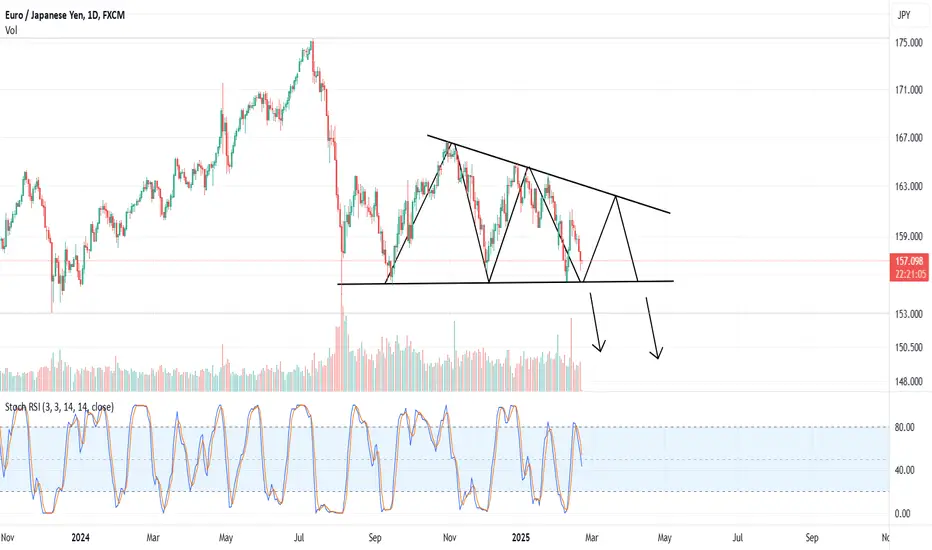
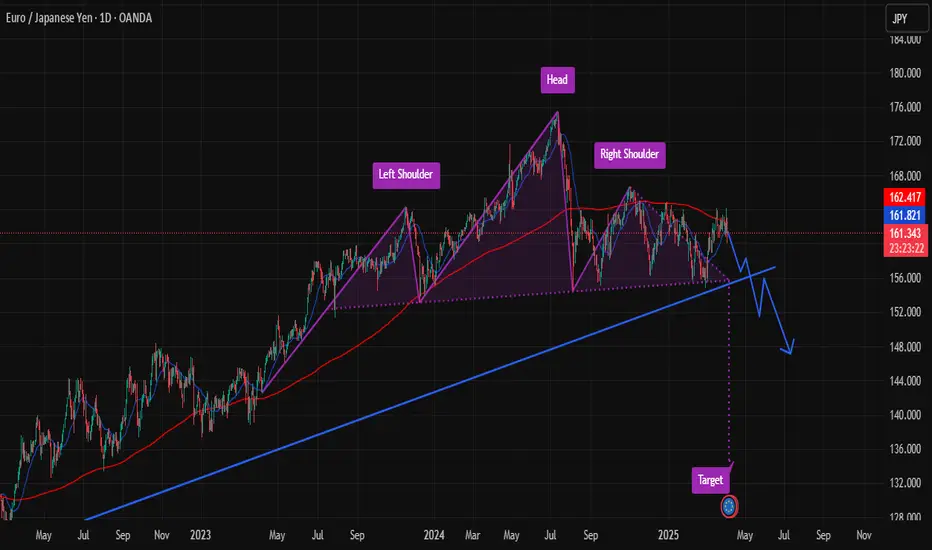
EURJPY on the Edge of Collapse: Ready for the Drop? Hi Traders ! The price has formed a Head and Shoulders (H&S) pattern on the daily (1D) chart and is approaching the neckline. If it breaks this level with strong momentum, we could see a significant decline, targeting the 135.000 - 140.000 zone.
Key Levels:
✅ Confirmation: Clear break of the trendline.
❌ Stop-loss: Above the right shoulder 165.000.
🎯 Bearish target: 135.000 - 140.000.
We’ll wait for confirmation before taking action. Stay tuned!
Disclaimer: This is not financial advice. Do your own research before making any trading decisions.
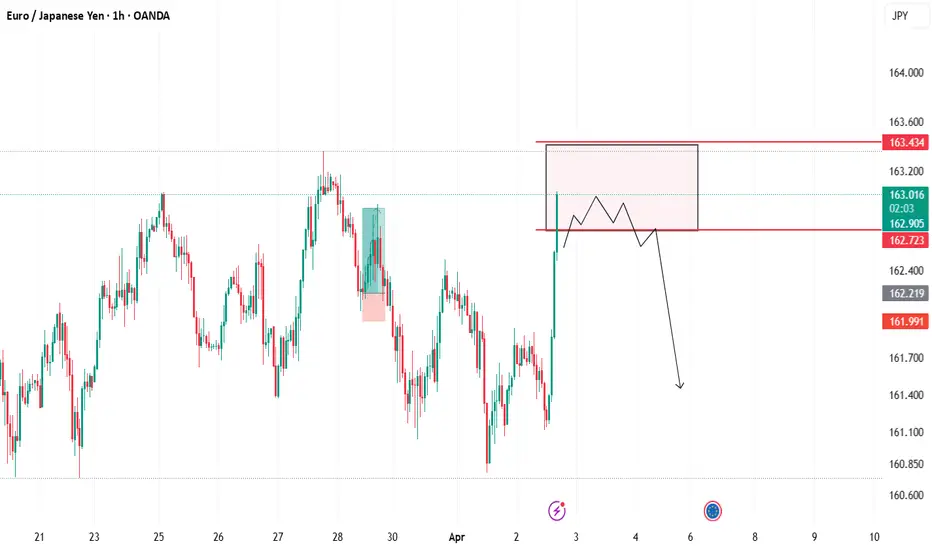
EURJPY: Selling Pressure Likely in the 162.723-163.434 ZoneHello Traders,
I trust you're doing well. It’s been a while!
Since March 18th, the EUR has been in a corrective pullback, and I anticipate further downside movement to complete Wave 4 of the correction. However, this afternoon, we witnessed an unexpected surge in the EUR pairs, driven by the EU’s emergency plan to shield its economy from U.S. tariffs. Despite this rally, I believe it may be short-lived.
EURJPY has reached a significant resistance zone where sellers could potentially push prices lower. Another key resistance level within this zone, where I believe sellers', activities are great, is last week’s high at 163.353. A confirmed break below 162.723 would strengthen the bearish outlook, with potential downside targets at 161.914 , 161.114 , 160.750 , and 160.350 , respectively. However, a breakout above 163.444 would invalidate this bearish.
Cheers and happy trading.