EURJPY: Bullish Rebound from Key Demand ZoneEURJPY has bounced off a critical demand zone and is showing signs of a bullish recovery. Despite the recent pullback, the pair’s structure remains fundamentally and technically bullish, driven by JPY weakness and EUR resilience.
Technical Analysis (4H Chart)
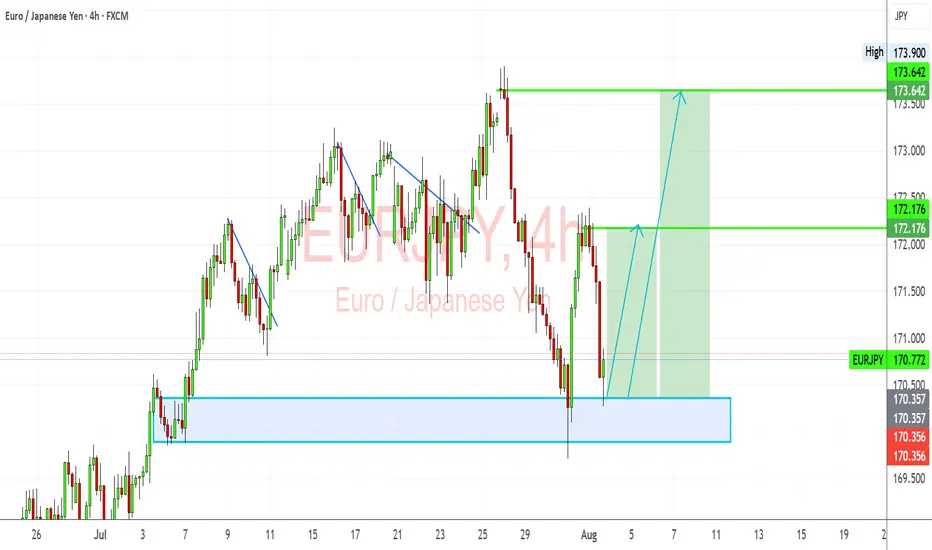
Pattern: Price tested a strong demand zone near 170.35–170.50 and rejected it aggressively.
Current Level: 170.77, starting a potential bullish leg toward higher resistance levels.
Key Support Levels:
170.35 – key demand zone and invalidation level for bulls.
169.90 – deeper support if demand zone breaks.
Resistance Levels:
172.17 – first bullish target and interim resistance.
173.64 – major target if bullish continuation sustains.
Projection: A successful rebound from 170.35 could drive price toward 172.17 initially, then 173.64 if momentum holds.
Fundamental Analysis
Bias: Bullish.
Key Fundamentals:
EUR: ECB’s slower path toward easing supports EUR stability relative to JPY.
JPY: Weakness persists as BoJ maintains dovish bias, though FX intervention risk limits JPY downside speed.
Global Sentiment: Mild risk-on mood supports EUR strength against JPY.
Risks:
BoJ verbal intervention or actual FX intervention could trigger temporary JPY strength.
Sharp reversal in global risk sentiment could weaken EUR/JPY.
Key Events:
ECB speeches and data (CPI, growth updates).
BoJ FX comments and broader market risk appetite.
Leader/Lagger Dynamics
EUR/JPY is a leader among JPY pairs, often moving in sync with GBP/JPY and CHF/JPY. Its movement also tends to precede confirmation in risk-sensitive JPY crosses.
Summary: Bias and Watchpoints
EUR/JPY is bullish from the 170.35 demand zone, with a potential move toward 172.17 and 173.64. Key watchpoints include ECB communication, BoJ stance, and market risk sentiment. As long as 170.35 holds, bulls remain in control.
Eurjpysignal
How I’m Trading the EURJPY Break of Structure Setup📈 EURJPY Analysis Update 🔍
I'm currently watching EURJPY closely. On the weekly timeframe, the pair is clearly in a strong bullish trend 🚀. Price has recently tapped into a previous daily bullish order block 🧱 — a key zone of interest.
Now, I’m watching for a break of structure (BoS) 📉 followed by a bullish continuation, especially if price pulls back into the fair value gap (FVG) 📊 near the current low.
As always, this setup — along with all key details and trade considerations — is fully broken down in the 🎥 video.
⚠️ This is for educational purposes only and not financial advice.

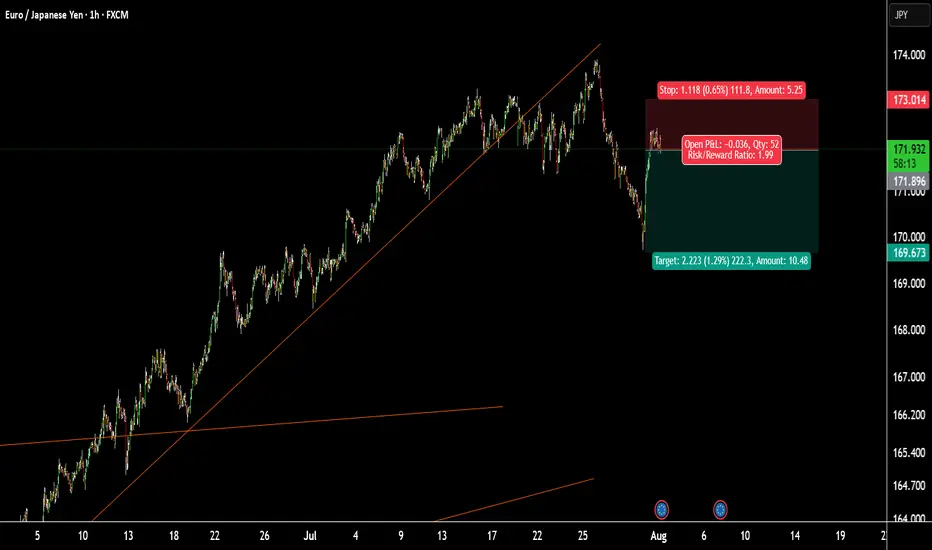
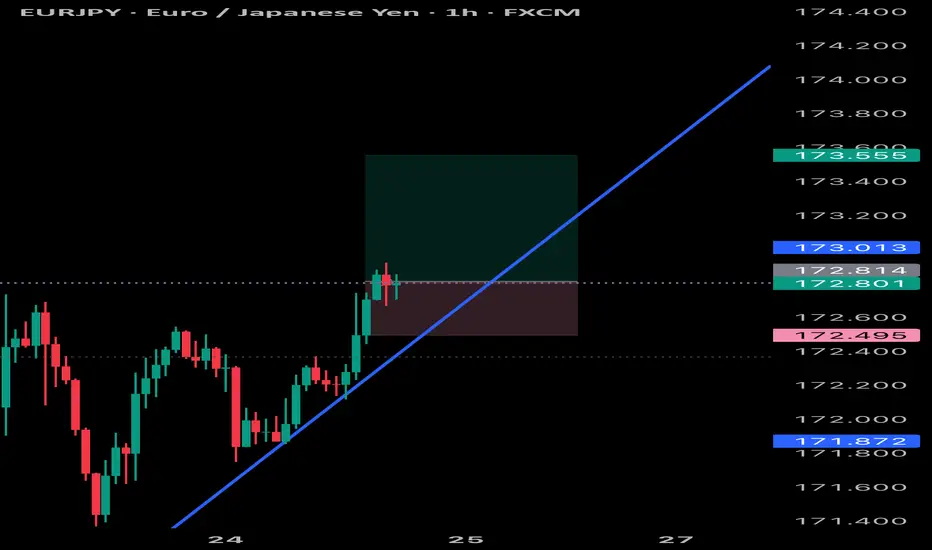
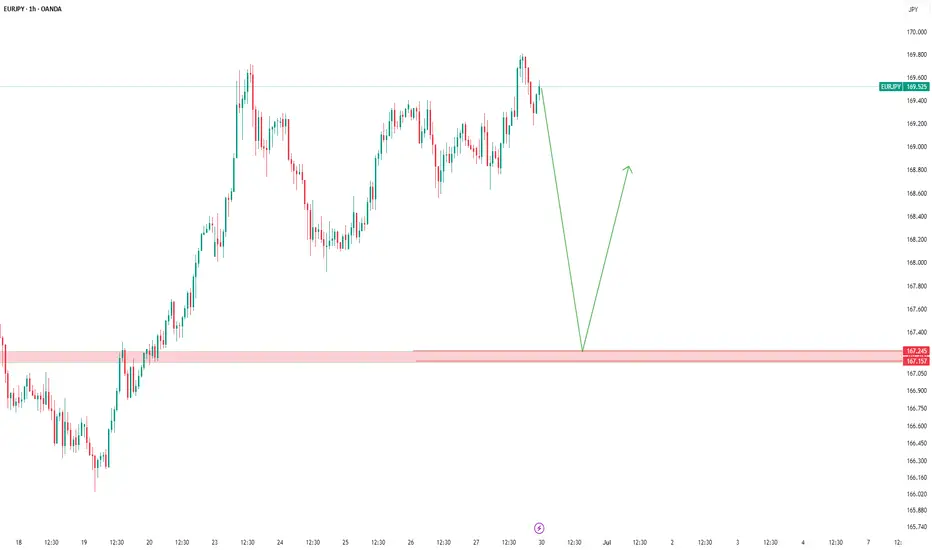
Trading the Pullback on EURJPY My Trade PlanThe EURJPY is clearly in a strong bullish trend 📈, as shown by a consistent pattern of higher highs and higher lows on the 1H timeframe ⏱️. In this video, I’m looking to capitalize on a pullback as a potential buy opportunity 🎯.
We dive into my entry strategy, explore how to align with the prevailing trend, and break down key concepts such as price action, market structure, and smart pullback zones 🧠📊.
⚠️ As always, this is for educational purposes only — not financial advice.

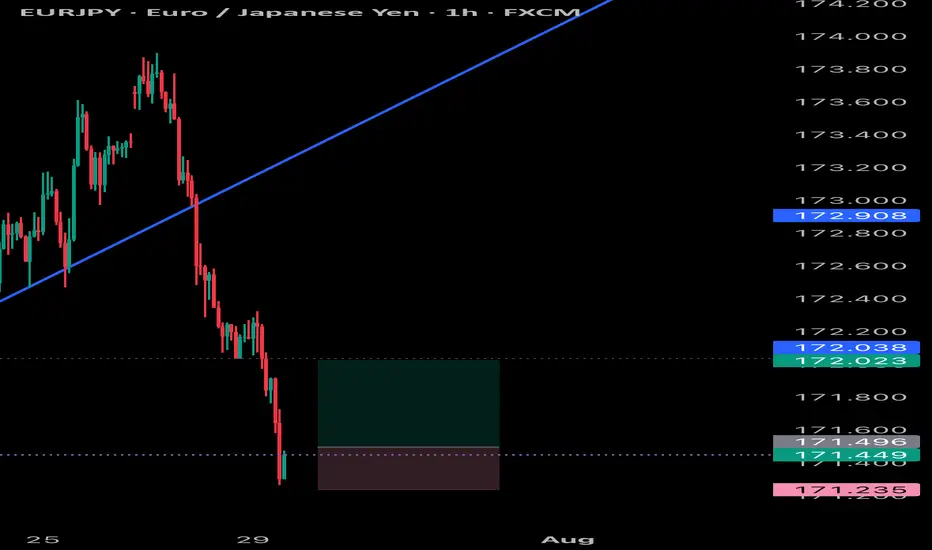
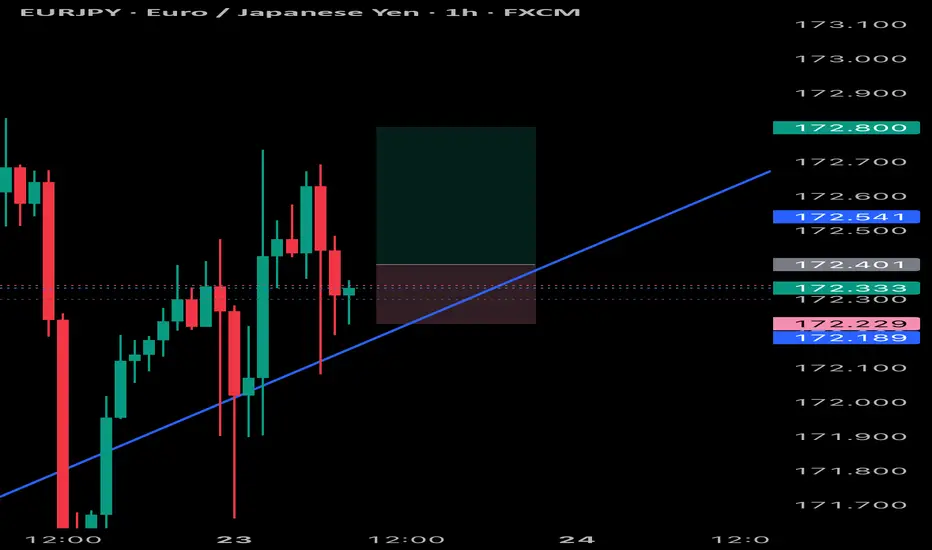
EURJPY SELLas the main trend line is brake and the lower low is accepted. I think it moves down and good for sell
EURJPY
EURJPY SWEET BLUESEurjpy has hit all take profits with very little drawdown and huge profits very quickly nice pattern, simply followed
EURJPY SCALP Eurjpy quick scalp trade as it can still drop so it would be wise to not target higher than normal take profits , but will scalp it
EURJPY BULLS Bullish move from Eurjpy and will keep following it, to its very top with small pullbacks coming but stay prepared can put buy stops
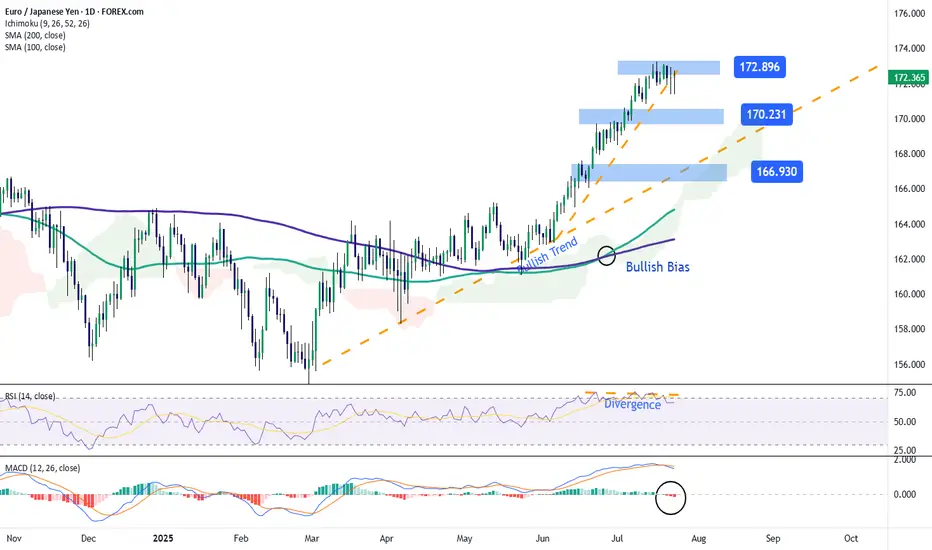
EUR/JPY: The Yen Begins to Gain GroundOver the past three trading sessions, the EUR/JPY pair has declined by up to 0.8%, as the yen has steadily gained strength, preventing the euro from maintaining its momentum in the short term. Selling pressure has held firm, especially after news that Japan finalized a new trade agreement with the United States, which lowered the initially proposed 25% tariff to 15%. This development has been perceived as a positive outcome for Japan and has supported strong demand for the yen in the latest trading session.
Uptrend Remains Intact
Despite the yen’s recent strength, it is important to note that the EUR/JPY pair remains in a well-defined uptrend, with sustained bullish momentum continuing to dominate the long-term outlook. Although some short-term selling corrections have emerged, they remain insufficient to break the current bullish structure. For now, the uptrend remains the most relevant technical formation in the chart and should continue to be monitored unless selling pressure becomes significantly stronger.
RSI
The RSI indicator has started to show lower highs, while price action continues to register higher highs. This event suggests the potential formation of a bearish divergence, which may indicate that the current selling correction could gain more traction in the coming sessions.
MACD
The MACD histogram remains close to the neutral zero line, indicating that no clear direction has formed in short-term moving average momentum. If this neutral setting continues, the chart could enter a more defined consolidation phase in the near term.
Key Levels to Watch:
172.896 – Resistance Level: This level corresponds to the recent high, and any buying momentum strong enough to break it could confirm a bullish continuation, supporting the long-standing uptrend currently in place.
170.231 – Nearby Support: This level aligns with a short-term neutral zone and may act as a temporary barrier, limiting any bearish corrections that may arise in the sessions ahead.
166.930 – Key Support: This is a critical level not seen since June of this year. If bearish pressure intensifies and the price falls to this point, it could seriously jeopardize the bullish structure that has been holding so far.
Written by Julian Pineda, CFA – Market Analyst
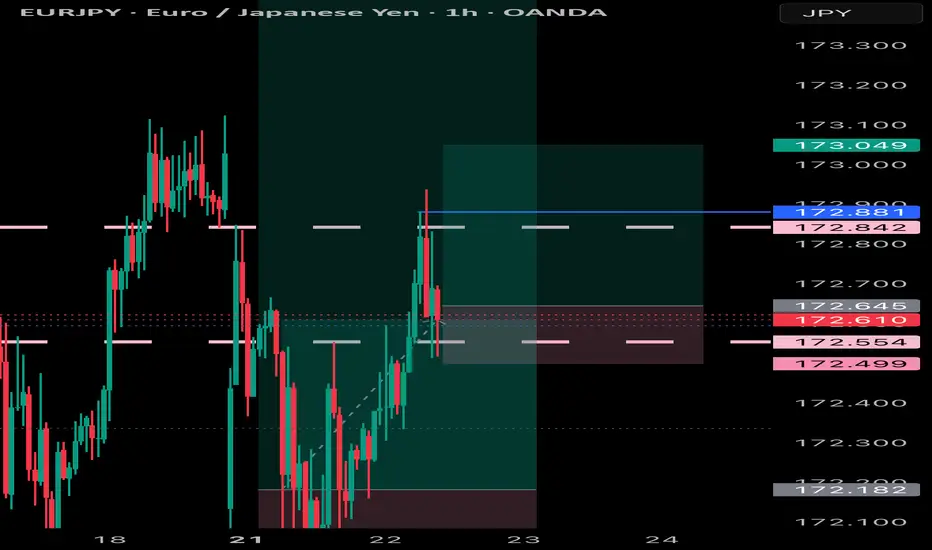
RESET PRICE FOR EJEurjpy has gone down but only to clear stops and lows but we keep following the trend because it is the only true direction for now

UP TREND Simple up trend that is being followed and respected here by the price , we BULLS are in control

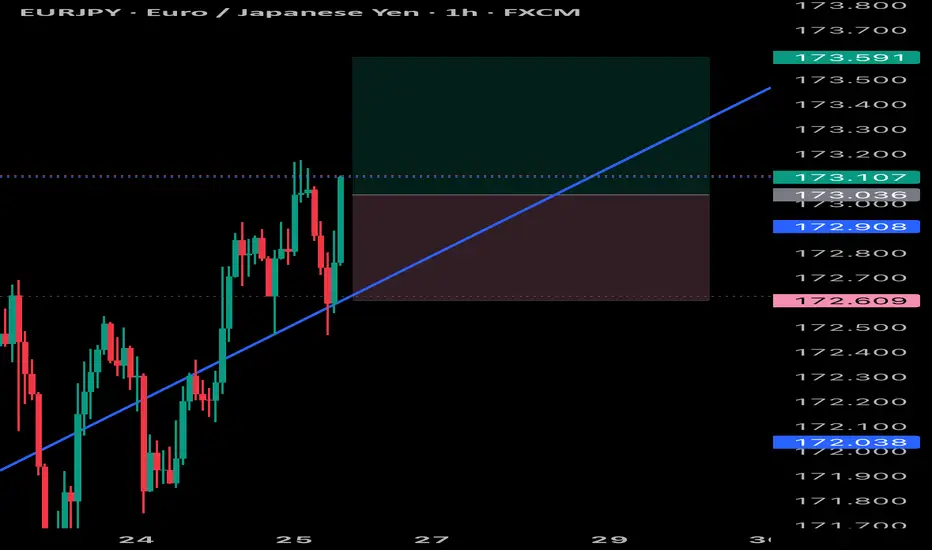
EURJPY Bullish Setup: Waiting for the Optimal Retrace EntryThe EURJPY is currently in a strong bullish trend 📈🔥. I’m anticipating a retracement into the Fibonacci 50–61.8% zone 🔄, which aligns with the equilibrium of the current price swing ⚖️. This potential pullback could present an optimal entry 🎯 — provided we see a bullish break of market structure 🔓📊 during the move down.
🛑 Stops and targets, as discussed in the video, are shared for educational purposes only — this is not financial advice 📚🚫. Please ensure you do your own analysis and risk assessment 🧠📉.

EURJPY IDEA After seeing the previous day close with bullish momentum we could expect continued push to the upside but since the 4hr is trading at a HH area a slight retrace could occur before the next bullish move to the upside

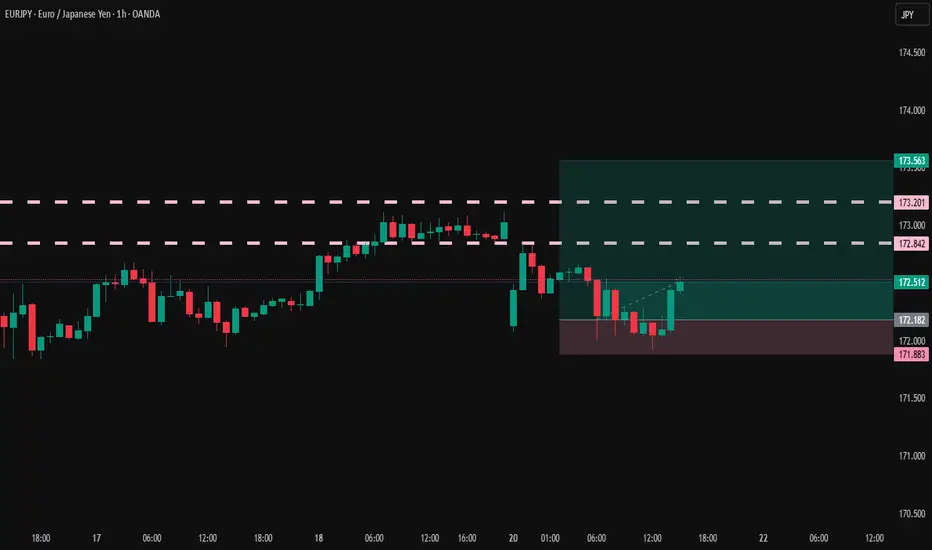
EURJPY: Bullish Trend ContinuationPrice remains in a strong uptrend, now trading above the 172.00 psychological level, targeting new liquidity above.
D1 Key Levels:
Support: 170.50 – 171.00 (daily demand zone + origin of breakout)
Resistance: Hasn't found a ceiling yet. Next key levels are psychological round numbers (173.00, 174.00).
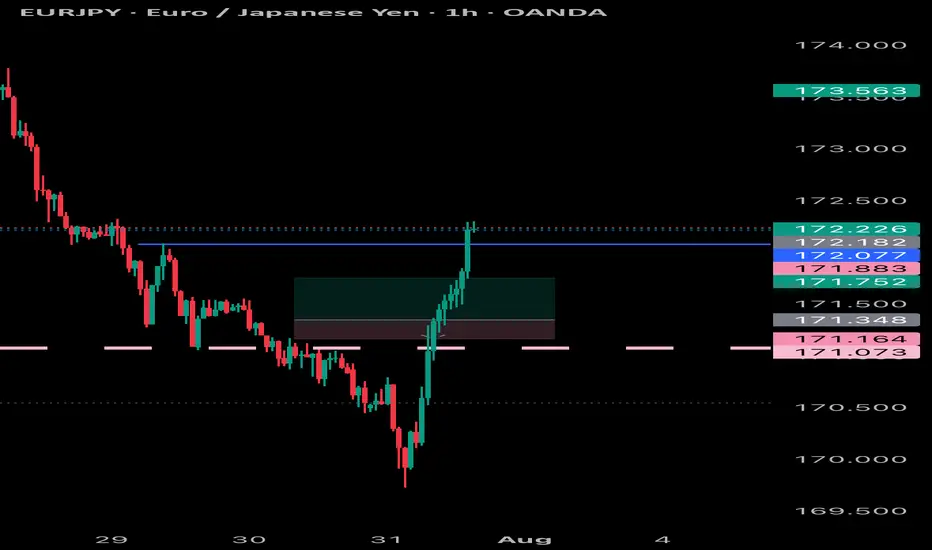
H4 Demand Zone (Pullback Area): 171.20 – 171.50
Watch for retracement into this zone for a high-probability buy setup.
H1 OB: 171.30 – 171.50 (clean mitigation zone)
Monitor M15 for bullish BOS after price taps into this zone for confirmation.
M15 Optimal Plan:
Wait for pullback into 171.30–171.50
Confirm entry with M15 bullish BOS + displacement
🟢Entry Zone: 171.30 – 171.50 (after confirmation)
SL: 170.90
TP1: 172.80
TP2: 173.50
TP3: 174.20
Breakout Alternative: If price rallies above 172.80 early in the week, look for a breakout entry on retest.
Invalidation: H4 closes below 170.50

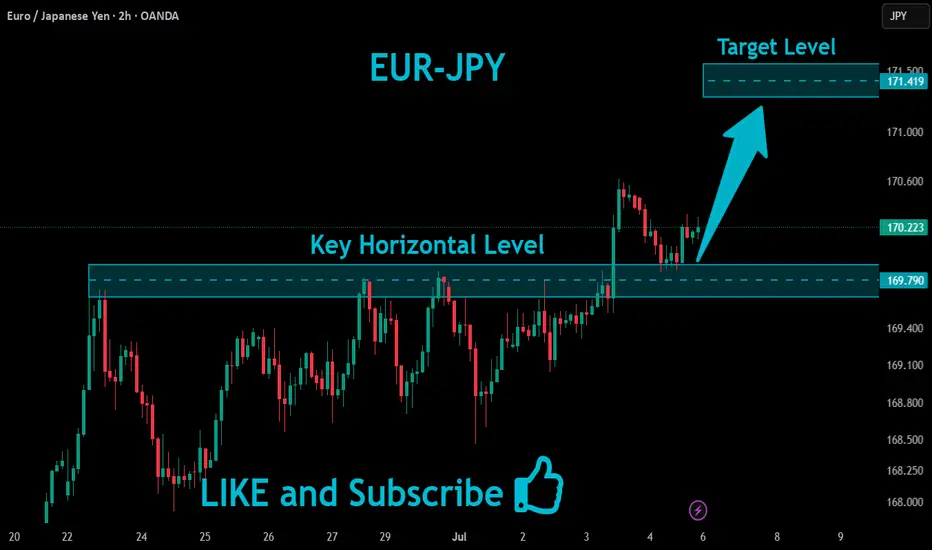
EURJPY Bullish Breakout!
HI,Traders !
#EURJPY is trading in an
Uptrend an the pair made a
Bullish breakout of the key
Horizontal level of 169.790
Which is confirmed so after
pullback we will
Be expecting a further
Bullish continuation !
Comment and subscribe to help us grow !
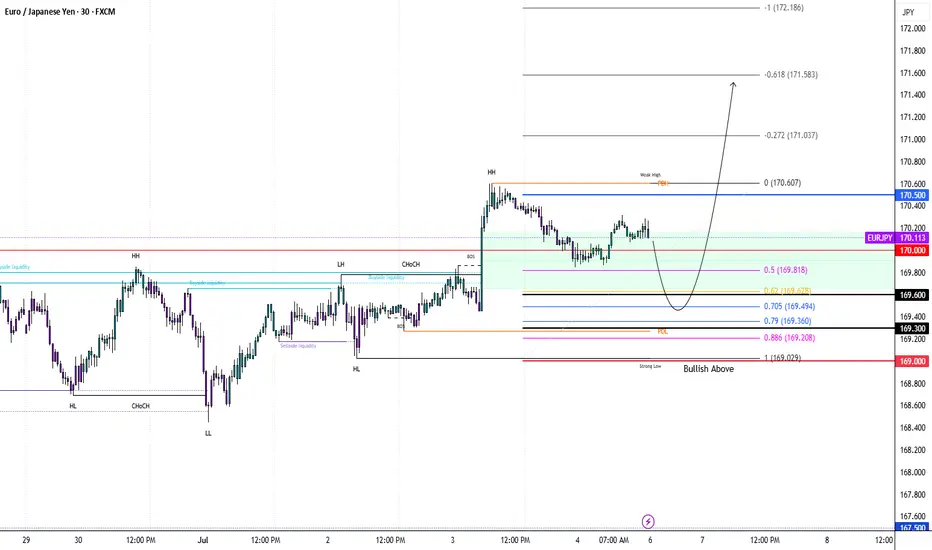
EURJPY: Trading Above Major QP 170. Strong Bullish Trend EJ broke above the key psychological level of 170.00, and has not found major resistance yet. Expecting a bullish trend continuation as long as price stays above 169.
* M30 Bullish Choch
* Creating new HHs and HLs
* M30/H1 Bearish Break Block
* M30/H1 Bullish FVG (50% filled)
🟢Entry: 168.40 – 168.60
Stop Loss: 168.00
TP1: 169.80
TP2: 170.50
TP3: 171.20
Breakout Option: If price pushes above 170.50 early in the week, consider breakout entry on retest.
Invalidation: Bias shifts to neutral if H4 closes below 169.00.
The Correlation Between EURJPY and NASDAQ You Shouldn't IgnoreCurrently keeping a close eye on EURJPY — price action has been bullish 📈, showing a strong upward push on the daily timeframe 🕒.
Right now, we’re seeing a bit of indecision 🤔, which is fairly typical for a Monday session as the market finds its footing.
🔍 I’m watching for continuation to the upside, as long as NASDAQ remains bullish. That said, NASDAQ is looking quite overextended 🧗, and a pullback could trigger a short-term retracement in the euro as well — these two tend to move in correlation 🔗, so keep a close watch on NAS100 for early clues.
If EURJPY consolidates sideways ⏸️, and we then get a clear break of market structure to the upside 🚀, I’ll be looking for a long setup on the retest and failure of the range floor — textbook continuation play 🎯.
As always, this is not financial advice — full breakdown in the video 🎥.

EURJPYAs our followers may remember, we already secured a great profit on EURJPY.
Now, we're once again waiting for price to revisit our key level — so we can potentially catch another high-probability setup.
📌 Always remember:
The market is unpredictable.
We're not here to predict — we're here to react, using technical analysis, clear setups, proper risk and trade management.
❌ If a level breaks, we don’t panic.
✅ Instead, we patiently wait for a pullback and take advantage of the next smart entry.
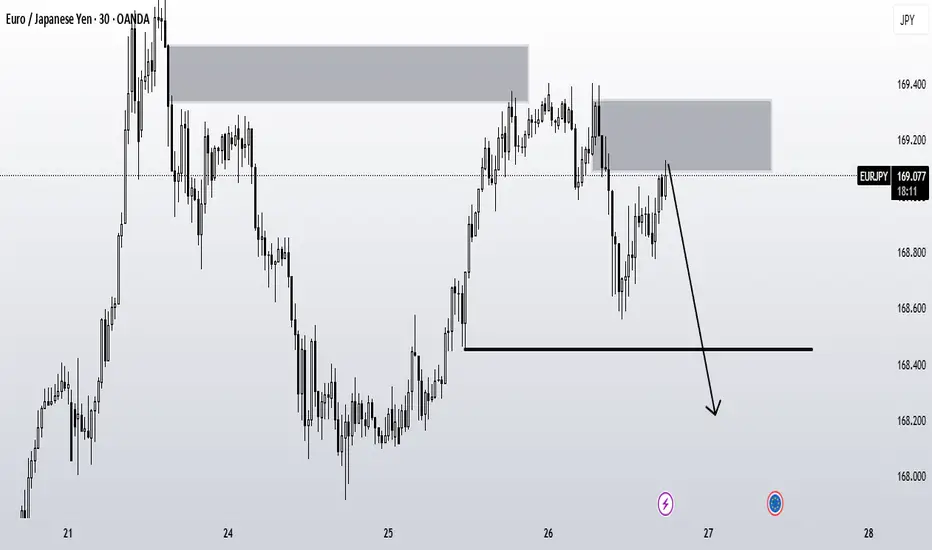
EURJPY : m30 (Short Position)By analyzing the 30-minute time frame and observing liquidity at the lows, I have a bearish scenario from 169.10 down to 168.20
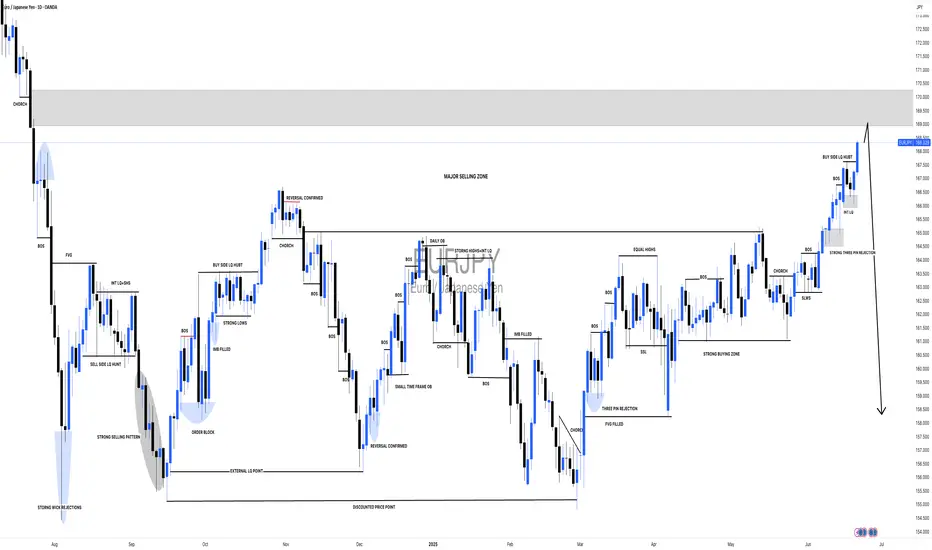
EURJPY: A Big Move In Making, Please Share Your Views! Date: 22/06/2025
Hello everyone,
I hope you’re all having a good weekend. As we previously discussed, we expected a sharp decline in Europe/JPY, but unfortunately, it didn’t work out in our favour due to the extremely bullish US dollar. This led to the crossing and invalidation of our two selling zones.
Looking at next week’s price projection, we can confirm that the price is heading towards 170.50 and may be selling at this level. Therefore, we will be keeping a stop loss at 171.50.
Once the trade is activated, we can set our target at 166.0, 163.50, and the final target will be placed at 158.50.
If you like our work, please like our idea.
Good luck and trade safely next week.