EUR/USD Daily Chart Analysis For Week of May 23, 2025Technical Analysis and Outlook:
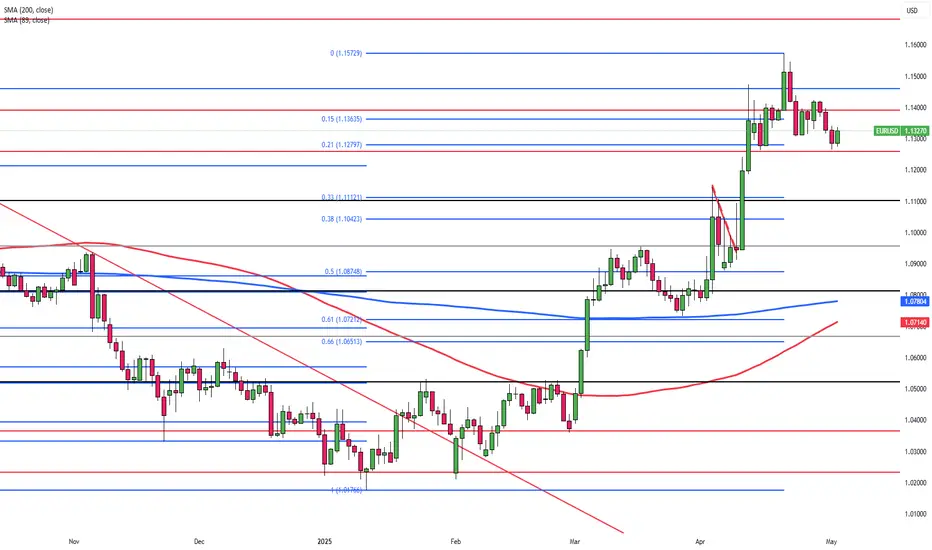
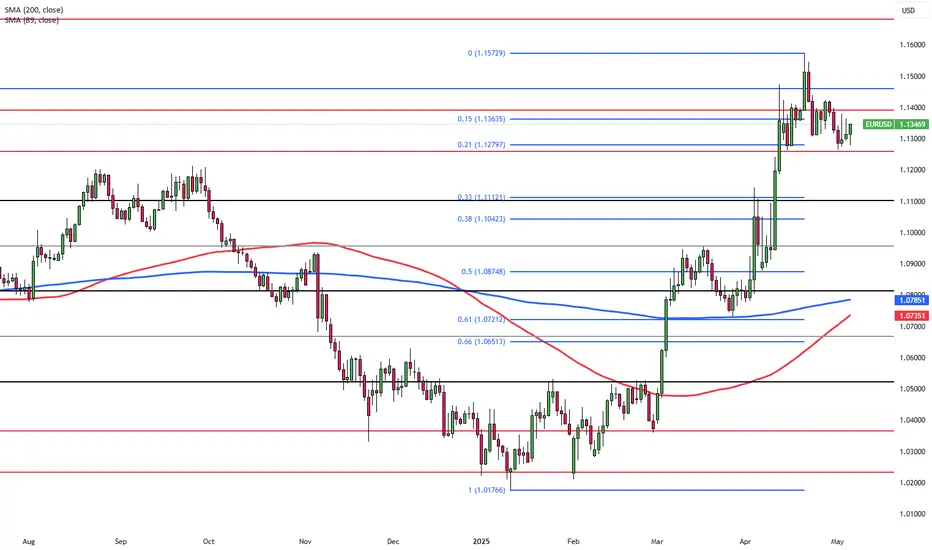
The Eurodollar has demonstrated significant strength during this week's trading session, attaining a notable Inner Currency Rally at 1.129 and encountering Mean Resistance at 1.137. Recent analyses indicate that the Euro will likely progress towards the forthcoming target levels, specifically the Mean Resistance at 1.142 and the Key Resistance at 1.151. A retest of the completed Outer Currency Rally at 1.157 may facilitate this advancement. However, a potential downward pullback could emerge from the current price range, particularly in proximity to the Mean Resistance level of 1.137, with a possibility of declining to the Mean Support at 1.127.
Eurodollar
EUR/USD Rebounds, Eurozone Data EyedEUR/USD climbed to around 1.1310 during Friday’s Asian session, rebounding as U.S. Treasury yields declined, the 30-year yield slipped from its 19-month high of 5.15%, weighing on the dollar. The recovery follows the House passing Trump’s fiscal bill, which revived deficit worries. Earlier, strong U.S. PMI figures (Composite: 52.1, Manufacturing & Services: 52.3) had briefly strengthened the dollar.
Fed Governor Waller hinted at possible rate cuts if tariffs stabilize, while Trump renewed threats of higher tariffs on the EU. On the European front, ECB officials expect inflation to return to near 2% by end-2025, though growth remains subdued. Eurozone PMIs showed services at 48.9 and manufacturing at 49.4. Focus now shifts to Germany’s GDP release.
Resistance is at 1.1390, with higher levels at 1.1460 and 1.1580. First support lies at 1.1260, followed by 1.1100 and 1.1050.

Euro Extends Rally Ahead of PMI DataEUR/USD trades near 1.1340 during Asian hours, close to two-week highs, extending gains for a fourth session ahead of Eurozone PMI data expected to show improved growth for May.
The U.S. dollar remains under pressure as markets await Thursday’s S&P Global PMI. Moody’s downgraded the U.S. credit rating to Aa1, matching earlier cuts by Fitch and S&P, citing rising debt, projected to reach 134% of GDP by 2035, and a nearly 9% deficit.
Trump’s tax-cut plan cleared the House Rules Committee, but the DXY still trades lower near 99.50.
The key resistance is located at 1.1390, and the first support stands at 1.1260.

EUR/USD Regains PaceEUR/USD Regains Pace
EUR/USD started a decent upward move above the 1.1225 resistance.
Important Takeaways for EUR/USD Analysis Today
- The Euro found support and started a recovery wave above the 1.1250 resistance zone.
- There is a connecting bullish trend line forming with support at 1.1280 on the hourly chart of EUR/USD at FXOpen.
EUR/USD Technical Analysis
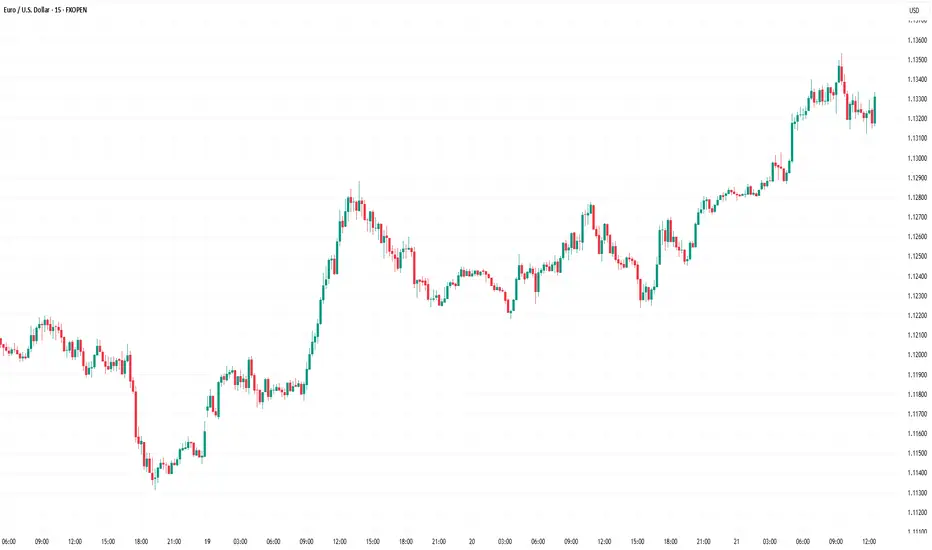
On the hourly chart of EUR/USD at FXOpen, the pair started a fresh increase from the 1.1135 zone. The Euro climbed above the 1.1200 resistance zone against the US Dollar.
The pair even settled above the 1.1225 resistance and the 50-hour simple moving average. Finally, it tested the 1.1340 resistance. A high is formed near 1.1339 and the pair is now consolidating gains above the 23.6% Fib retracement level of the upward move from the 1.1223 swing low to the 1.1339 high.
Immediate support is near the 1.1310 level. The next major support is at 1.1280. There is also a connecting bullish trend line forming with support at 1.1280 and the 50% Fib retracement level of the upward move from the 1.1223 swing low to the 1.1339 high.
If there is a downside break below 1.1280, the pair could drop toward the 1.1225 support. The main support on the EUR/USD chart is near 1.1135, below which the pair could start a major decline.
On the upside, the pair is now facing resistance near 1.1340. The next major resistance is near the 1.1420 level. An upside break above 1.1420 could set the pace for another increase. In the stated case, the pair might rise toward 1.1550.
This article represents the opinion of the Companies operating under the FXOpen brand only. It is not to be construed as an offer, solicitation, or recommendation with respect to products and services provided by the Companies operating under the FXOpen brand, nor is it to be considered financial advice.
US Credit Downgrade and Brexit Progress Lift EuroThe euro approached the $1.13 mark on Tuesday, extending its rebound from the one-month low recorded on May 12. The rally followed a broad-based weakening in the US dollar after Moody’s downgraded the US credit rating from Aaa to Aa1, citing mounting government debt and widening fiscal deficits. The downgrade sparked investor concerns about long-term US economic stability and pressured dollar-denominated assets.
The EU and UK finalized a provisional agreement addressing key post-Brexit issues such as defense, fisheries, youth mobility, and security cooperation. The deal may pave the way for UK companies to participate in major EU defense projects, marking a potential turning point in EU-UK relations.
The European Central Bank is expected to initiate a rate cut in June, with additional easing possible later in the year. Despite these expectations, the euro has held firm, buoyed by both geopolitical developments and dollar weakness.
EUR/USD now faces resistance at 1.1260, with further upside barriers at 1.1460 and 1.1580. Support lies at 1.1040, followed by 1.1000 and 1.0960.
Symmetrical Triangle Breakout: EUR/USD Eyes Higher Levels..!📊 EUR/USD Technical Analysis – Breakout Watch..! 💥
🕰 Timeframe: 4H | 📅 Date: May 20, 2025
By: @Kartik\_Elkunchwar
The EUR/USD pair is showing an **interesting structure** with strong breakout potential. Here's the breakdown:
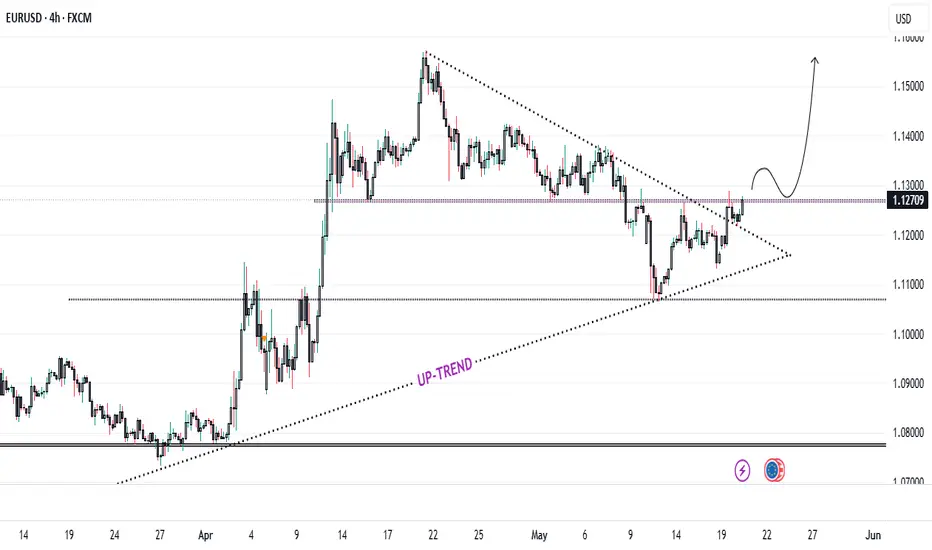
🔍 Chart Pattern Observed: Symmetrical Triangle
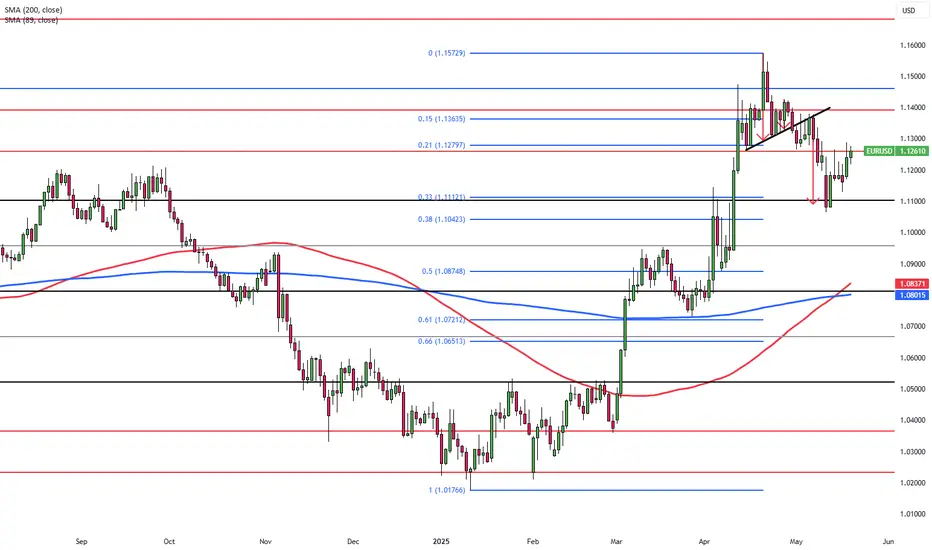
After a strong uptrend since late March, price consolidated into a symmetrical triangle, marked by lower highs and higher lows.
This formation typically indicates indecision in the market, but it often precedes a strong breakout.
📈 Uptrend Intact
The dotted line labeled UP-TREND shows that the bullish momentum is still present, with price respecting the rising support line over time.
This trendline has acted as a reliable dynamic support, reinforcing the bullish bias.
🔔 Recent Price Action
Price recently broke out above the upper trendline of the triangle, closing around **1.1275**.
This breakout is accompanied by a surge in momentum and could signal the resumption of the bullish trend.
📌 Key Levels to Watch
Resistance Zone: 1.1300 – If price breaks and sustains above this level, we could see a rally toward **1.1400–1.1450**.
Support Zone: 1.1200 and 1.1100 – In case of a false breakout or retest, these levels may act as buying opportunities.
🧠 Conclusion
The EUR/USD pair is giving a **potential long setup** after consolidating for weeks. A confirmed breakout above the triangle indicates **buyers may be gaining control**. Watch for a **retest and bounce** for higher conviction entries.
📉 What’s your take on EUR/USD? Bullish or Bearish..?
Drop your analysis in the comments! 💬
EUR/USD) breakout trand line analysis Read The ChaptianSMC trading point update
Technical analysis 1-hour EUR/USD (Euro vs US Dollar) chart using Smart Money Concepts (SMC) and technical confluence. Here's the idea behind the analysis:
---
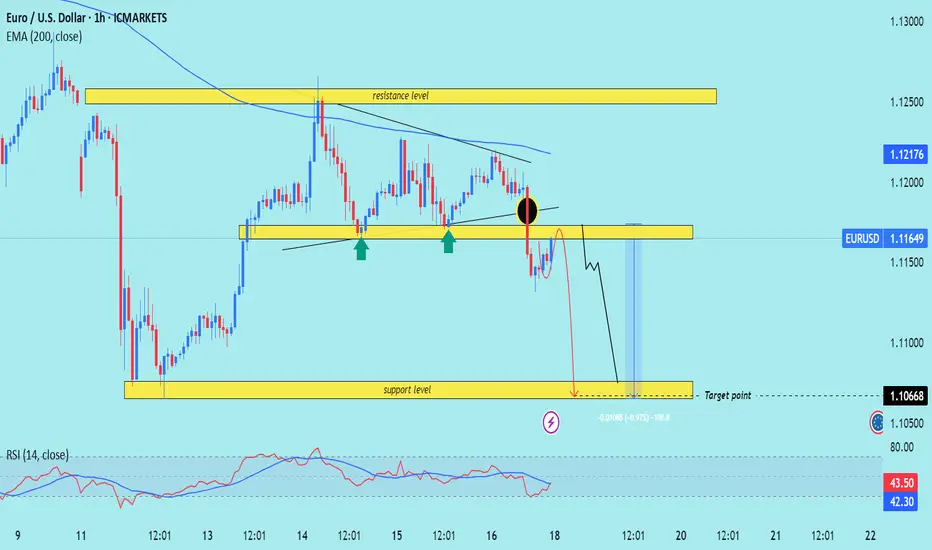
1. Bearish Rejection Setup
Strong resistance zone around 1.12176–1.12500 has been tested multiple times and held.
Bearish rejection is shown with a black circle indicating a breakdown from previous support turned resistance (support flip).
Price failed to stay above the key structure, indicating bearish intent.
---
2. Break of Structure
The support level near 1.11600 has been broken, marked by the black circle.
This is a clear change in structure, implying a likely shift from bullish to bearish.
---
3. Price Action Forecast
The chart expects a minor pullback (retest) into the broken support zone (now resistance).
Followed by a continuation move to the downside, targeting the support level at 1.10668.
Projection shows a ~100 pip drop from current levels.
---
4. EMA & RSI
EMA 200 is trending downward and acting as dynamic resistance.
RSI (14) is under 50 and sloping down, suggesting bearish momentum is building.
Mr SMC Trading point
---
Conclusion
This is a bearish continuation setup based on structure break, failed bullish momentum, and confirmation via indicators. The analyst expects EUR/USD to reject the 1.116 area again and drop toward the 1.10668 target.
Pelas support boost 🚀 analysis follow)
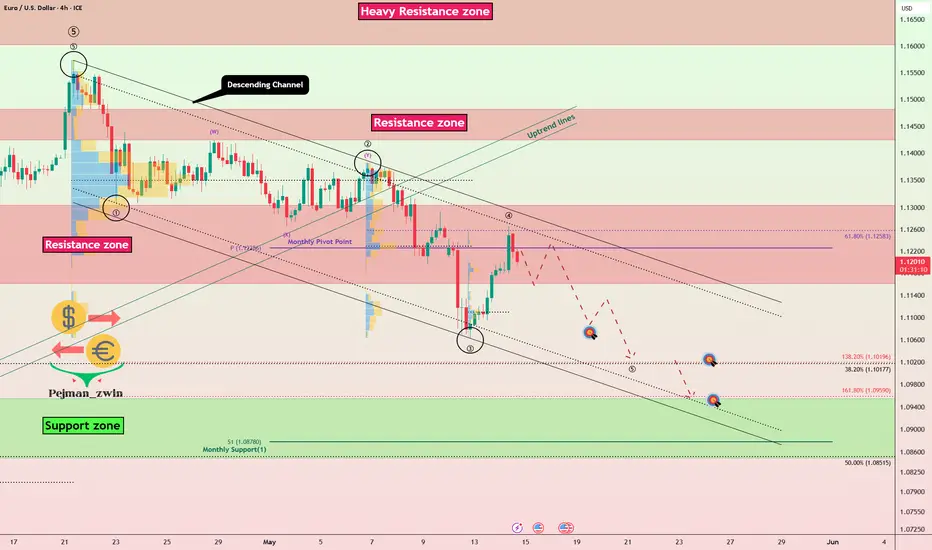
EURUSD Near Top Of Channel — Correction Imminent!!!EURUSD ( FX:EURUSD ) is trading in the Resistance zone($1.1310-$1.1162) , near the upper line of the descending channel and the Monthly Pivot Point .
In terms of Elliott wave theory , it seems that EURUSD has completed five main impulse waves , and with the break of the Uptrend lines , we should expect corrective waves . Most likely, EURUSD is completing microwave 4 , and we should expect the next decline and the formation of microwave 5 .
I expect EURUSD to fall to at least $1.1073 , and the next targets are marked on the chart.
Note: If EURUSD touches $1.1330 , we should expect further gains.
Please respect each other's ideas and express them politely if you agree or disagree.
Euro/U.S. Dollar Analyze (EURUSD), 4-hour time frame.
Be sure to follow the updated ideas.
Do not forget to put a Stop loss for your positions (For every position you want to open).
Please follow your strategy and updates; this is just my Idea, and I will gladly see your ideas in this post.
Please do not forget the ✅' like '✅ button 🙏😊 & Share it with your friends; thanks, and Trade safe.
EUR/USD Daily Chart Analysis For Week of May 16, 2025Technical Analysis and Outlook:
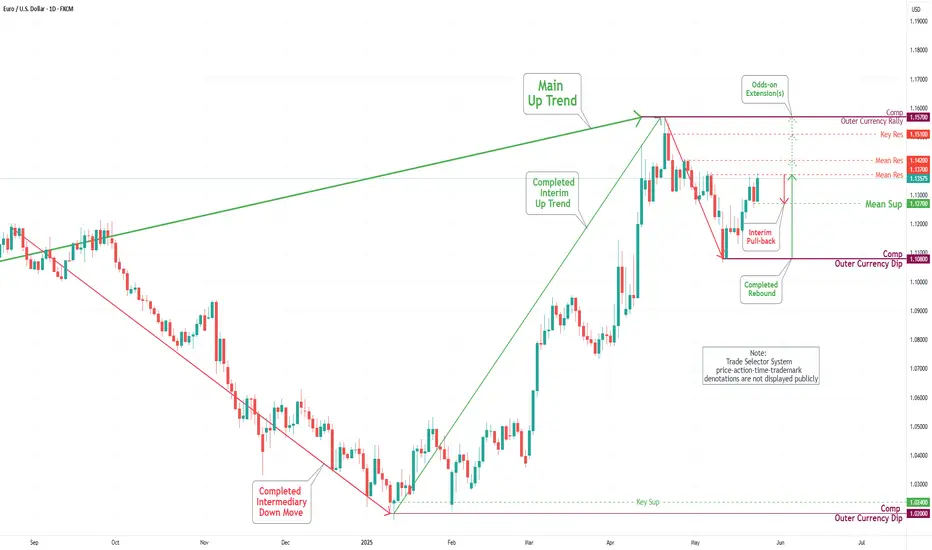
During the current trading session, the Eurodollar has exhibited notable signs of weakness, ultimately reaching a critical Outer Currency Dip at 1.111, facilitated by Mean Support at 1.119. Following this decline, the market experienced a pronounced rebound. Recent analysis indicates that the Euro will likely close with a retest of the completed Outer Currency Dip at 1.111, while it may progress towards the next Outer Currency Dip at 1.095. It is essential to highlight that upward "dead-cat" rebounds may arise within the current price range, particularly around the Mean Resistance level of 1.125, and could potentially approach an Inner Currency Rally at 1.129.

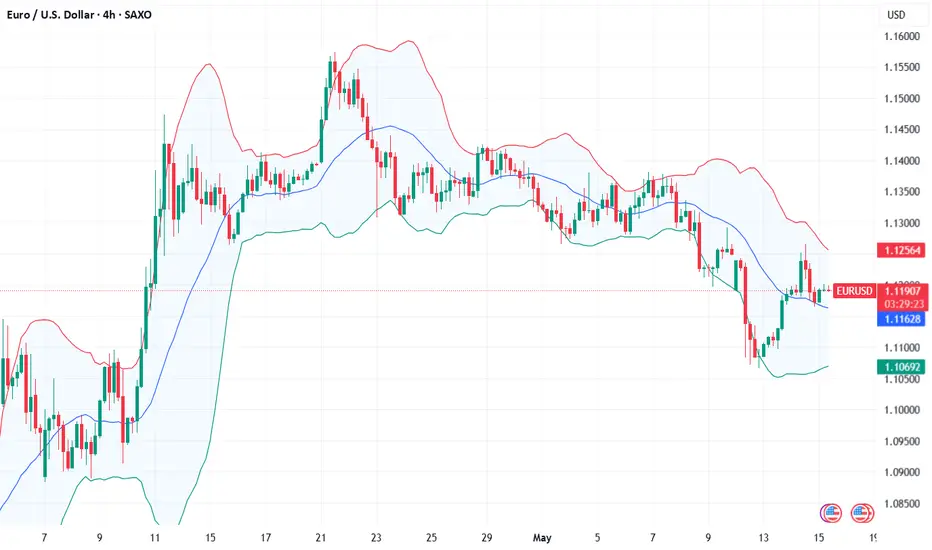
Fundamental Market Analysis for May 15, 2025 EURUSDEUR/USD is holding near 1.12000 in Thursday's Asian session, recovering the day's losses as the euro (EUR) gains momentum ahead of the preliminary Eurozone gross domestic product (GDP) report for Q1 2025 to be released later in the day.
The euro is being bolstered by growing confidence in its role as a reserve currency. Analysts at Capital Economics noted that the single currency is now in its strongest position in years and is closing the gap with the US dollar (USD) in global reserves. This shift is partly due to the policies of US President Donald Trump, which are seen as undermining the traditional appeal of the USD as a “safe-haven currency”. Further boosting the euro's reserve status was Germany's move to loosen fiscal restraints to boost defense and government spending, sparking additional demand for the currency.
Meanwhile, European Central Bank (ECB) officials continue to emphasize the need for further interest rate cuts amid growing confidence that U.S. tariff measures will not significantly boost inflation in the eurozone. While interest rate cuts usually have a negative impact on the euro, the currency has so far remained resilient.
EUR/USD is also finding support from a softer US Dollar as markets remain cautious amid continued, albeit slightly diminished, trade uncertainty. Attention now turns to upcoming US data releases, including retail sales and the Producer Price Index (PPI).
Adding to the broader context, speculation is growing that Washington may favor a weaker dollar to boost its trade competitiveness. The Trump administration has argued that an overvalued dollar puts U.S. exporters at a disadvantage against competitors with weaker currencies.
Trading recommendation: BUY 1.11900, SL 1.11400, TP 1.12600
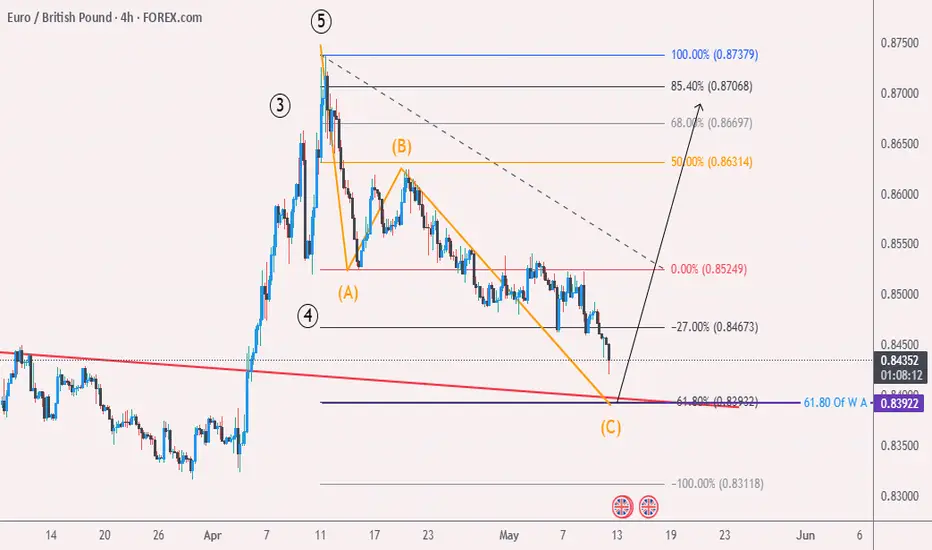
Eur/Gbp May/12 elliott Wave Hello eveyone...
i was wrong last time..
so 5th wave compelted and we are in C wave so i'm looking for buy in the end of c wave...
Fundamental Market Analysis for May 12, 2025 EURUSDEUR/USD is retreating from the gains made in the previous session, trading near 1.12400 in Monday's Asian session. The Euro (EUR) has been under pressure since European Central Bank (ECB) official Olli Rehn said last week that the ECB may consider cutting interest rates at its next meeting, provided that upcoming forecasts confirm a continued trend of disinflation and slowing economic growth.
Despite this, EUR/USD found some support thanks to optimism surrounding the trade talks between the US and China that took place in Geneva. Both sides reported “substantial progress” after two days of talks aimed at de-escalating the ongoing trade dispute. Chinese Vice Premier He Lifeng called the talks an “important first step” in stabilizing bilateral relations, while U.S. Treasury Secretary Scott Bessent echoed his sentiment, noting significant progress.
Markets are now awaiting Washington's response to the European Commission's proposed countermeasures against U.S. tariffs. On Thursday, the Commission launched a public consultation that outlined potential tariffs on up to 95 billion euros worth of imports from the U.S. if trade talks break down.
Meanwhile, the U.S. economic outlook remains uncertain. Federal Reserve (Fed) officials have noted the risk of stagflation, and Fed Chairman Michael Barr has warned that higher tariffs could disrupt supply chains, leading to higher inflation, lower growth and higher unemployment. Investors remain cautious as further escalation of trade tensions could pose serious problems for the US economy.
Trading recommendation: BUY 1.12300, SL 1.11900, TP 1.13000

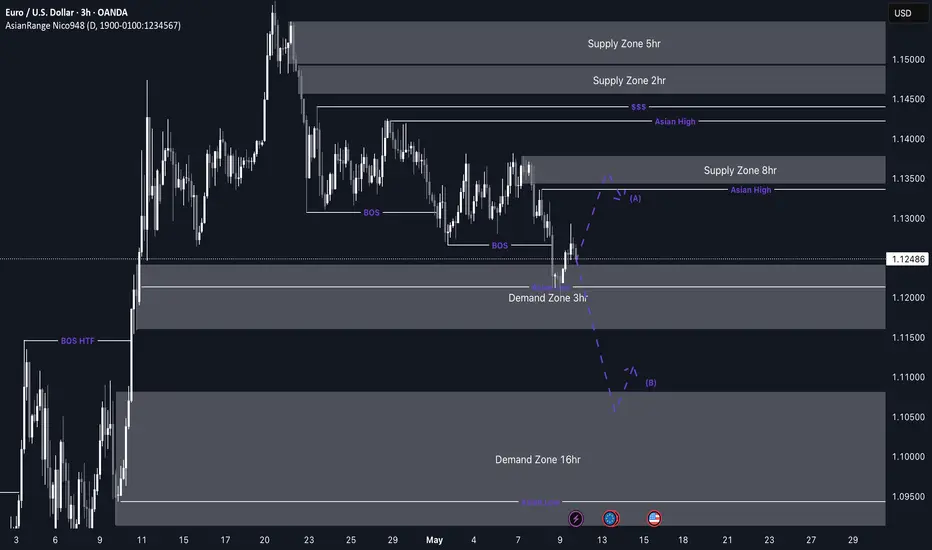
EUR/USD bearish outlookEUR/USD Weekly Outlook – Bearish Scenario in Play
This week’s outlook for EUR/USD is leaning towards a bearish continuation.
Price recently respected the 3H demand zone and gave a clean bullish reaction following the expected Asia low sweep. I didn’t manage to catch an entry as it happened quite late in the day. However, that same demand zone now looks to be weakening, potentially leading to another break of structure to the downside.
Alternatively, we could see price push higher from this demand zone and mitigate the 8H supply zone I’ve marked out — which is the origin of the last break of structure. It’s also a strong POI given its location away from liquidity and at an extreme structural point.
Confluences for EUR/USD Sells:
- Multiple breaks of structure to the downside (pro-trend setup)
- Failing 3H demand zone already mitigated
- Liquidity resting below current price
- Strong 8H supply zone sitting above the Asia highs
- DXY is showing short-term bullish momentum, aligning with EUR/USD bearish movement
P.S. If price doesn’t push higher into the 8H supply zone, I’ll be watching for a new supply zone to form mid-week for a more immediate short opportunity.
Will keep this updated — have a great trading week everyone!
EUR/USD Daily Chart Analysis For Week of May 9, 2025Technical Analysis and Outlook:
During this week's trading session, the Eurodollar exhibited signs of weakness following a rebound at the Mean Resistance level of 1.137. With decisive, vigorous bearish price activity, the currency pair decisively breached the critical Mean Support level of 1.128. Current market indicators suggest that the Euro will likely close on a Mean Support level of 1.119, moving further towards an Outer Currency Dip at 1.111. However, it is essential to acknowledge that upward dead-cat rebounds may re-emerge at the present price range level.

Market Analysis: EUR/USD Trims GainsMarket Analysis: EUR/USD Trims Gains
EUR/USD extended losses and traded below the 1.1250 support.
Important Takeaways for EUR/USD Analysis Today
- The Euro struggled to clear the 1.1380 resistance and declined against the US Dollar.
- There is a key bearish trend line forming with resistance at 1.1240 on the hourly chart of EUR/USD at FXOpen.
EUR/USD Technical Analysis
On the hourly chart of EUR/USD at FXOpen, the pair failed to clear the 1.1380 resistance. The Euro started a fresh decline below the 1.1300 support against the US Dollar.
The pair declined below the 1.1250 support and the 50-hour simple moving average. Finally, the pair tested the 1.1200 level. A low was formed at 1.1196 and the pair is now consolidating losses. The pair is showing bearish signs, and the upsides might remain capped.
There was a minor increase toward the 23.6% Fib retracement level of the downward move from the 1.1381 swing high to the 1.1196 low. Immediate resistance on the upside is near the 1.1240 level.
There is also a key bearish trend line forming with resistance at 1.1240. The next major resistance is near the 1.1290 zone and the 50-hour simple moving average or the 50% Fib retracement level of the downward move from the 1.1381 swing high to the 1.1196 low.
The main resistance sits near the 1.1335 level. An upside break above the 1.1335 level might send the pair toward the 1.1380 resistance. Any more gains might open the doors for a move toward the 1.1420 level.
On the downside, immediate support on the EUR/USD chart is seen near 1.1200. The next major support is near the 1.1165 level. A downside break below the 1.1165 support could send the pair toward the 1.1120 level.
This article represents the opinion of the Companies operating under the FXOpen brand only. It is not to be construed as an offer, solicitation, or recommendation with respect to products and services provided by the Companies operating under the FXOpen brand, nor is it to be considered financial advice.

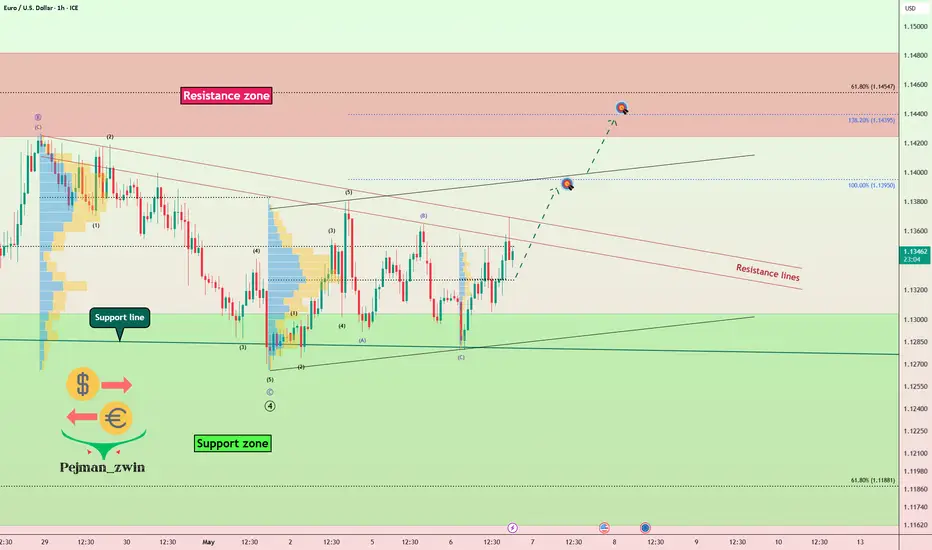
EURUSD Is Ready to Break Resistance LinesEURUSD ( FX:EURUSD ) is trying to break the Resistance lines , it has tried several times in the past few days but failed. Will EURUSD succeed this time?
In terms of Elliott wave theory , it seems that EURUSD has completed the main wave 4 near the Support zone($1.1300-$1.1160) and Support line , and we should wait for impulsive waves . Breaking the Resistance zone($1.1480-$1.1420) can confirm the end of the main wave 4 . Otherwise , the main wave 4 can have other forms.
I expect EURUSD to break the Resistance lines in this attack and rise to at least $1.1384 , and the next target can be around $1.1437 .
Note: If EURUSD can break below $1.1272(the worst Stop Loss(SL)), we can expect more dumps.
Please respect each other's ideas and express them politely if you agree or disagree.
Euro/U.S. Dollar Analyze (EURUSD), 1-hour time frame.
Be sure to follow the updated ideas.
Do not forget to put a Stop loss for your positions (For every position you want to open).
Please follow your strategy and updates; this is just my Idea, and I will gladly see your ideas in this post.
Please do not forget the ✅' like '✅ button 🙏😊 & Share it with your friends; thanks, and Trade safe.
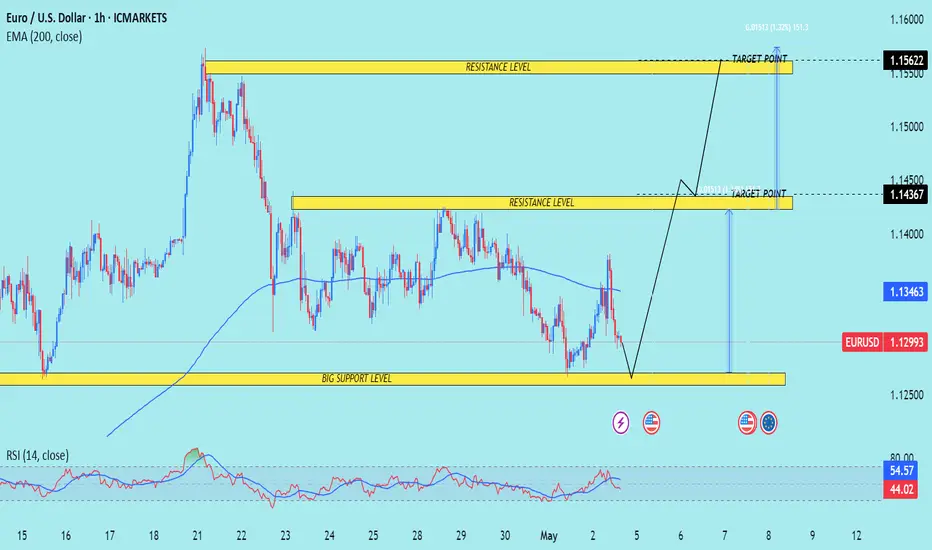
EUR/USD) Big Support level Analysis Read The ChaptianSMC Trading point update
Technical analysis of EUR/USD on the 1-hour timeframe. The idea centers around a potential reversal from a major support zone, aiming for higher resistance targets. Here's a detailed breakdown:
---
1. Big Support Level
A strong horizontal support zone is highlighted around 1.1275–1.1290.
Price is currently reacting off this level, suggesting a potential bullish reversal.
2. EMA 200 as Resistance
The 200-period EMA (~1.1346) is above current price, possibly acting as a dynamic resistance.
A break and hold above it could confirm bullish momentum.
3. Resistance Levels & Target Points
The first target is the 1.14367 resistance level, a clear supply zone.
The second target point is around 1.15622, aligned with a previous major high and strong resistance zone.
4. RSI Indicator
RSI is at 44.02, indicating neutral to slightly oversold conditions—this supports a potential bullish move, especially from support.
5. Forecast Path
The chart projects a likely pullback and breakout pattern:
Rebound from the support zone.
Break through EMA 200 and minor resistance.
Rally toward first and second targets.
Mr SMC Trading point
---
Summary of the Idea:
This is a trend-reversal-to-continuation setup, with EUR/USD expected to rise from a key support area toward 1.14367, and potentially 1.15622, provided price holds above the support and breaks the EMA 200.
Pales support boost 🚀 analysis follow)
Euro Pressured Ahead of Fed DecisionThe euro is trading around $1.1315 on Tuesday, pressured by a stronger U.S. dollar ahead of the Federal Reserve’s policy decision, where rates are expected to remain unchanged. However, the dollar still faces headwinds from doubts over its safe-haven appeal and President Trump’s unpredictable tariff stance. A dovish Fed or continued skepticism toward the dollar may limit euro losses.
Resistance levels are seen at 1.1460, then 1.1580 and 1.1680, while support rests at 1.1260, followed by 1.1200 and 1.1150.
EUR/USD) one side of breakout and move Read The ChaptianSMC Trading point update
technical analysis of the EUR/USD currency pair on the 1-hour timeframe, showing two ptential scenarios based on price behavior around a key supply zone.
1. Key Levels:
Resistance/Target Point (Upper): ~1.15729
Supply Zone (Current Price Area): ~1.14100–1.14500
Support Level/Target Point (Lower): ~1.12658
200 EMA: ~1.13581 acting as dynamic support
2. Current Price:
EURUSD is trading at 1.14167, just above the 200 EMA and at the bottom edge of the supply zone.
3. Scenarios Outlined:
Bullish Scenario:
If price breaks and holds above the supply zone, it may continue toward the upper resistance level at 1.15729.
This move would be supported by bullish momentum and potentially a breakout strategy.
Bearish Scenario:
If price rejects the supply zone and fails to break above convincingly, a reversal is expected.
The target for this bearish move is the support zone near 1.12658.
4. Indicators:
RSI (Relative Strength Index): Around 49, neutral zone but potentially recovering from oversold.
Suggests indecision, with momentum that could swing either way depending on price action at the supply zone.
Mr SMC Trading point
Trade Ideas:
Long Trade Setup (Breakout):
Entry: Break and retest above ~1.14500.
Target: ~1.15729.
Stop Loss: Below ~1.14100.
Short Trade Setup (Rejection):
Entry: Rejection candle formation around 1.14300–1.14500.
Target: ~1.12658.
Stop Loss: Above ~1.14700.
Overall Idea:
This is a dual-scenario setup, where the market structure at the current supply zone will determine direction. The chart encourages traders to wait for confirmation before committing to either a breakout or a reversal strategy.
Pales support boost 🚀 analysis follow)

EUR/USD Daily Chart Analysis For Week of May 2, 2025Technical Analysis and Outlook:
The Euro currency has shown weakness in this week's trading session and is resting at the Mean Support designation marked at 1.128. The current trajectory indicates that the Euro is targeted to the downside, with a Mean Support level of 1.119 and an Outert Currency Dip of 1.111. However, it is essential to recognize that upward dead-cat rebounds may re-emerge from the Mean Resistance level or Outer currency Dip.

EUR/USD Short term longs to a supplyThis week, I’ll be watching to see how much downside momentum remains after price reacted from my 8H supply zone. Just below the current price action, there’s a clean 3H demand zone I’m expecting price to mitigate — which could spark a bullish reaction or a short-term bounce.
My next supply zones are further above on the 2H and 5H timeframes, so I’ll be waiting to see whether we get another break of structure from this move, which could create a new, tradable supply zone. Ideally, I’ll wait for a Wyckoff schematic to develop at one of these key POIs before committing to a trade.
Confluences for EUR/USD Buys (Short-Term):
- Multiple liquidity points to the upside that price may seek to take out.
- A clean, unmitigated 3H demand zone just below the current level.
- The DXY is still showing weakness, aligning with bullish short-term EU moves.
- This could be a counter-trend opportunity before a larger sell-off resumes.
P.S. While my bias leans more towards selling from higher up, I’ll be open to counter-trend longs if the lower POIs hold. Just remember to keep your risk management tight and only take trades with clear confluence and confirmation.

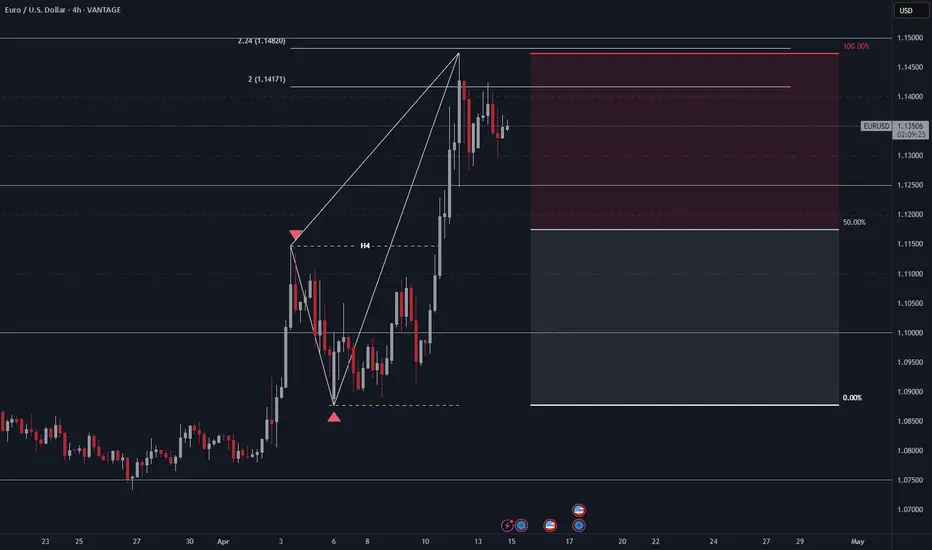
EURUSD: Back to 1.1200Using the Fibonacci extension tool, we could see price hasn't closed and rally above 2.0. Maybe we could get some turn around before continuing bullish on EURUSD.
Euro Slips to $1.13 After Strong AprilThe euro dipped toward $1.13 on May 1 after a 5% April gain, as the dollar found support in Trump’s optimism about trade deals with India, Japan, South Korea, and China. Markets awaited Friday’s U.S. jobs data for Fed policy clues. The U.S. economy shrank 0.3% in Q1, partly due to import spikes ahead of expected tariffs. Meanwhile, the Eurozone grew 0.4%, driven by strong domestic demand. German inflation eased to 2.1%, though core rose slightly, while France’s annual rate held at 0.8%.
Resistance levels are seen at 1.1460, then 1.1580 and 1.1680, while support rests at 1.1260, followed by 1.1200 and 1.1150.