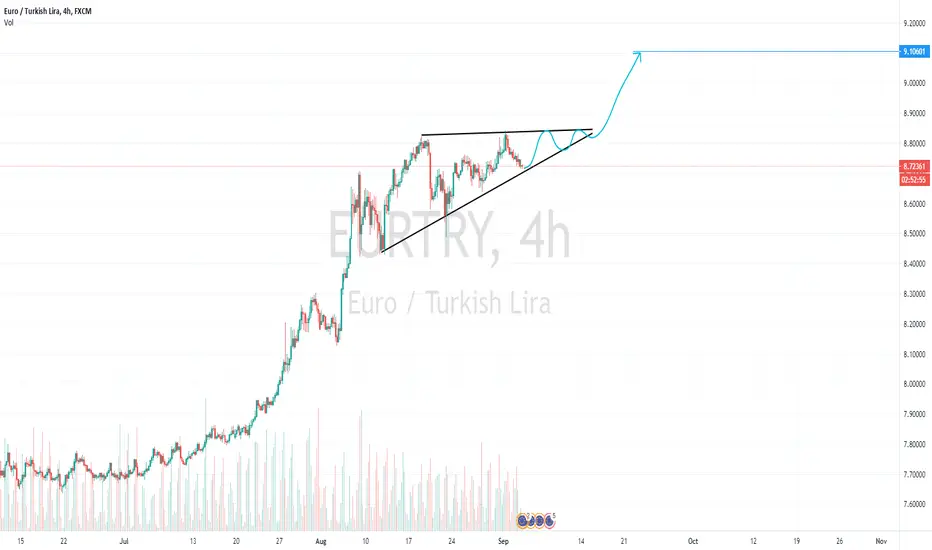
$EURTRY - Ascending triangle, wait for a breakoutHello everyone!
EURTRY will continue the uptrend after breaking out of the triangle.
Wait for a breakout at 8.86300
EUR TRY
The European Central Bank is content with the jumping euroTurkey’s up-and-down relationship with Greece has been causing unwanted tension in the forex market. Even after weeks of conflict between the two countries, it looks like even the announcement that they’re willing to start talks to resolve the issue wouldn’t be enough to ease worries. The EUR/TRY pair’s 50-day moving average will continue its upward trend after its surge against the 200-day moving average in early August, and it looks like the tables won’t turn until the countries come up with a definite agreement. Meanwhile, the European Central Bank is content with the jumping euro because its president Christine Lagarde postponed her decision on interest rate policies to next week. Moreover, its gross domestic product contracted less than the market expected for the second quarter of 2020 compared to the first quarter. July had seen an 11.8 percent decline, less than the 12.1 percent initially estimated. The notion that the eurozone is improving faster than expected is projected to help the falling lira near-term.

Bearish Divergence on EUR TRYThe CBRT responded to the recent lira weakening by tightening the liquidity conditions in a significant way,
although more may need to be done to stabilize the markets. The CBRT first made a press announcement
stating that a) liquidity measures introduced to support growth would be phased out; and b) all available
instruments would be used to reduce market volatility (suggesting rate hikes could be on the agenda). The
Bank then halved the amount of cheap funding (offered at 100bp below the policy rate) to primary dealers.
Finally, the Bank did not open the daily 1-week repo auction (with the 8.25% interest rate), forcing banks to
borrow from the more costly ON lending facility (with interest rate 9.75%). If the remaining 1-week repos are
also not rolled over, then the CBRT’s effective funding rate will increase from 7.50% to 9.75% within a
week. Such measures should help to reduce the demand for FX and should slow down the loan growth,
mitigating worries over price and financial stability. However, it remains to be seen if they will be enough to
restore confidence and to stabilize the markets.

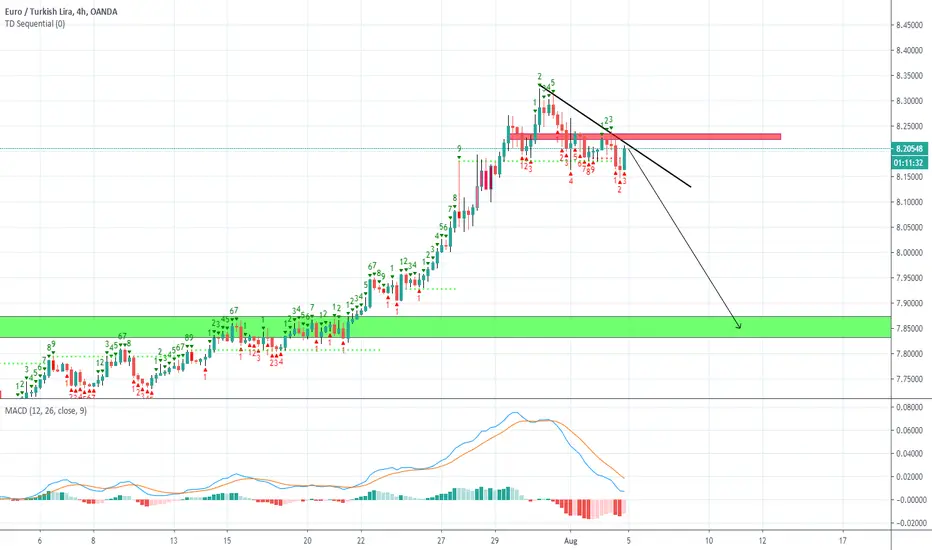
EUR/TRY SHORTLet's do an exotic pair. EUR / TRY goes up too much without any retest, so it should definitely go down to 7.88 area, before the big push up.
Reports for the EU member states’ GDPThe pair failed to break out from a major resistance line, sending the pair lower towards the nearest support line. Most reports for the EU member states’ GDP data will be published today, July 31. Yesterday, the EU’s largest economy already had its GDP results which disappointed investors. Germany’s economy for the second quarter of the fiscal year declined by 10.1%. Expectations for Q2 figures for France, Italy, and Spain’s economic performance were all double-digit declines as well. Spain is expected to suffer the worst decline among the three EU countries who will report today with -16.6%. Meanwhile, France and Italy’s forecast for its second-quarter GDP were -15.3 and -15.0, respectively. Also, the European Union will be posting its bi-monthly report for GDP, and expectations for the figure was at -11.2%. These data will hurt the single currency in the short-term. For the long-term outlook, the European region is expected to recover in Q3 and Q4.
EURTRY Trend AnalysisThe price is on the verge of exceeding its historical price
the pull back is possible because RSI is at the overbought situation.


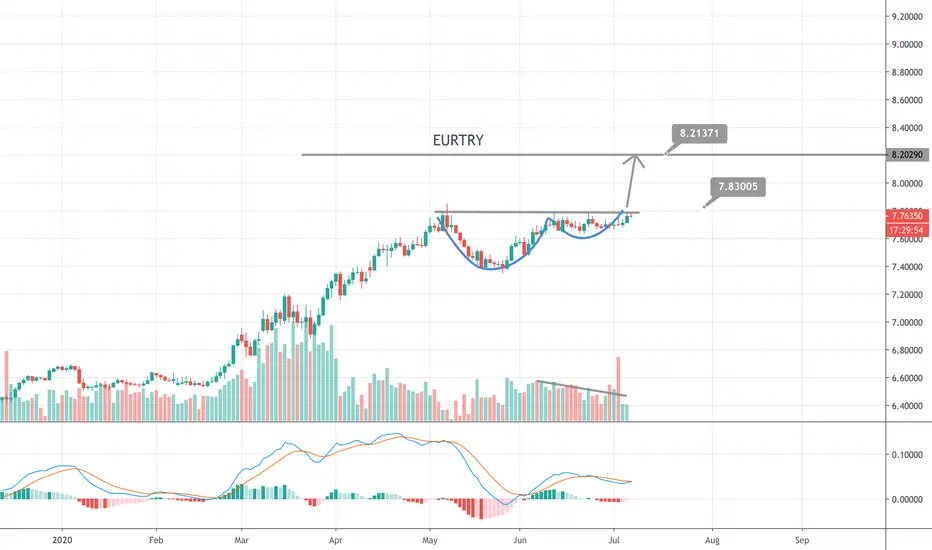
EURTRY PATTERN "CUP AND HANDLE" VERY GOOD EURTRY waiting to complete the " Cup and Handle " model, the price to buy is when it reaches $7,82500
EURTRY buy : $7,82500
EURTRY target : $8.28050
EURTRY stop loss : $7.70000 or $7.75xxxx (for margin) .
Wish you good deals!
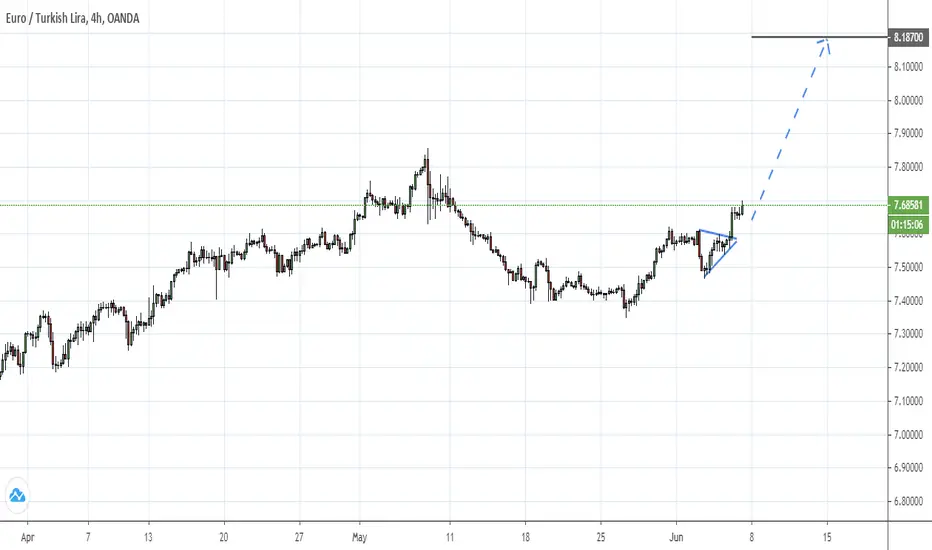
EUR / TRY 7/6/2020Welcome to this analysis on Euro / Turkish Lira.
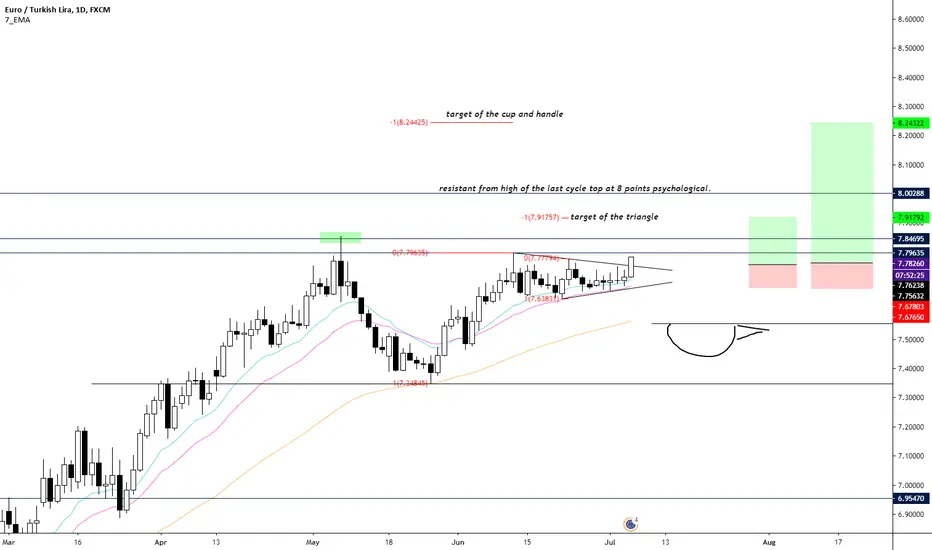
EUR / TRY has been in a massive macro uptrend since 2019, It paused around the highs of the previous uptrend cycle of 2018 at 7.850.
Since the 7th of May, the market has gone sideways, it had a pullback to 7.35, re accumulated there, and bounce back to the previous high.
Looking at the structure, it looks like it has made a Symmetrical triangle pattern which can also be a handle of a Cup And Handle continuation patter if price closes above the previous high at 7.85.
The target of the triangle is at 7.9 and the target of the Cup And Handle is around 8.25.
The 2 levels of resistance above the current price are the previous high at 7.85 which used to be a daily close high of the 2018 cycle as well and above that the psychological 8 level which is also the wick highs of 2018 cycle.
This trade idea has 2 rewards to risk if it hits the triangle's target and 5.5 R if it hits the target of the Cup And Handles.
Good luck trading.
WHY TO GO LONG WITH EURTRYThere is a strong buy signal at 10/10 level, price is above the resistance level and 20 mov exp is supporting the prices. additionally there is cup-handle pattern. The movement range is 0.38.

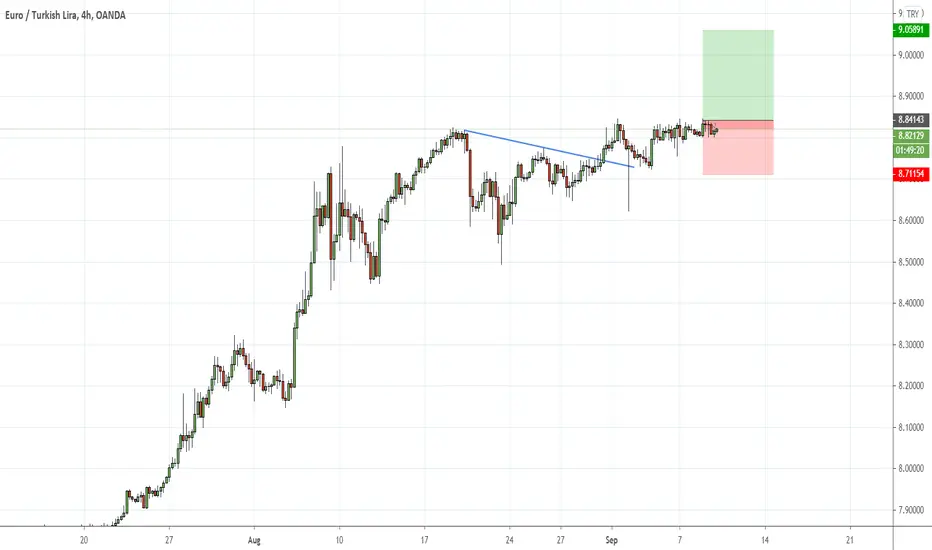
EURTRY waiting for a trigger to sellon DAILY: EURTRY is sitting around a strong supply zone in green so we will be looking for objective sell setups on lower timeframes.
on H1: EURTRY formed a head and shoulders pattern so we are waiting for a momentum candle close below its neckline to sell. (conservative)
Moreover, we are waiting for a new swing to form around our lower red trendline and then enter on its break downward.

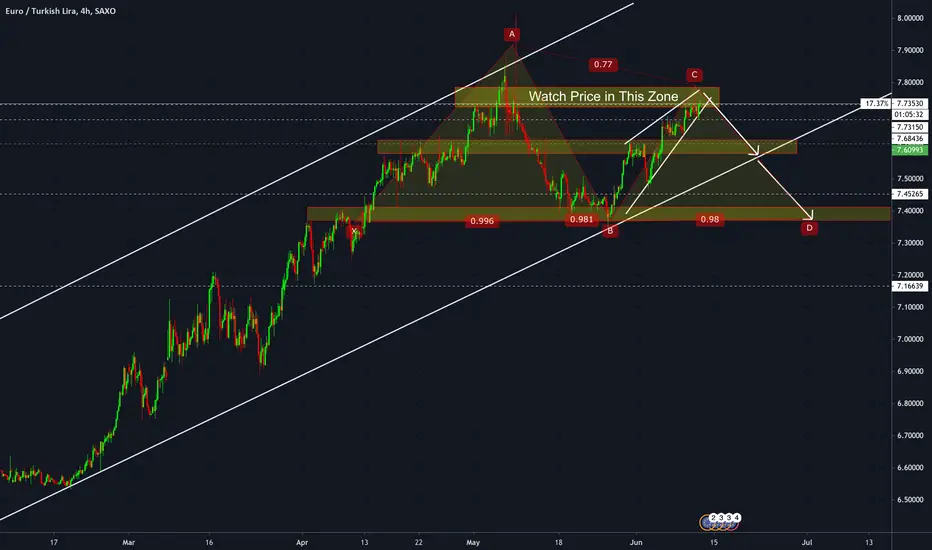
Will the Elliot Triangle Wave Pattern Work for "$CIMSA" Again?What to-look for ?
Follow up the trend and seek for possible position entries.
Set that yellow triangle as your safety stop.
The above references an opinion and is for information purposes only. It is not intended to be investment advice. Seek a duly licensed professional for investment advice.

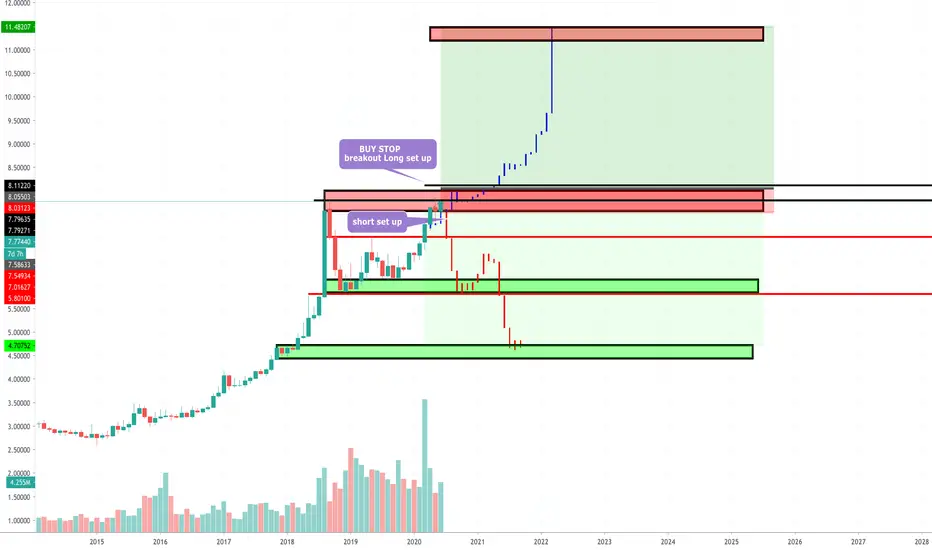
EUR/TRY DOUBLE TOP SHORT SET UP & LONG BREAKOUT SET UP FIRST TIME REVISITING ALL TIME HIGHES
SELL SET UP
SELL EUR/TRY
ORDER TYPE
ENTRY 1 7.7820
ENTRY 2 7.8630
SL 8.987
TAKE PROFIT 1 7.7320
TAKE PROFIT 2 7.2320
TAKE PROFIT 3 6.320
BUY SET UP
BUY EUR/TRY
ORDER TYPE BUY STOP
ENTRY 1 7.8920
ENTRY 2 7.9830
SL 7.865
TAKE PROFIT 1 8.0320
TAKE PROFIT 2 8.4320
TAKE PROFIT 3 8.8220

EURTRY waiting for a trigger to sellon DAILY: EURTRY is still sitting around a strong supply zone and All-Time-High so we will be looking for objective sell setups on lower timeframes.
on H1: EURTRY broke below our red trendline but we didn't sell yet, as we always wait for a momentum candle close below the last swing for extra confirmation.
meanwhile, until the sell is activated, EURTRY would be overall bullish and can still test the upper supply zone before going down.

Did The Stock Market Correction Vanish or Is It About To Happen?Did The Turkish Stock Market Correction Vanish or Is It About To Happen?
The above references an opinion and is for information purposes only. It is not intended to be investment advice. Seek a duly licensed professional for investment advice.


Days To Weekly EURTRY Double TopEurope figures are not good and looks Lira can take advantage for this situation.
Be aware weekend high spread
This fall can take time not a quick trade
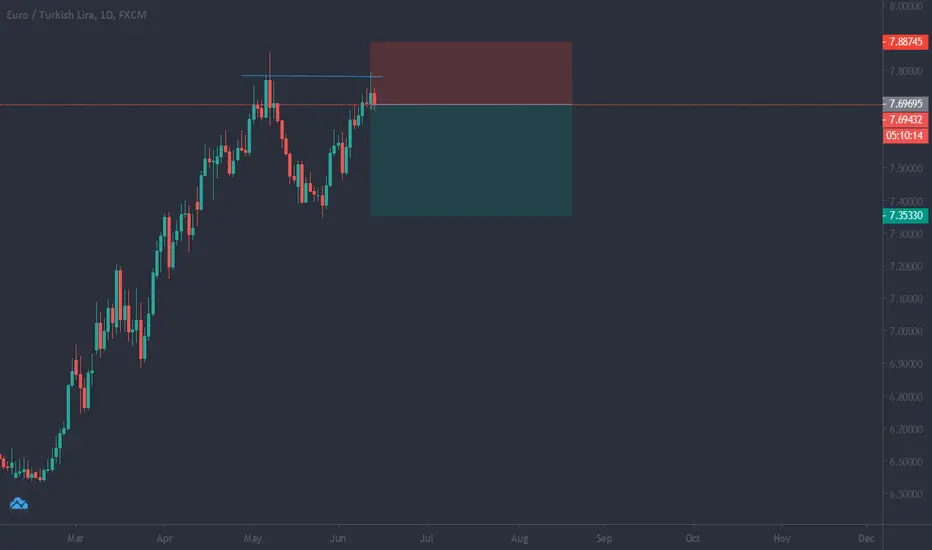

EUR/TRY Set Up for a Possible Nice SellStudy price in zone noted for evidence of rejection. For demonstration and educational purposes. Trade at your own risk.
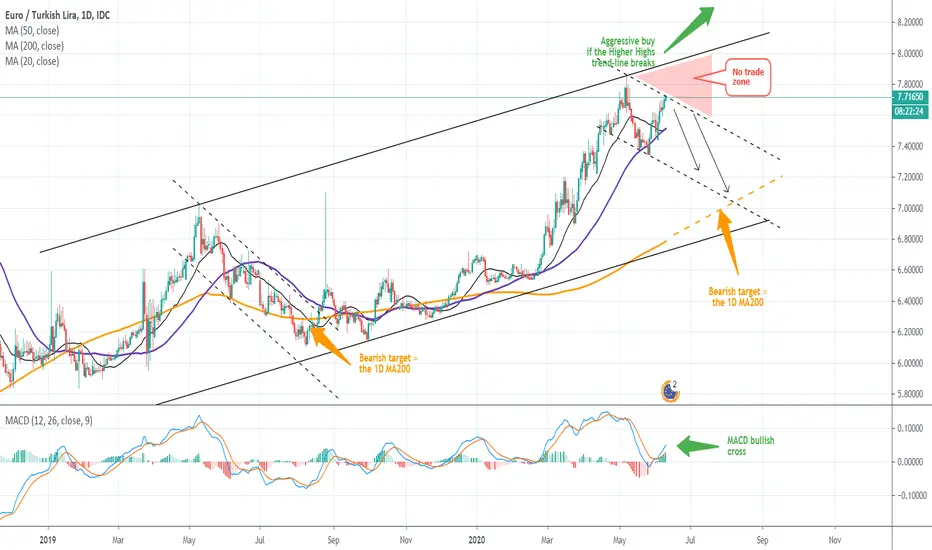
EURTRY Trading PlanPattern: Channel Down on 1D within a long term (1.5 years) Channel Up.
Signal: Bearish as long as the price is trading (even if it breaks and later comes back in) within the Channel Down (dashed lines). No trade within the Red Triangle Zone. Bullish if the Higher High trend-line of the Channel Up breaks.
Target: The 1D MA200.
** Please support this idea with your likes and comments, it is the best way to keep it relevant and support me. **