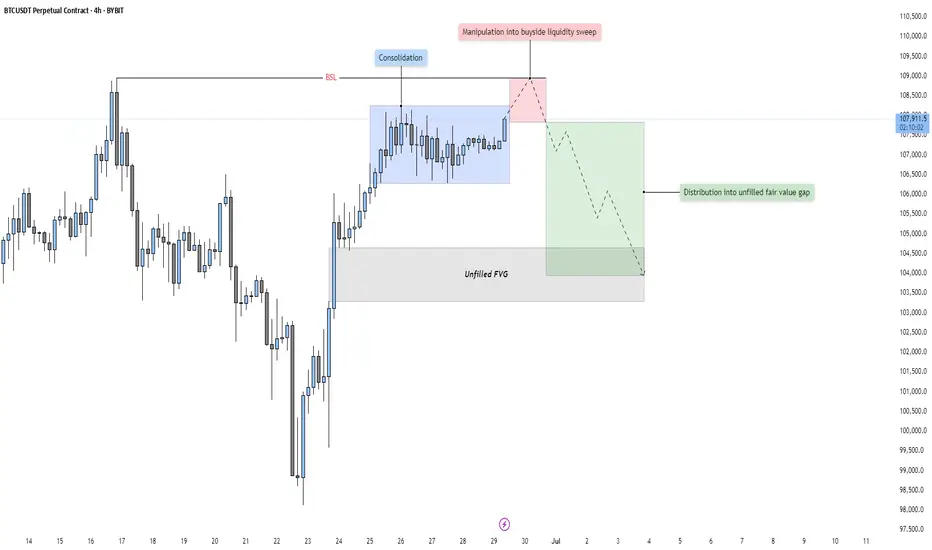
BTC - Consolidation, Manipulation & DistributionMarket Context
The current price action unfolds within the broader structure of a bullish leg that began after a sharp reversal near 97,000. This impulsive rally created a clear Fair Value Gap on the 4-hour chart—left behind as price surged upward with minimal resistance. Following this move, the market entered a consolidation phase, forming a range that has now broken to the upside. This kind of breakout often attracts breakout traders, but in this case, the context signals something more calculated.
Buy Side Liquidity Sweep Following Consolidation
The breakout above the consolidation range led directly into a Buy Side Liquidity Sweep, as price ran the highs just above the marked range. These highs acted as a magnet for liquidity—stop losses from short sellers and buy stops from breakout traders were likely pooled in that area. The quick rejection following this sweep suggests the move was not backed by genuine demand, but rather served the purpose of liquidity collection by larger players.
Manipulation and Distribution
This is a textbook example of manipulation into liquidity. Price was engineered to move upward into a zone of interest, taking out the Buy Side Liquidity before sharply reversing. The strong rejection signals distribution—institutions likely offloaded positions into the influx of late buyers. This kind of pattern often precedes a larger markdown, particularly when followed by lower timeframe bearish structure breaks.
Unfilled Fair Value Gap as a Draw
Beneath the price lies an unfilled Fair Value Gap, a zone of imbalance left behind by the earlier impulsive move. These areas often act as magnets for price, especially once liquidity objectives to the upside have been completed. Now that the sweep has occurred and distribution is underway, there is a strong probability that price will begin to seek rebalancing within this Gap. The area between 104,000 and 103,500 stands out as a high-probability target for the next leg down.
Execution Insight
If you're looking to enter short, it may be wise to wait for confirmation on a lower timeframe—such as a bearish break of structure or an internal Gap forming during the retracement. A 5-minute timeframe can often give early signs of rejection or supply stepping in. Being patient and allowing the market to reveal intent is crucial, especially after liquidity-driven moves like this.
Final Thoughts
Price doesn’t move randomly—it seeks liquidity and fills inefficiencies. This chart beautifully illustrates that logic, from engineered consolidation to a manipulative sweep, and now potentially toward rebalancing.
If you found this breakdown helpful, I’d really appreciate a like—it helps support the work and keeps this kind of content going. Let me know in the comments what you think, or if you’re seeing it differently. I'm always up for a good discussion.
EURUSD-2
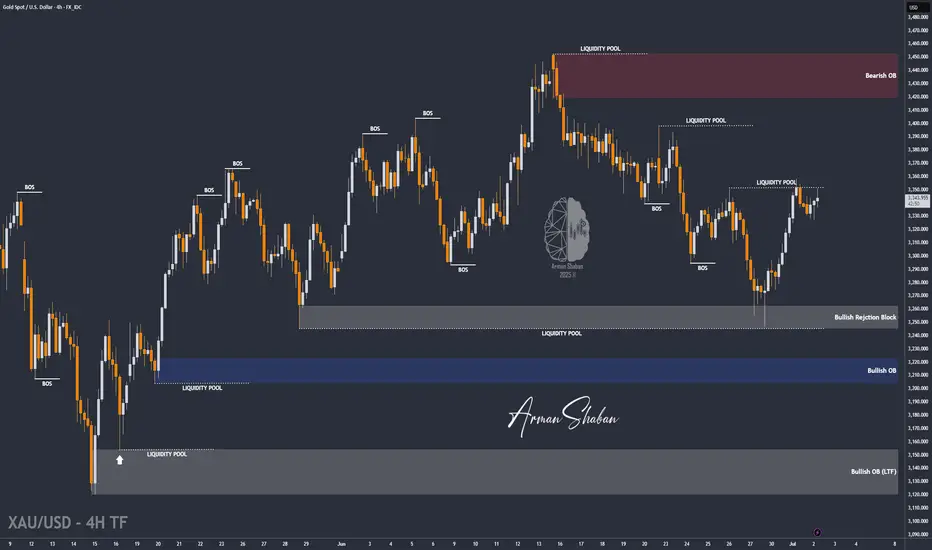
XAUUSD : Bull or Bear ? (READ THE CAPTION)By analyzing the gold chart on the 4-hour timeframe, we can see that the price continued its correction yesterday, dropping to as low as $3327. However, gold rebounded and is currently trading around the $3344 level.
The key condition for further bullish movement is a stable hold above $3338. If this level holds, the next potential upside targets are $3366 and $3399 respectively.
Please support me with your likes and comments to motivate me to share more analysis with you and share your opinion about the possible trend of this chart with me !
Best Regards , Arman Shaban
BTC - Will the Bearish Channel continue?Market Context
After a strong impulsive rally earlier in the year, BTC has been trading within a descending channel on the daily timeframe. This corrective structure suggests a period of consolidation and redistribution, as price oscillates between the channel's boundaries. The repeated rejection from the upper trendline and the inability to break through key highs reinforce the bearish bias in this structure.
Buy Side Liquidity Sweep Potential
Price is currently positioned just beneath a relatively clean swing high, sitting above the mid-range of the channel. This high represents a clear area of Buy Side Liquidity—stop losses from short positions and pending breakout orders from longs are likely clustered there. An engineered sweep of this high would serve as a strategic move for larger participants to collect liquidity before driving price lower.
Fair Value Gap as a Pivot Point
Beneath current price lies a Fair Value Gap—a visible inefficiency formed during a fast upward move earlier in the structure. This Gap remains unfilled and offers a compelling target for price once the Buy Side Liquidity Sweep occurs. It represents a logical zone for price to rebalance before deciding on continuation or reversal. Should price break below the Gap cleanly, it would confirm the bearish intent and potentially accelerate toward the lower bounds of the channel.
Channel Continuation Structure
The overall geometry of the channel remains intact, and the price respecting both upper and lower boundaries strengthens the likelihood of a continuation toward the downside. If the Buy Side Liquidity Sweep and subsequent rejection occur, the market could be poised for another leg lower—possibly seeking the next structural support closer to 90,000 or even toward the lower extremities of the channel around 80,000–82,000.
Final Thoughts
This chart reflects classic price delivery behavior: corrective structure, engineered liquidity sweeps, and the magnetic pull of inefficiencies like Fair Value Gaps. Whether you’re actively trading or simply observing, this is a clean, educational setup to learn from.
If this breakdown helped you see the market a bit clearer, I’d really appreciate a like. And feel free to share your thoughts or counterviews in the comments—your insights make the analysis even more valuable.

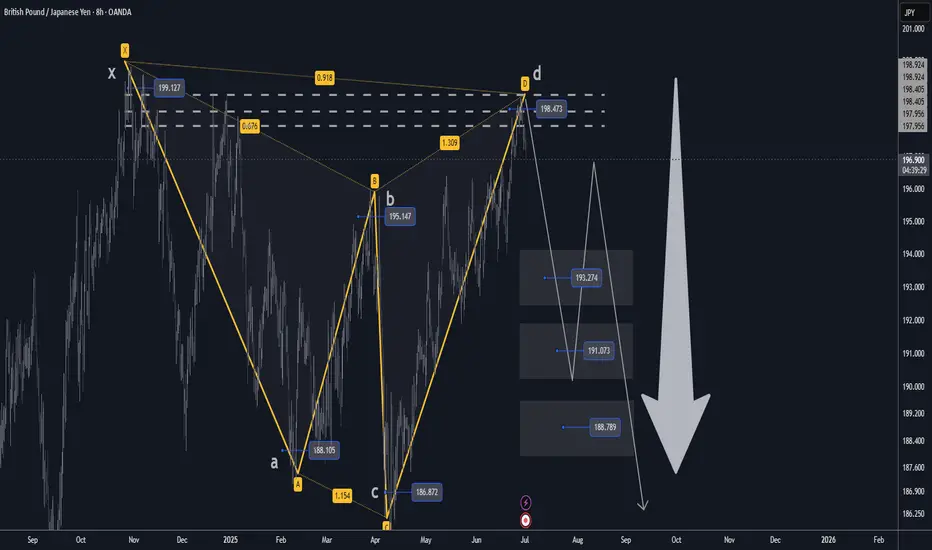
GBPJPY H4 XABCD Short at Market TP Below Market🔸Hello traders, let's review the 4 hour chart for GBPJPY. Strong gains off the lows recently, however price getting overextended and expecting reversal later at/near PRZ/D.
🔸Speculative XABCD structure defined by point X 199 point A 188 point B 195.20 point C 186.80 point D/PRZ 198.40/80 .
🔸Currently most points validated, point D/PRZ validated as well.
Short sell at market SL over point D/PRZ TP details see chart
🔸Recommended strategy for GJ traders: Short Sell at Market
SL over point D/PRZ TP1 193.30 TP2 191.00 TP3 188.80.
🎁Please hit the like button and
🎁Leave a comment to support our team!
RISK DISCLAIMER:
Trading Futures , Forex, CFDs and Stocks involves a risk of loss.
Please consider carefully if such trading is appropriate for you.
Past performance is not indicative of future results.
Always limit your leverage and use tight stop loss.
Gold Bounces from Demand Zone – Next Targets in Sight!By analyzing the gold chart on the 4-hour timeframe, we can see that today, price once again dipped into our key demand zone (Bullish Rejection Block) between $3245 and $3262, where it faced strong buying pressure and rallied up to $3296.
Currently, gold is trading around $3281, and as long as price holds above $3273, we expect further upside. The next potential targets are $3294, $3300, and $3309.
🎥 If you enjoyed this video analysis and found it helpful, please show your support with a LIKE and COMMENT below!
These video-style breakdowns take time and effort, and I’ll only continue them with your support 🙌
Your engagement is my biggest motivation to keep going 💛
Thanks for being part of the journey!

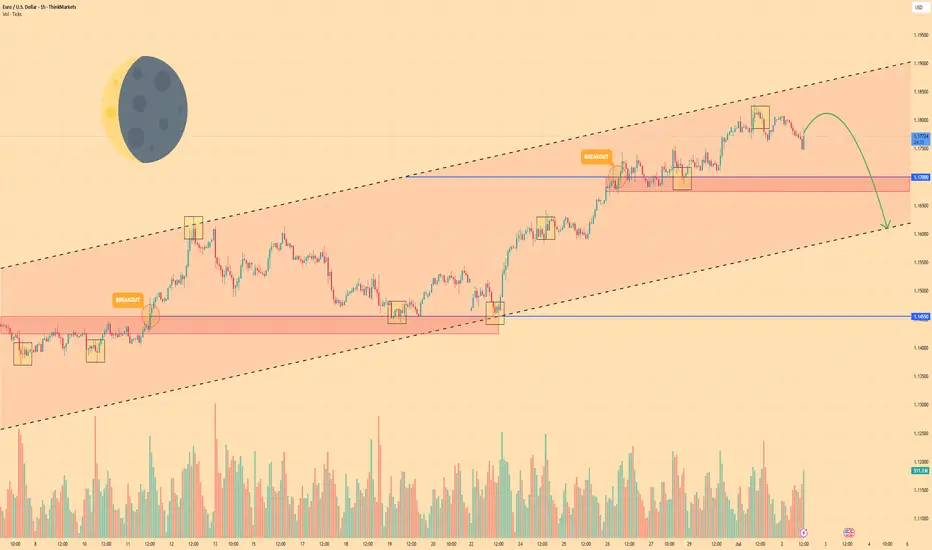
EURO - After movement up, price will drop to support lineHi guys, this is my overview for EURUSD, feel free to check it and write your feedback in comments👊
Recently price started to grow inside a rising channel, where it some time traded below the support area and soon bounced up.
Price broke $1.1455 level and rose to the resistance line of the channel, after which it turned around and made correction movement.
Next, price some time traded near $1.1455 level and then bounced and continued to move up inside the channel.
In a short time Euro rose to $1.1700 level, which coincided with a support area, and some time trades between this level.
Then the price broke this level and continued to move up, until it almost reached the resistance line of the channel and started to fall.
Now, I think the Euro can rise a little and then continue to fall to $1.1610 support line of the channel, breaking $1.1700 level.
If this post is useful to you, you can support me with like/boost and advice in comments❤️
Disclaimer: As part of ThinkMarkets’ Influencer Program, I am sponsored to share and publish their charts in my analysis.
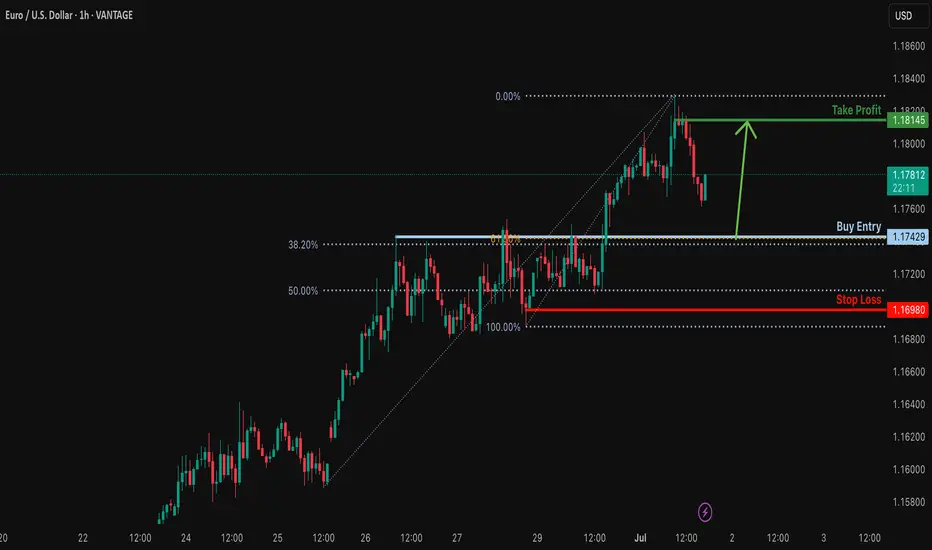
Bullish bounce off pullback support?EUR/USD is falling towards the support level which is a pullback support that aligns with the 38.2% and the 61.8% Fibonacci retracement and could bounce from this level to our take profit.
Entry: 1.1742
Why we like it:
There is a pullback support level that lines up with the 38.2% and the 61.8% Fibonacci retracement.
Stop loss: 1.1698
Why we like it:
There is a pullback support that is slightly below the 50% Fibonacci retracement.
Take profit: 1.1814
Why we like it:
There is a pullback resistance.
Enjoying your TradingView experience? Review us!
Please be advised that the information presented on TradingView is provided to Vantage (‘Vantage Global Limited’, ‘we’) by a third-party provider (‘Everest Fortune Group’). Please be reminded that you are solely responsible for the trading decisions on your account. There is a very high degree of risk involved in trading. Any information and/or content is intended entirely for research, educational and informational purposes only and does not constitute investment or consultation advice or investment strategy. The information is not tailored to the investment needs of any specific person and therefore does not involve a consideration of any of the investment objectives, financial situation or needs of any viewer that may receive it. Kindly also note that past performance is not a reliable indicator of future results. Actual results may differ materially from those anticipated in forward-looking or past performance statements. We assume no liability as to the accuracy or completeness of any of the information and/or content provided herein and the Company cannot be held responsible for any omission, mistake nor for any loss or damage including without limitation to any loss of profit which may arise from reliance on any information supplied by Everest Fortune Group.
EURO - Price can start to decline from resistance line of wedgeHi guys, this is my overview for EURUSD, feel free to check it and write your feedback in comments👊
Some days ago price grew to $1.1500 level and even broke it, after which started to decline in wedge.
Price declined to support line, breaking two levels, after which it turned around and started to move up.
Soon, EUR broke $1.1215 level and then rose more, after which made a correction to support line.
Then price in a short time rose to $1.1500 level, broke it one more time, and tried to grow more, but failed.
But recently it turned around and quickly rose to resistance line of wedge and now trades near.
In my mind, Euro can bounce from resistance line and fall to $1.1520 support line of wedge pattern.
If this post is useful to you, you can support me with like/boost and advice in comments❤️
Disclaimer: As part of ThinkMarkets’ Influencer Program, I am sponsored to share and publish their charts in my analysis.

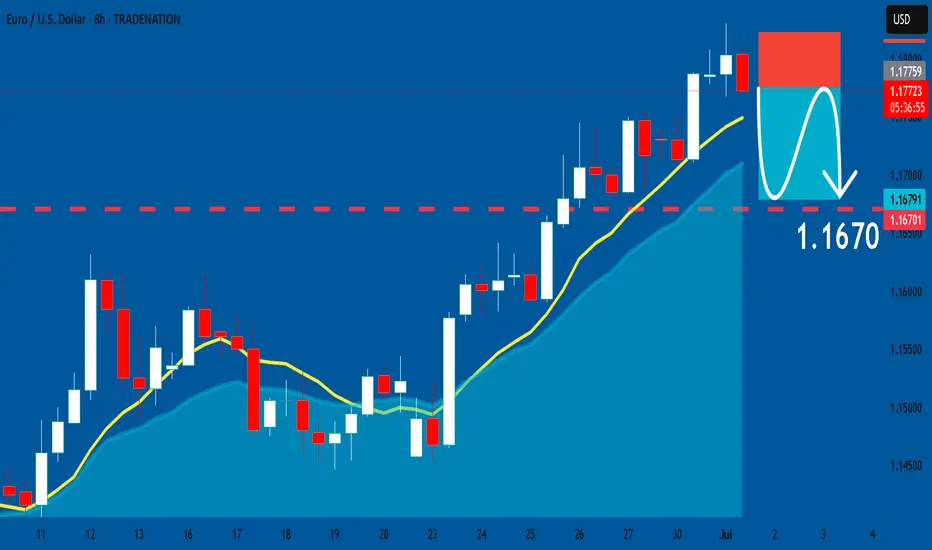
EURUSD: Short Signal Explained
EURUSD
- Classic bearish setup
- Our team expects bearish continuation
SUGGESTED TRADE:
Swing Trade
Short EURUSD
Entry Point - 1.1775
Stop Loss - 1.1822
Take Profit - 1.1670
Our Risk - 1%
Start protection of your profits from lower levels
Disclosure: I am part of Trade Nation's Influencer program and receive a monthly fee for using their TradingView charts in my analysis.
❤️ Please, support our work with like & comment! ❤️
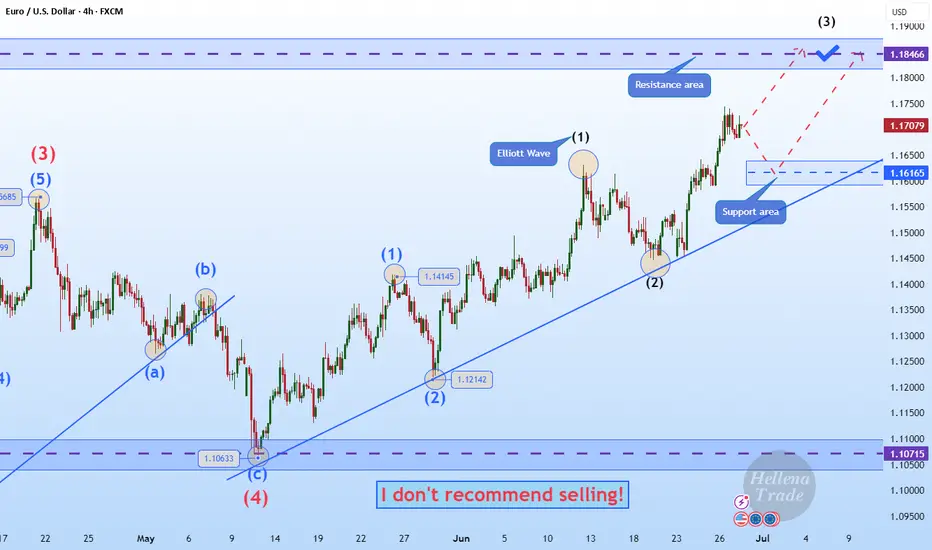
Hellena | EUR/USD (4H): LONG to the resistance area 1.18466.Dear colleagues, I believe that the upward movement continues. The five-wave impulse is not over yet, and I see that the price is now in the upward wave “3” of the higher order and in the upward wave “3” of the lower order.
Therefore, I expect a small correction to the 1.16165 area, after which I expect the price to reach at least the 1.18466 resistance area.
Manage your capital correctly and competently! Only enter trades based on reliable patterns!
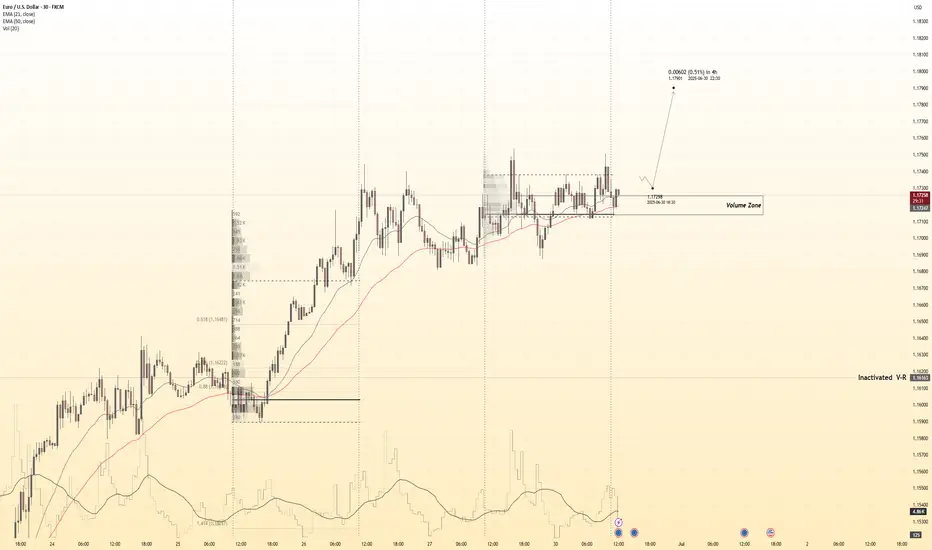
EURUSD 30M Engaged ( Bullish Entry's Detected )————-
➕ Objective: Precision Volume Execution
Time Frame: 30-Minute Warfare
Entry Protocol: Only after volume-verified breakout
🩸 Bullish Wave Coming From : 1.17250
➗ Hanzo Protocol: Volume-Tiered Entry Authority
➕ Zone Activated: Dynamic market pressure detected.
The level isn’t just price — it’s a memory of where they moved size.
Volume is rising beneath the surface — not noise, but preparation.
🔥 Tactical Note:
We wait for the energy signature — when volume betrays intention.
The trap gets set. The weak follow. We execute.
EURUSD 30M Engaged ( Bullish Entry's Detected )
EURUSD 30Min Engaged ( Bullish Entry Detected )➕ Objective: Precision Volume Execution
Time Frame: 30-Minute Warfare
Entry Protocol: Only after volume-verified breakout
🩸 Bullish Wave Coming From : 1.17850
➗ Hanzo Protocol: Volume-Tiered Entry Authority
➕ Zone Activated: Dynamic market pressure detected.
The level isn’t just price — it’s a memory of where they moved size.
Volume is rising beneath the surface — not noise, but preparation.
🔥 Tactical Note:
We wait for the energy signature — when volume betrays intention.
The trap gets set. The weak follow. We execute.
EURUSD 30Min Engaged ( Bullish Entry Detected )

EUR/USD Weekly – Two Long Setups Hello guys!
It is my perspective on eurusd!
Before we even reach the major resistance zone around 1.2050–1.2100, I’ve highlighted two long-term opportunities that may unfold as the price continues to climb.
✔ First Long Position:
It looks like a more conservative entry. The price is already above it. You can set a pending position!
It was likely aiming to catch the momentum as the price broke above the previous structure.
TP is near the descending trendline, around 1.2050–1.2100. a smart place to exit before major resistance hits.
✔ Second Long Position:
Positioned slightly lower. probably in case of a pullback or retest into the broken zone.
This one offers better risk-reward, but requires patience and a cleaner retracement.
Both longs are short-to mid-term swing ideas, aiming to ride the bullish leg into the bigger trendline rejection zone, where I’d personally be more cautious or even look for reversal setups.
EURUSD 30Min Engaged ( Bearish Entry Detected )➕ Objective: Precision Volume Execution
Time Frame: 30-Minute Warfare
Entry Protocol: Only after volume-verified breakout
🩸 Bearish Wave Coming From : 1.17750
➗ Hanzo Protocol: Volume-Tiered Entry Authority
➕ Zone Activated: Dynamic market pressure detected.
The level isn’t just price — it’s a memory of where they moved size.
Volume is rising beneath the surface — not noise, but preparation.
🔥 Tactical Note:
We wait for the energy signature — when volume betrays intention.
The trap gets set. The weak follow. We execute.
EURUSD 30Min Engaged ( Bullish Entry Detected )
Euro will make correction to support line of channelHello traders, I want share with you my opinion about Euro. In this chart, we can see how the price entered to triangle, where it at once bounced from the support line and rose to the 1.1100 support level, which coincided with the buyer zone. Soon, price broke this level, after a small correction, and continued to move up to the 1.1575 current support level, which coincided with the support area. This area also coincided with the resistance line of the triangle, and the Euro rebounded from this line and started to decline. In a short time, it declined to the buyer zone, where it turned around and started to move up. Soon, Euro exited from triangle and continued to rise inside an upward channel, where it made a correction first and then continued to grow. Later, EUR rose to 1.1575 current support level, one more time and even almost broke it, but failed and corrected. But soon, it finally broke this level and rose to the resistance line of the channel, where at the moment it continues to trade near. In my mind, Euro will rebound from this line and go to the correction until to support line of the channel, breaking the support level. For this case, my TP is located near this line - at the 1.1490 points. Please share this idea with your friends and click Boost 🚀
Disclaimer: As part of ThinkMarkets’ Influencer Program, I am sponsored to share and publish their charts in my analysis.
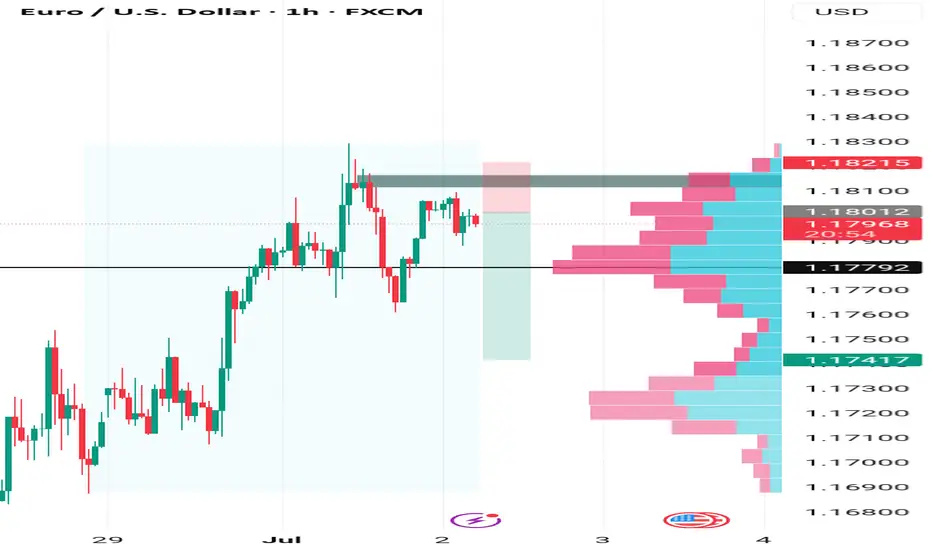
EURUSD SELL TRADEOpportunity to sell on EURUSD
Entry: 1.18000
Stop loss: 1.18200
Take profit 📈 1.17400
Comment your opinion
For fund management. Contact me on X @shajudeakinoba1
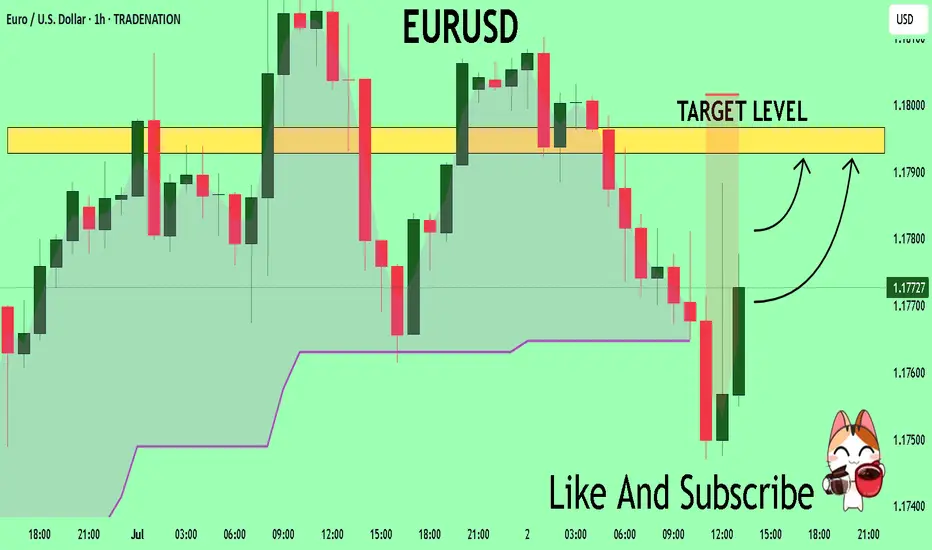
EURUSD Expected Growth! BUY!
My dear followers,
This is my opinion on the EURUSD next move:
The asset is approaching an important pivot point 1.1774
Bias -Bullish
Technical Indicators: Supper Trend generates a clear long signal while Pivot Point HL is currently determining the overall Bullish trend of the market.
Goal - 1.1792
About Used Indicators:
For more efficient signals, super-trend is used in combination with other indicators like Pivot Points.
Disclosure: I am part of Trade Nation's Influencer program and receive a monthly fee for using their TradingView charts in my analysis.
———————————
WISH YOU ALL LUCK
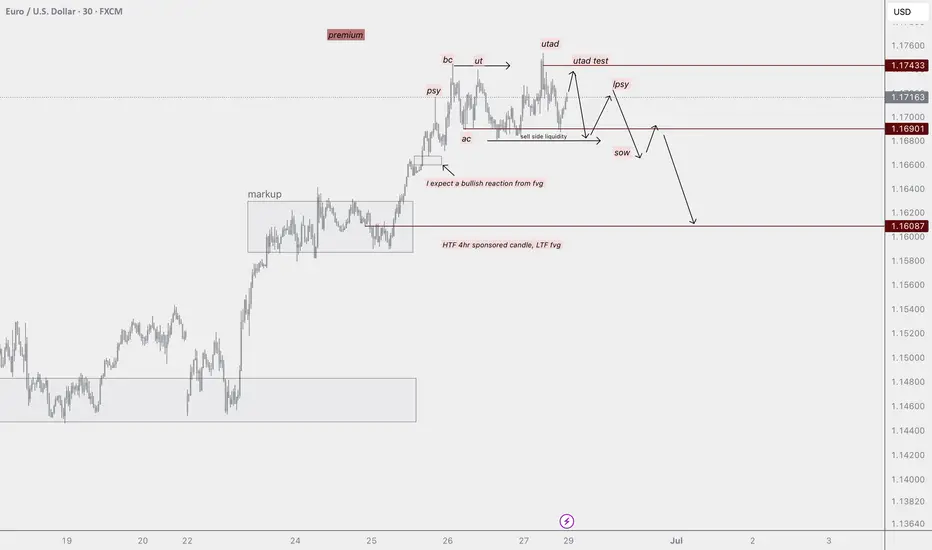
eurusd outlook Eurusd overall bullish HTF, however I do identify alignments within wyckoff distribution. Keeping an eye on the 4hr sponsored candle, ltf fvg at 1.62 area for my next possible bullish swing into the weekly high. Until then let's see if the market can support short term bearish reversal into the area of interest.
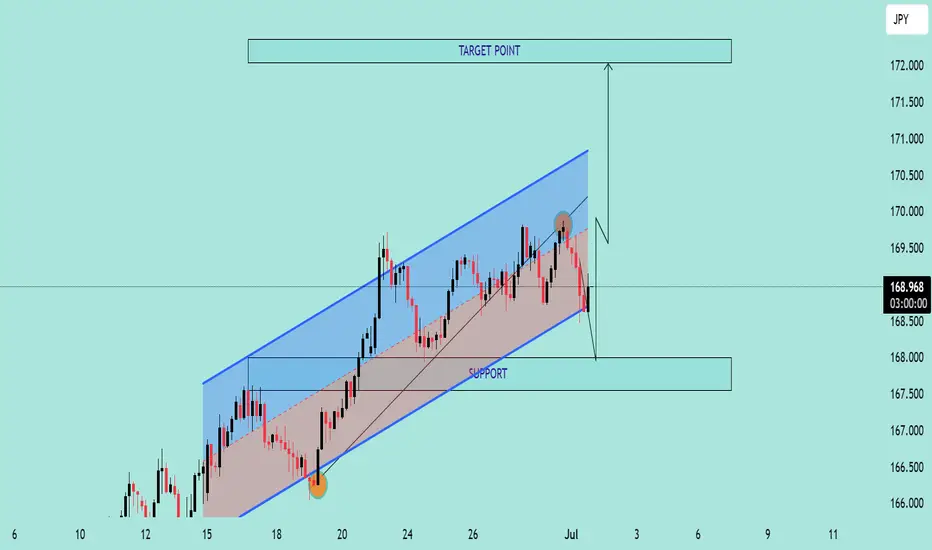
EUR/JPY Potential Bullish ContinuationEUR/JPY Potential Bullish Continuation 📈🔍
📊 Technical Overview:
The EUR/JPY chart presents a bullish channel structure, indicating an overall upward trend. Price action respected the channel boundaries with multiple confirmations before the latest bearish correction.
🔹 Structure Highlights:
🔵 Ascending Channel: Price moved steadily within an upward-sloping channel.
🟠 Support Rebound: A strong bullish candle formed on June 20th after touching the lower boundary — a clear support confirmation.
🔴 Recent Rejection: On July 1st, price tested the upper channel resistance and faced rejection, forming a bearish engulfing candle.
🟫 Support Zone Marked: Around the 167.800 level, this zone has been tested multiple times, indicating a possible demand area.
🔁 Current Scenario:
The pair has broken down from the internal trendline (light brown line) and is heading toward the support zone. A bullish bounce from this area may lead to a rally toward the Target Point at ~172.000 🎯.
📌 Key Levels:
Support Zone: 167.600 – 168.000
Resistance Zone: 170.500 – 172.000
Current Price: 168.994
📈 Outlook:
If support holds and bullish momentum returns, there's potential for a move toward the target area at the top of the channel. However, a break below the support zone could invalidate the bullish scenario and suggest a deeper correction.
🧠 Conclusion:
Wait for bullish confirmation near support before considering long positions. A clean break and retest of the support zone could signal a continuation of the upward trend.
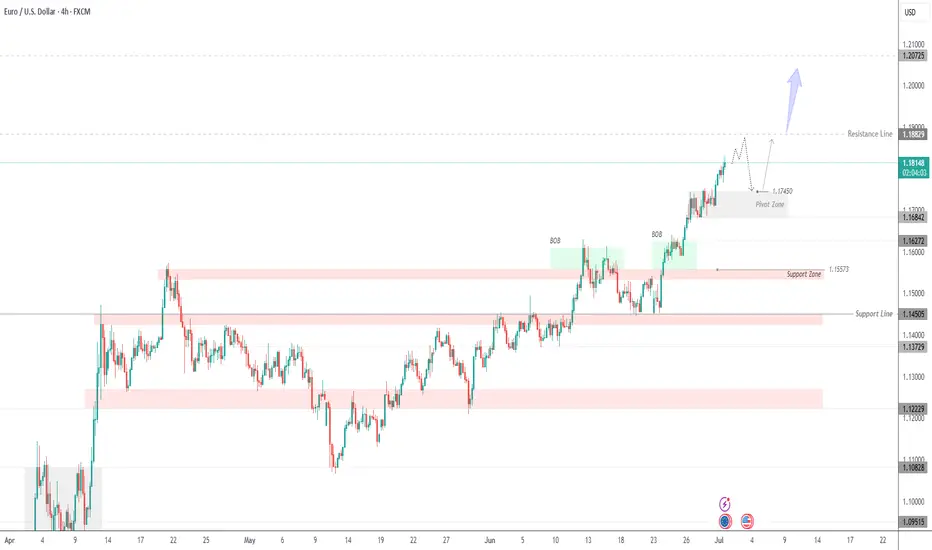
Euro Continues Bullish Trend | Eyes on 1.1882 & 1.2075EUR/USD – Strong Bullish Structure | Watching 1.1745 Pivot Zone for Reentry
The Euro continues to trade in a well-defined bullish trend, supported by institutional demand and clear price structure.
After breaking above the 1.1684 resistance zone, EUR/USD extended toward 1.1818 and now approaches the next resistance at 1.1882. This level may act as a temporary cap, but if breached with momentum, the pair could target the 1.2075 zone next.
Bullish Order Blocks (BOBs) marked on the chart highlight previous accumulation zones where buyers stepped in aggressively. These areas are still valid for demand-based pullbacks.
Key Area to Watch – 1.1745 Pivot Zone:
This level serves as a potential reentry point if the price retraces. As long as EUR/USD holds above this zone, bullish momentum remains intact. A confirmed bounce here could resume the uptrend toward 1.1882 and beyond.
However, a clean break below 1.1745 could open the door for a deeper correction toward 1.1627 or even 1.1557, which is the next major support zone.
Key Levels:
Resistance: 1.1882, 1.2075
Pivot Zone: 1.1745
Support: 1.1627, 1.1557
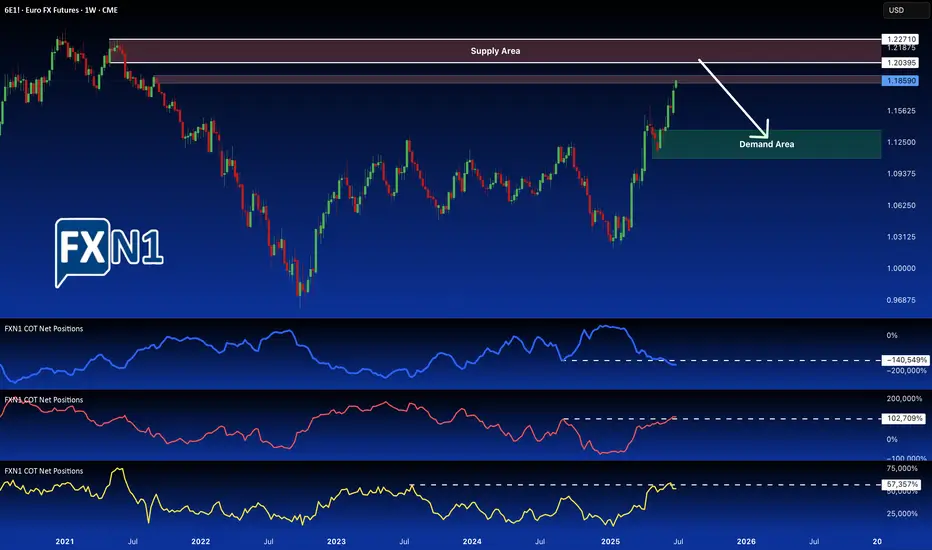
EUR/USD (6E1!) Nears Critical Monthly Supply ZoneThe EUR/USD futures (6E1!) are currently trading at 1.1858, already inside a key monthly supply zone. With price action approaching higher resistance levels, traders should prepare for potential reversals—especially near the 1.20395 – 1.22710 range, where a major bearish reaction could unfold.
Key Technical Levels to Watch
Current Price: 1.1858, testing the lower bounds of a monthly supply zone.
Weekly Supply Areas: Highlighted on the chart, signaling potential selling pressure ahead.
Primary Target Zone for Shorts: 1.21240 – 1.22710 (within the broader 1.20395 – 1.22710 range).
Breakout Scenario: A sustained move above 1.22710 could invalidate the bearish structure, targeting 1.2400+.
COT Report Reveals Market Sentiment Shifts
The latest Commitment of Traders (COT) report shows:
Commercials (Smart Money): Accumulating bearish positions, suggesting institutional hedging at these levels.
Non-Commercials (Large Speculators): Still bullish but stagnant—no major additions or reductions in exposure.
Retail Traders: Remain bullish, often a contrarian signal when Commercials are increasing shorts.
This setup suggests that while momentum is still upward, the lack of new buying from Non-Commercials and Commercials increasing shorts could lead to a reversal.
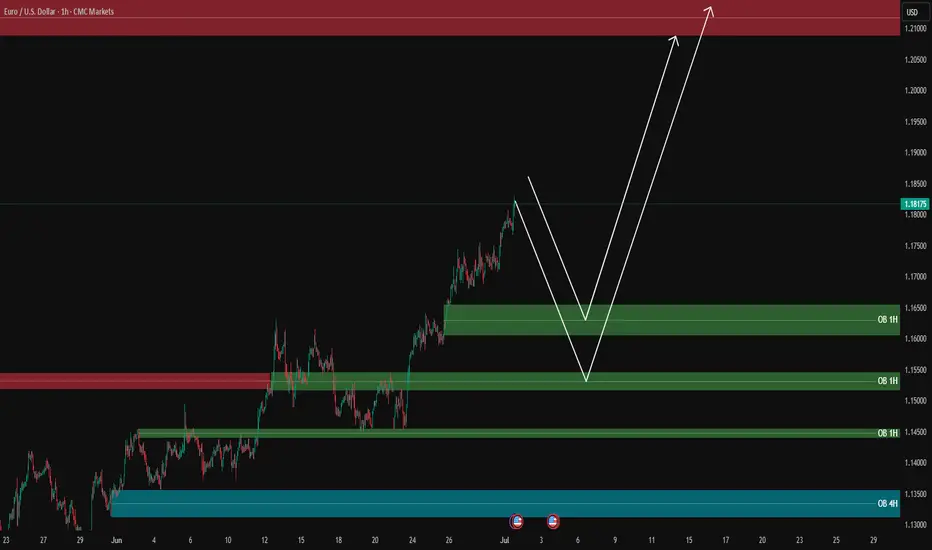
EURUSD analysis - 1H FVG and OB SetupsEUR/USD is in a strong bullish move right now.
We are waiting patiently for the price to reach our marked green (OB) and blue (FVG) zones before looking for clean buy opportunities. Always remember to let price tap into our key areas so we can enter on lower timeframes for precise, low-risk entries.
The first resistance ahead is around 1.2100, which will be our immediate target if the bullish momentum continues.
Stay patient, let the price come to your zones, and execute with discipline.
—
📊 ProfitaminFX | Gold, BTC & EUR/USD
📚 Daily setups & educational trades
📱 IG: @profitamin.f
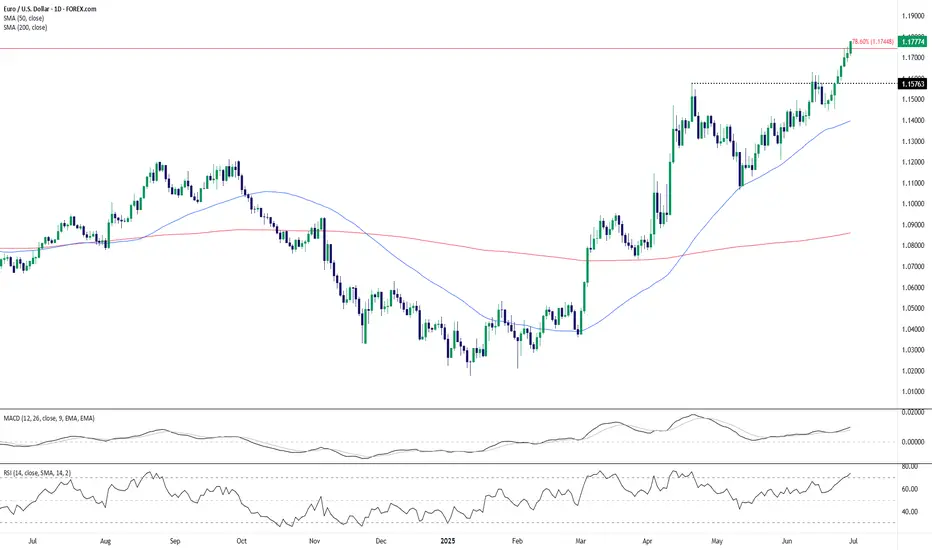
EUR/USD Breakout Eyes 1.18 as Bullish Momentum BuildsEUR/USD has punched through the 78.6% Fibonacci retracement level (1.1744) of the July 2023–October 2023 decline, signaling strong bullish continuation. The breakout above the recent swing high near 1.1576 confirms the uptrend is gaining traction, supported by rising moving averages.
The 50-day SMA has crossed well above the 200-day SMA, maintaining a strong golden cross structure, reinforcing the bullish bias. Momentum indicators support the advance, with the RSI entering overbought territory at 73.79, and the MACD maintaining a positive spread above the signal line — a classic sign of trend strength rather than imminent reversal.
However, the overbought RSI suggests the pair could face some short-term consolidation or a shallow pullback before targeting the psychological 1.18 handle. Bulls would likely view any dip toward the breakout level (1.1576) as a potential buying opportunity.
As long as EUR/USD holds above that support, the path of least resistance remains to the upside, potentially paving the way for a full retracement toward the 1.19–1.20 zone seen last year.
-MW