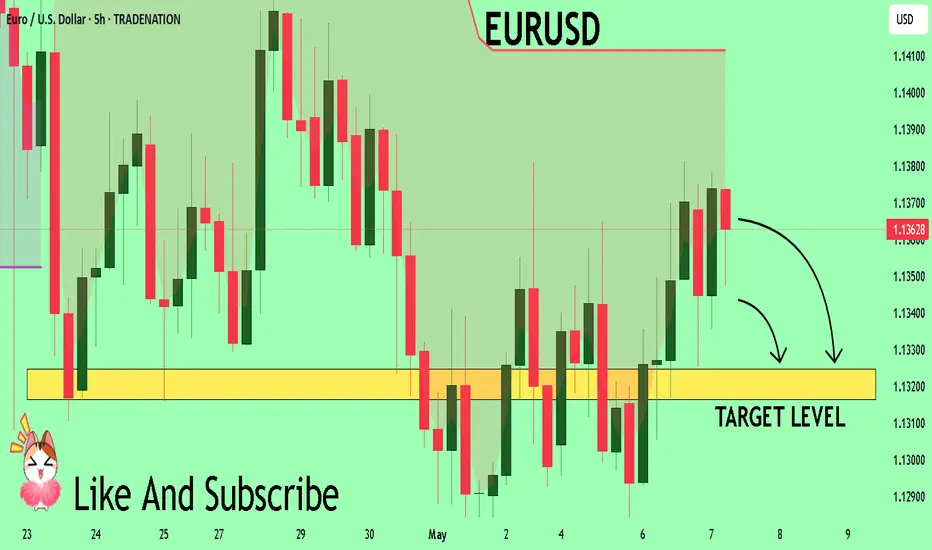
EURUSD - Other face of medal - short reboundEURUSD - Other face of medal - short rebound
If the price don't break the resistence area to 1.1380 .. so we can have a rebound until support zone with a completation of H&S pattern - ABC
EURUSD-2
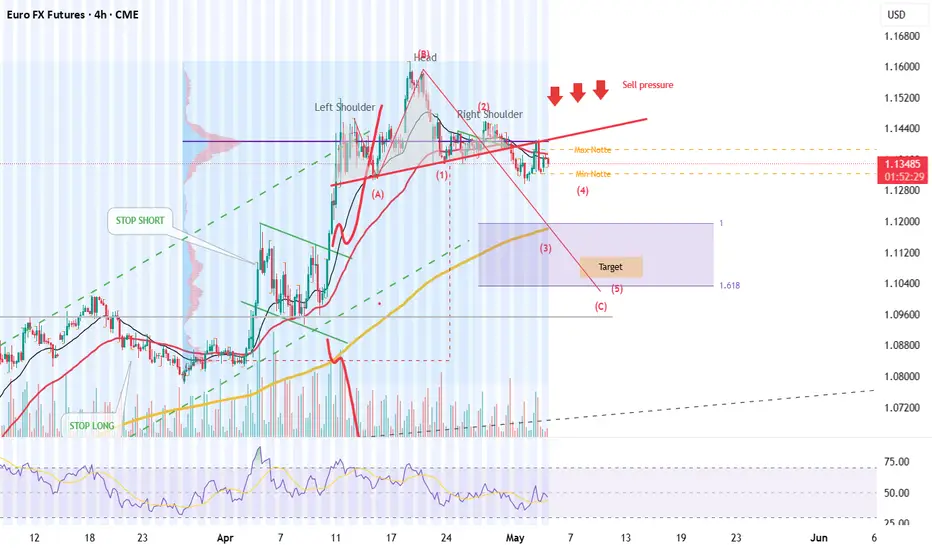
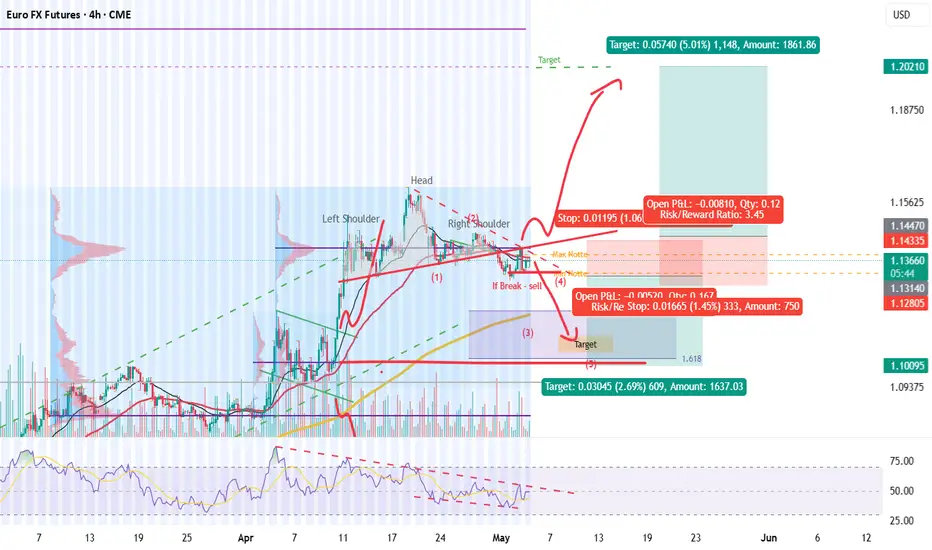
EURUSD - double scenario So I develop a strategy on 6E1! that I post to you. I identified a H&S that seems to have broken the neck with a bearish retest in the area of 1.14. Theoretically the daily left shoulder volumes are "decreasing" confirming a potential bearish H&S structure, furthermore we are under the POC bullish leg that was touched with the retest, the short scenario should be confirmed with the break of the micro support (under the retest candle) going to confirm a hypothesis of an ABC retracement of Elliott after an impulse with a target around 1.10, the POC area of the previous accumulation phase. The long scenario instead is more attributable to a triangle pattern with volume compression, any overcoming of the POC and the first resistance area around 1.14 with the break of the descending line should confirm this scenario with a potential target in the upper POC area around 1.20... Thank you in advance for any contribution to this analysis.
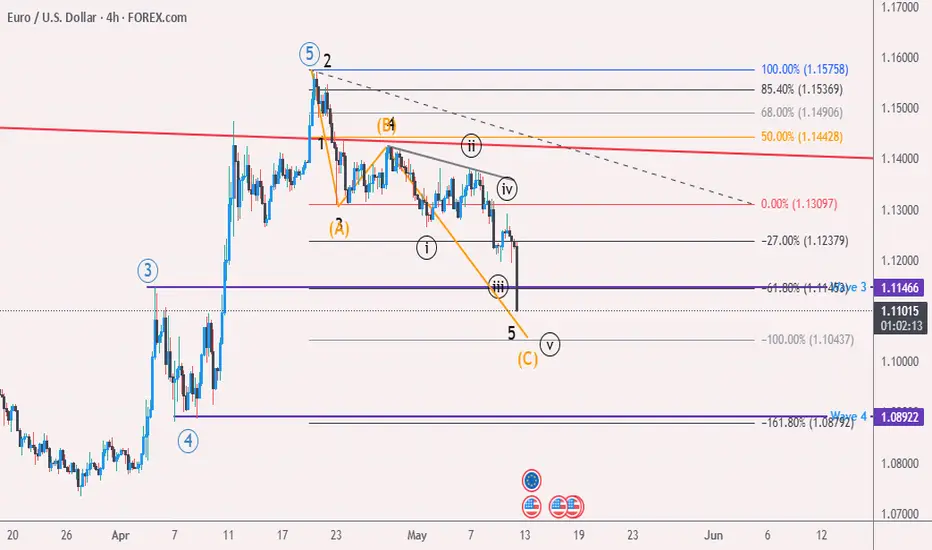
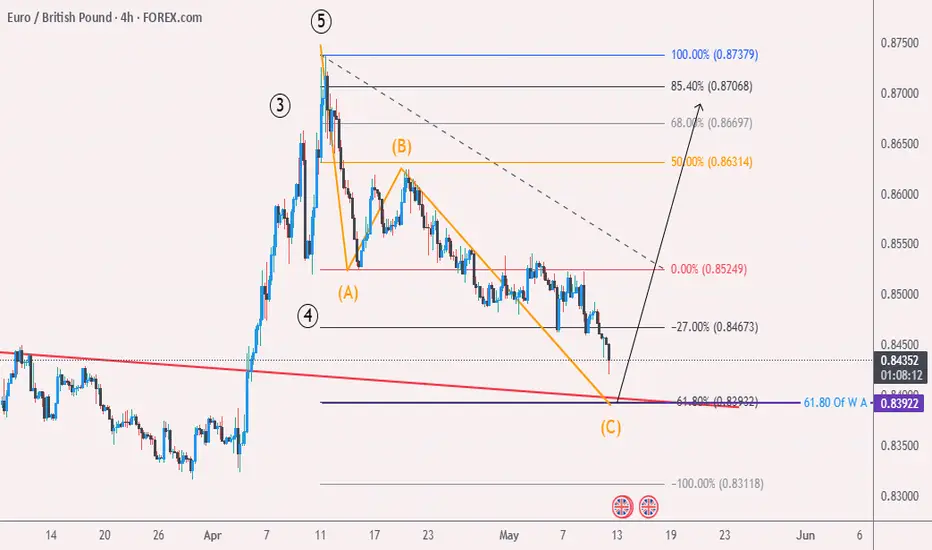
Eur/Gbp May/12 elliott Wave Hello eveyone...
i was wrong last time..
so 5th wave compelted and we are in C wave so i'm looking for buy in the end of c wave...
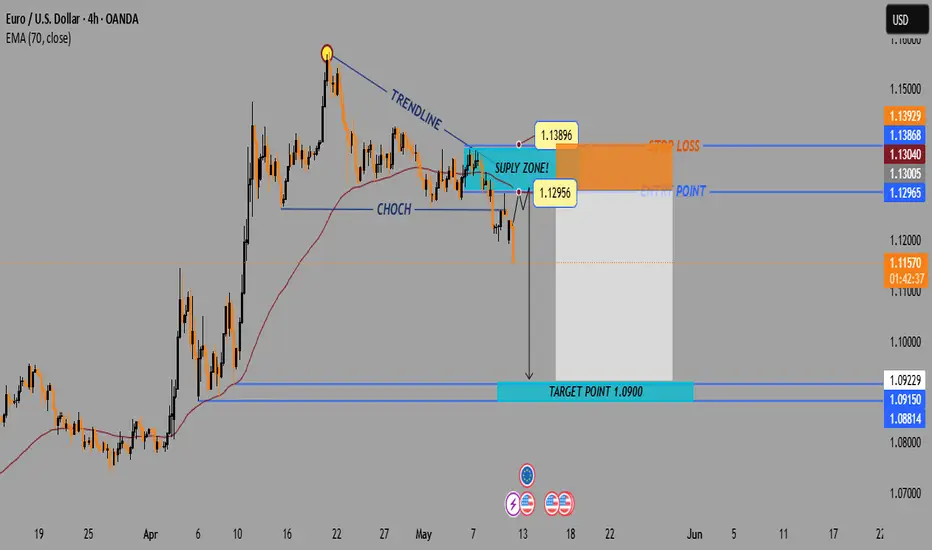
EUR/USD Bearish Setup: Supply Zone Rejection Toward1.0900 Target(Swing Trade Setup)
📉 Trendline + CHoCH Confirmation
🔻 Downtrend marked by a falling blue trendline.
🔄 CHoCH (Change of Character) shows a bearish market structure shift, confirmed by a lower low.
🟦 Supply Zone (Sell Zone)
💥 Strong seller reaction previously occurred between:
1.12956 – 1.13896
🔹 Wait for price to retrace into this zone.
🎯 Ideal for short entries.
🎯 Entry & Stop-Loss
🔵 Entry Point: Around 1.12956 – 1.13005
(below supply zone and EMA)
🛑 Stop Loss: 1.13896 – 1.13929
(above the last high + supply zone)
🟦 EMA 70 (Purple Line)
📈 Currently at 1.13051
Acts as dynamic resistance — strengthening the short setup.
🏁 Target Zone
🎯 Main Target: 1.09000
Marked as TARGET POINT 1.0900
🟦 Support Levels Inside Target Zone:
1.09229
1.09150
1.08814
✅ Summary of Trade Idea
📍 Short Position
⬆️ Entry: ~1.13000
🛑 Stop Loss: ~1.13900
⬇️ Take Profit: ~1.09000
⚖️ Risk-to-Reward: ~1:3+ potential
Fundamental Market Analysis for May 12, 2025 EURUSDEUR/USD is retreating from the gains made in the previous session, trading near 1.12400 in Monday's Asian session. The Euro (EUR) has been under pressure since European Central Bank (ECB) official Olli Rehn said last week that the ECB may consider cutting interest rates at its next meeting, provided that upcoming forecasts confirm a continued trend of disinflation and slowing economic growth.
Despite this, EUR/USD found some support thanks to optimism surrounding the trade talks between the US and China that took place in Geneva. Both sides reported “substantial progress” after two days of talks aimed at de-escalating the ongoing trade dispute. Chinese Vice Premier He Lifeng called the talks an “important first step” in stabilizing bilateral relations, while U.S. Treasury Secretary Scott Bessent echoed his sentiment, noting significant progress.
Markets are now awaiting Washington's response to the European Commission's proposed countermeasures against U.S. tariffs. On Thursday, the Commission launched a public consultation that outlined potential tariffs on up to 95 billion euros worth of imports from the U.S. if trade talks break down.
Meanwhile, the U.S. economic outlook remains uncertain. Federal Reserve (Fed) officials have noted the risk of stagflation, and Fed Chairman Michael Barr has warned that higher tariffs could disrupt supply chains, leading to higher inflation, lower growth and higher unemployment. Investors remain cautious as further escalation of trade tensions could pose serious problems for the US economy.
Trading recommendation: BUY 1.12300, SL 1.11900, TP 1.13000

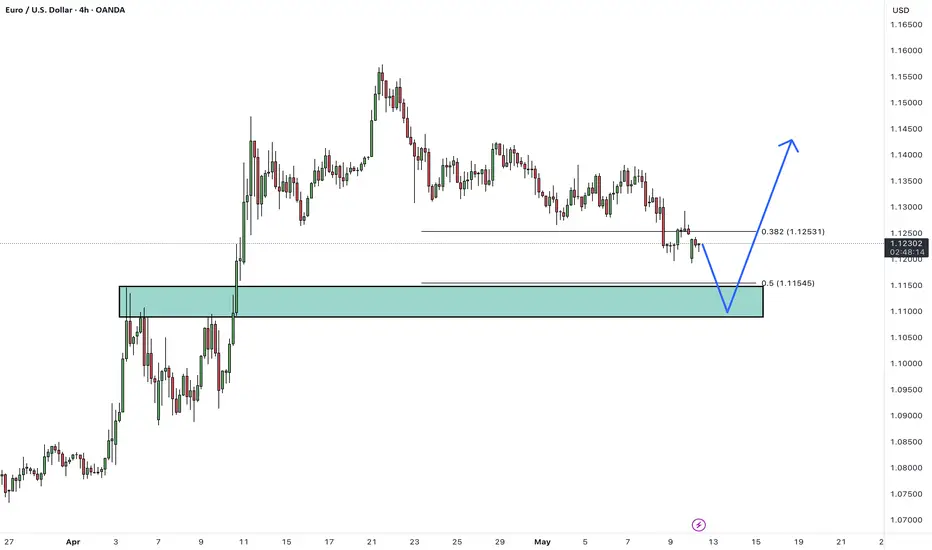
EURUSDHello Traders! 👋
What are your thoughts on EURUSD?
On the 4-hour chart, EUR/USD is forming a downward corrective structure following a strong bullish move.
Price is approaching a support area, which aligns with a 0.5 Fibonacci retracement level
We anticipate the correction to complete near this confluence zone, followed by a resumption of the bullish trend toward higher targets.
Will this support hold and trigger the next bullish leg? Share your thoughts below!
Don’t forget to like and share your thoughts in the comments! ❤️
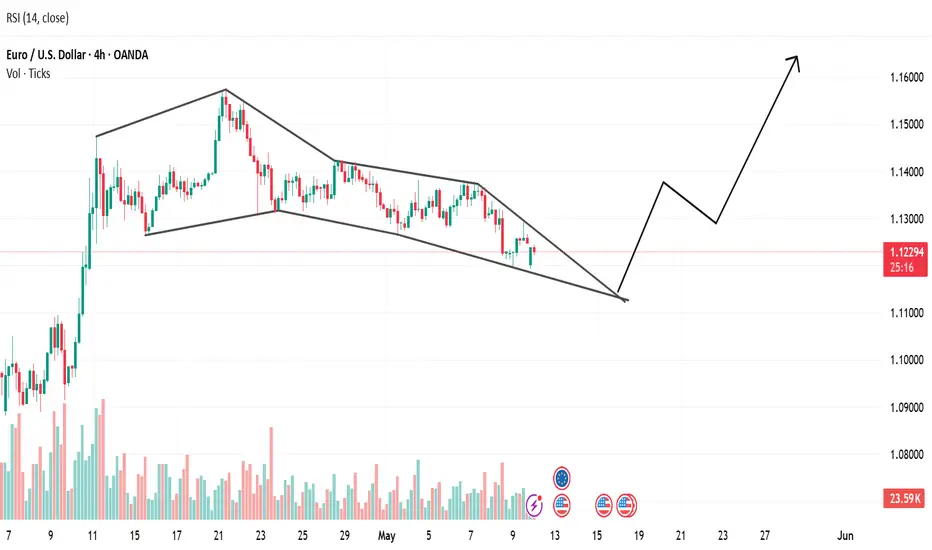
EURUSD TechnicalsFalling wedge pattern on the EUR/USD 4-hour timeframe.
# Typically a bullish reversal or continuation pattern.
# Both support and resistance lines are sloping downward and converging.
# Often declines during the formation, which aligns with what’s visible here.
📈 Implications:
Bullish Bias: A breakout above the upper resistance trendline usually signals a reversal to the upside.
Confirmation: Wait for a breakout with volume to confirm the pattern. False breakouts can happen.
Target: The initial target after a breakout is often the height of the wedge projected upward from the breakout point.
RSI: Currently near oversold levels (~36), suggesting potential upward momentum.
✅ What to Watch For:
Breakout above the upper trendline with a bullish candle and increased volume.
A retest of the broken trendline (now support) for a more conservative entry.
Bullish bounce off 50% Fibonacci support?The Fiber (EUR/USD) is falling towards the pivot and could bounce from this level to our take profit.
Pivot: 1.1145
1st Support: 1.0938
1st Resistance: 1.1523
Risk Warning:
Trading Forex and CFDs carries a high level of risk to your capital and you should only trade with money you can afford to lose. Trading Forex and CFDs may not be suitable for all investors, so please ensure that you fully understand the risks involved and seek independent advice if necessary.
Disclaimer:
The above opinions given constitute general market commentary, and do not constitute the opinion or advice of IC Markets or any form of personal or investment advice.
Any opinions, news, research, analyses, prices, other information, or links to third-party sites contained on this website are provided on an "as-is" basis, are intended only to be informative, is not an advice nor a recommendation, nor research, or a record of our trading prices, or an offer of, or solicitation for a transaction in any financial instrument and thus should not be treated as such. The information provided does not involve any specific investment objectives, financial situation and needs of any specific person who may receive it. Please be aware, that past performance is not a reliable indicator of future performance and/or results. Past Performance or Forward-looking scenarios based upon the reasonable beliefs of the third-party provider are not a guarantee of future performance. Actual results may differ materially from those anticipated in forward-looking or past performance statements. IC Markets makes no representation or warranty and assumes no liability as to the accuracy or completeness of the information provided, nor any loss arising from any investment based on a recommendation, forecast or any information supplied by any third-party.

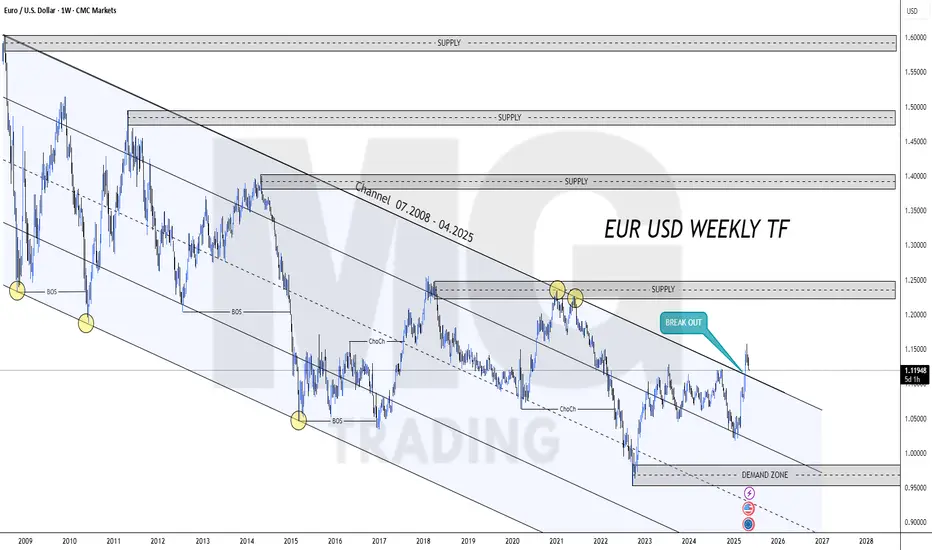
EUR USDHello Traders. I want to share my weekly analysis for EURUSD with you. We have a channel from July 2008 to April 2025. Currently, it has made a breakout and I hope it will continue the bullish scenario.
I am not a professional trader and I would be happy if you share your views regarding EURUSD.
Week of 5/11/25: EURUSD AnalysisEU has clean structure with Daily, 4h, and 1h bearish.
1h internal structure is bullish at the moment and we're waiting for that to break bearish before looking for any shorts.
We're going to be patient and wait for internal before looking for high probability trades.
Major news:
China trade talks - Monday
CPI - Tuesday
PPI/Unemployment - Thursday

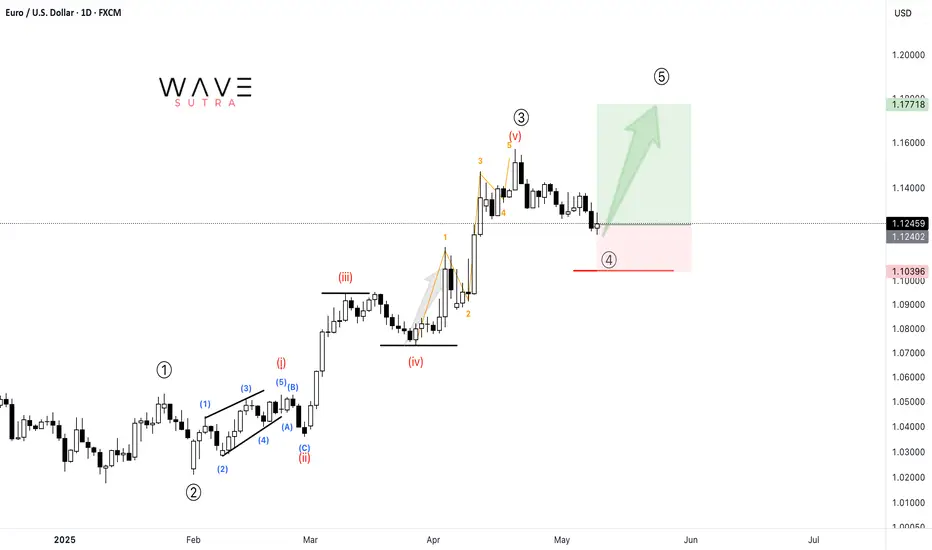
EURUSD: 5th Wave pendingThe pair is rising impulsively and currently about to conclude it's 4th wave (Circle) and break the previous high under wave-5 circle. The confirmation for the same will come above 1.36.
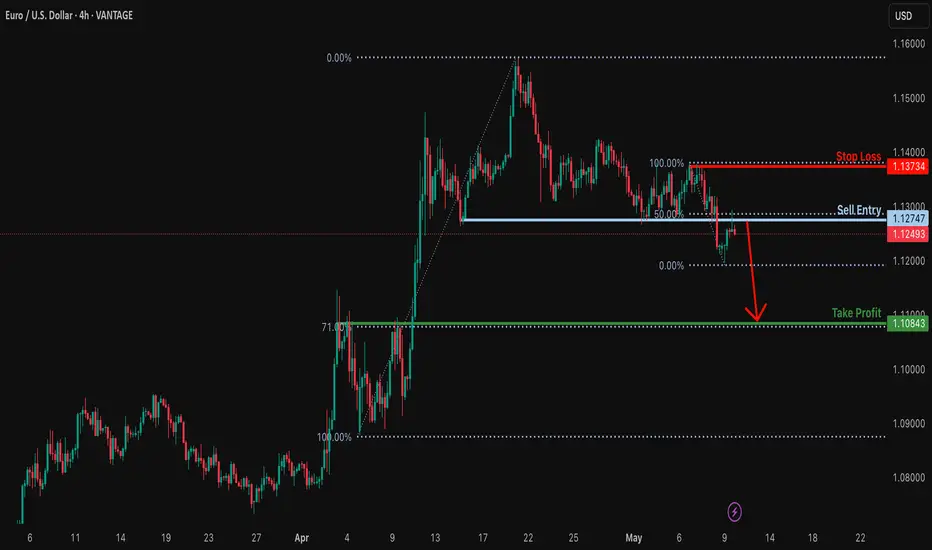
Potential bearish drop?EUR/USD is reacting off the resistance level which is a pullback resistance that lines up with the 50% Fibonacci retracement and could drop from this level to our take profit.
Entry: 1.1274
Why we like it:
There is a pullback resistance level that aligns with the 50% Fibonacci retracement.
Stop loss: 1.1373
Why we like it:
There is a pullback resistance level.
Take profit: 1.1084
Why we like it:
There is a pullback support level that lines up with the 71% Fibonacci retracement.
Enjoying your TradingView experience? Review us!
Please be advised that the information presented on TradingView is provided to Vantage (‘Vantage Global Limited’, ‘we’) by a third-party provider (‘Everest Fortune Group’). Please be reminded that you are solely responsible for the trading decisions on your account. There is a very high degree of risk involved in trading. Any information and/or content is intended entirely for research, educational and informational purposes only and does not constitute investment or consultation advice or investment strategy. The information is not tailored to the investment needs of any specific person and therefore does not involve a consideration of any of the investment objectives, financial situation or needs of any viewer that may receive it. Kindly also note that past performance is not a reliable indicator of future results. Actual results may differ materially from those anticipated in forward-looking or past performance statements. We assume no liability as to the accuracy or completeness of any of the information and/or content provided herein and the Company cannot be held responsible for any omission, mistake nor for any loss or damage including without limitation to any loss of profit which may arise from reliance on any information supplied by Everest Fortune Group.
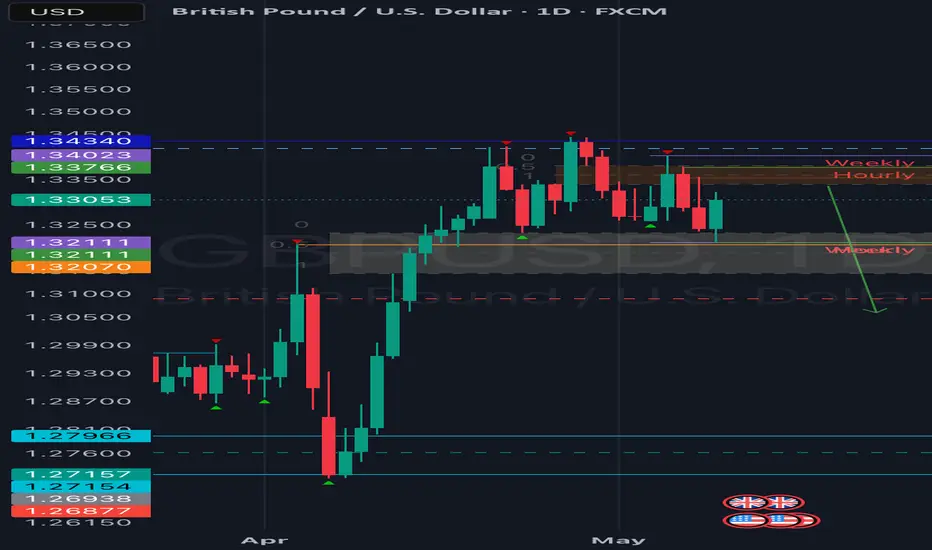
GBPUSD…inverse FVGGood day traders I have a lot of great setups but I believe this one can be a big mover going into the new week.
1D- Before going into more details I hope the inverse FVG is visible because that’s the area of interest, for the most part of last week was bearish indicating that US dollar for the upcoming week might continue with the strength shown last week. Price has broken structure lower but the way it broke price is not in a convincing way so keep an open mind to manipulation but overall the inverse is our area of interest. Monday and Tuesday we can expect price to move higher first than make a run lower since last week the move did not match the USD/XXX moves.
4H- Here we saw market shift lower to be in sync with the daily solidifying our weekly price movement bias. Here I’m not gonna say much cause the idea is based of the daily TF.
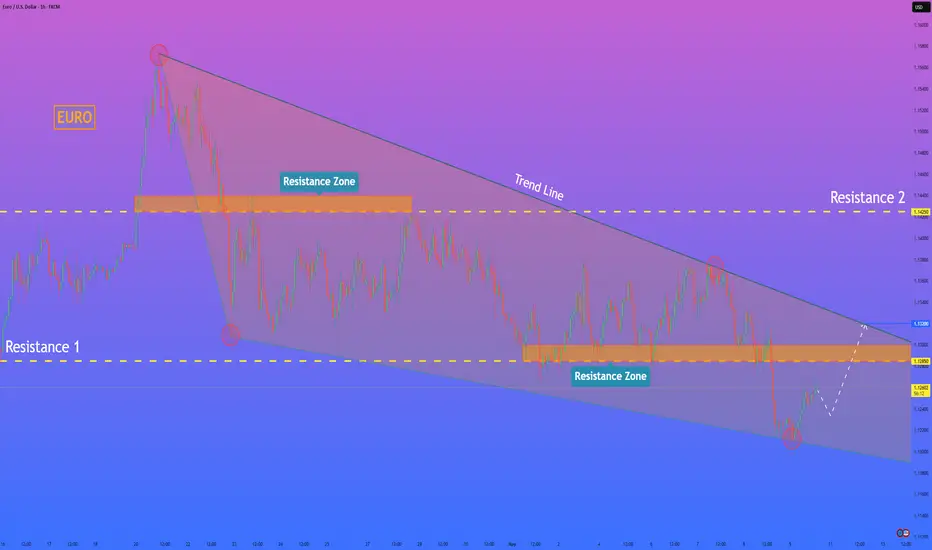
HelenP. I Euro may break resistance level and rise to trend lineHi folks today I'm prepared for you Euro analytics. If we look at the chart, we can see how the price a long period of slow decline, finally showing early signs of potential reversal. The price has been moving inside a falling wedge pattern, consistently testing lower highs and lower lows. But now, after touching the lower boundary of the structure and reacting near the 1.1200 zone, buyers have stepped in with notable strength. This level aligns not only with the wedge’s base but also with a previous support zone, which adds weight to the current move. The first reaction was sharp, the price rebounded confidently, and started forming higher local lows. That suggests the bearish momentum is weakening, while the structure itself points toward a possible breakout. If the Euro continues to build this upward momentum, it could break through the 1.1285 - 1.1300 resistance zone, which has already acted as a ceiling multiple times. That zone now becomes the key pivot for the next phase of the movement. Given the wedge structure, price behavior near support, and the current momentum, I expect EURUSD may reach the trend line, breaking the resistance level, and continue to grow to the trend line. That's why I set my goal at 1.1320 points, which coincides with the trend line. If you like my analytics you may support me with your like/comment ❤️
EUR_USD MOVE DOWN IS LIKELY|SHORT|
✅EUR_USD is retesting a
Horizontal resistance level
Around 1.1280 and we are
Locally bearish biased we
Will be expecting a pullback
And a local move down
On Monday
SHORT🔥
✅Like and subscribe to never miss a new idea!✅
Disclosure: I am part of Trade Nation's Influencer program and receive a monthly fee for using their TradingView charts in my analysis.

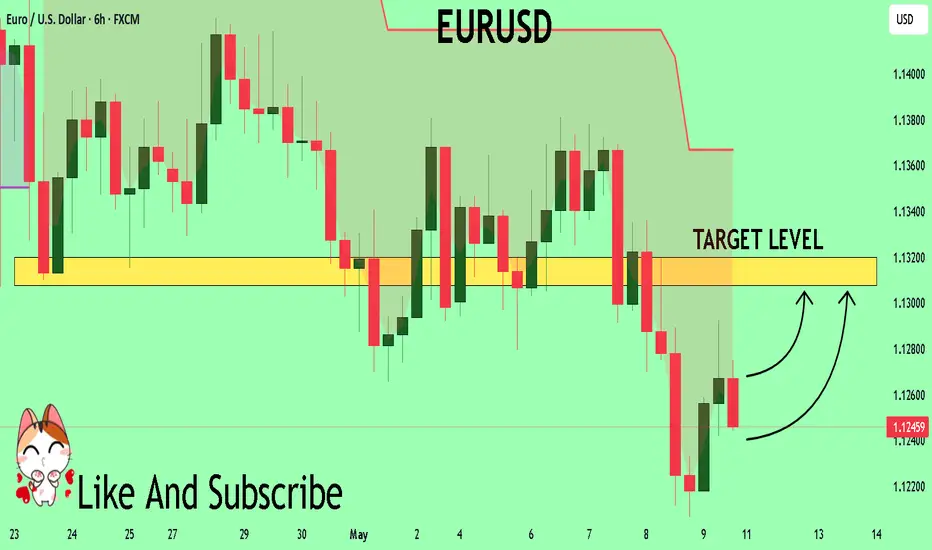
EURUSD On The Rise! BUY!
My dear friends,
EURUSD looks like it will make a good move, and here are the details:
The market is trading on 1.1245 pivot level.
Bias - Bullish
Technical Indicators: Supper Trend generates a clear long signal while Pivot Point HL is currently determining the overall Bullish trend of the market.
Goal - 1.1307
About Used Indicators:
Pivot points are a great way to identify areas of support and resistance, but they work best when combined with other kinds of technical analysis
Disclosure: I am part of Trade Nation's Influencer program and receive a monthly fee for using their TradingView charts in my analysis.
———————————
WISH YOU ALL LUCK
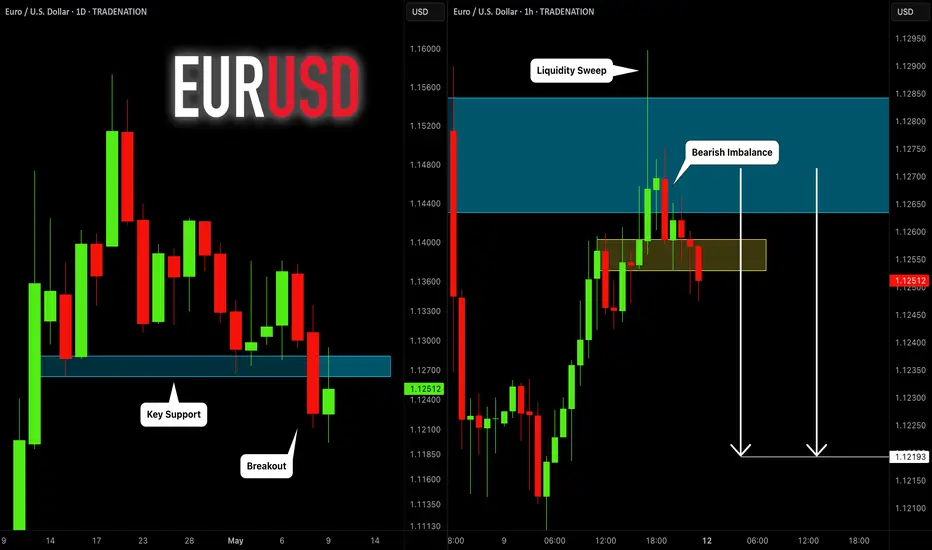
EURUSD: Liquidity Grab & Bearish Outlook 🇪🇺🇺🇸
EURUSD broke and closed below a key daily horizontal
support cluster on a daily.
After a breakout, the broken structure turned into a strong resistance
and was retested.
I spotted a confirmed liquidity grab on an hourly time frame
and a consequent bearish imbalance candle.
Probabilities will be high that the price will drop
at least to 1.122
❤️Please, support my work with like, thank you!❤️
I am part of Trade Nation's Influencer program and receive a monthly fee for using their TradingView charts in my analysis.
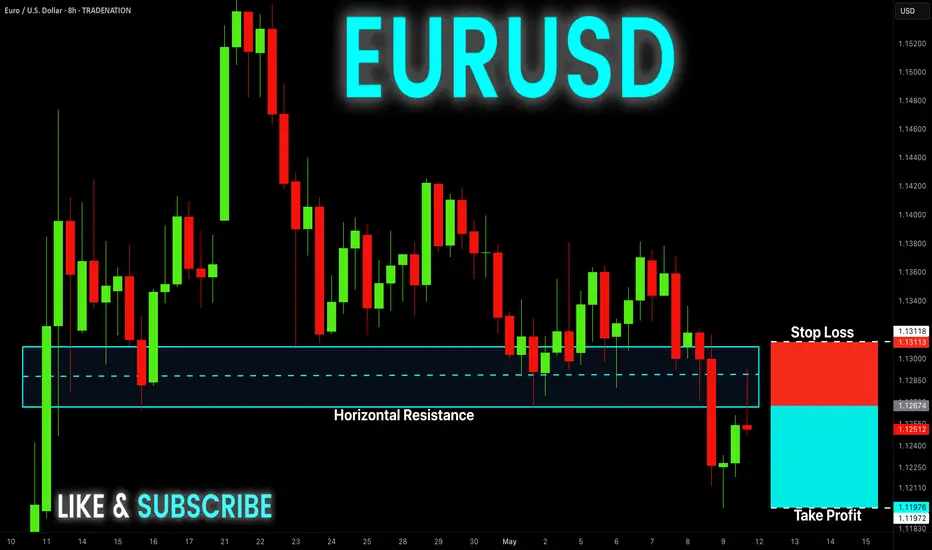
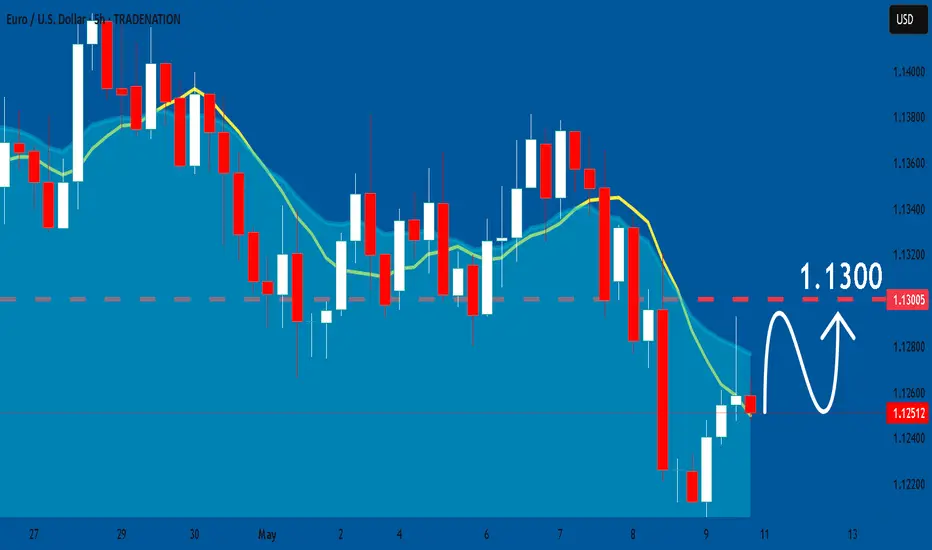
EUR-USD Free Signal! Sell!
Hello,Traders!
EUR-USD broke the horizontal
Level of 1.1300 which is now
A resistance and went down
So the breakout is confirmed
And now the pair is retesting
The resistance so as we are
Bearish biased we will be
Able to to enter a short trade
On Monday with the Take
Profit of 1.1197 and the
Stop Loss of 1.1311
Sell!
Comment and subscribe to help us grow!
Check out other forecasts below too!
Disclosure: I am part of Trade Nation's Influencer program and receive a monthly fee for using their TradingView charts in my analysis.
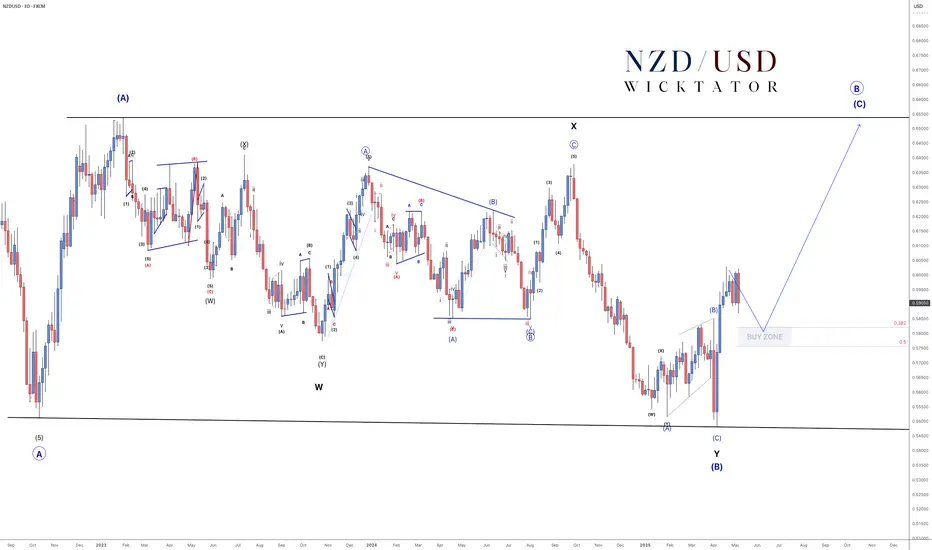
NZDUSD - Elliott Wave Setup: Eyes on the Buy Zone!NZDUSD - 3D Chart Elliott Wave Outlook
We've been tracking NZDUSD over the years and each move continues to align with Elliott Wave Theory.
The current structure is unfolding as a large ABC corrective pattern.
- Wave A and the complex Wave B (WXY) are now complete.
- We're now in Wave C, and we expect it to target the highs of Wave A.
Recently, NZDUSD made a clear bullish impulse but has been consolidating for the past 3 weeks. This correction is likely to resolve with a bullish breakout.
We've marked a buy zone between the 38.2% and 50% Fibonacci retracement levels, which we believe is the ideal entry area. We'll be watching this zone closely for lower timeframe bullish confirmations like a break of structure (BOS) or trendline break.
Trade Plan:
- Wait for price to enter the buy zone
- Look for bullish confirmations (BOS, trendline break)
- Enter after confirmation, with stops below the corrective lows
- Targets: 0.63 (500 pips), 0.65 (700 pips)
Goodluck and as always, Trade Safe!
EURUSD My Opinion! SELL!`
My dear subscribers,
EURUSD looks like it will make a good move, and here are the details:
The market is trading on 1.1357 pivot level.
Bias - Bearish
Technical Indicators: Both Super Trend & Pivot HL indicate a highly probable Bearish continuation.
Target - 1.1324
About Used Indicators:
The average true range (ATR) plays an important role in 'Supertrend' as the indicator uses ATR to calculate its value. The ATR indicator signals the degree of price volatility.
Disclosure: I am part of Trade Nation's Influencer program and receive a monthly fee for using their TradingView charts in my analysis.
———————————
WISH YOU ALL LUCK
EURUSD: Growth & Bullish Forecast
The analysis of the EURUSD chart clearly shows us that the pair is finally about to go up due to the rising pressure from the buyers.
Disclosure: I am part of Trade Nation's Influencer program and receive a monthly fee for using their TradingView charts in my analysis.
❤️ Please, support our work with like & comment! ❤️
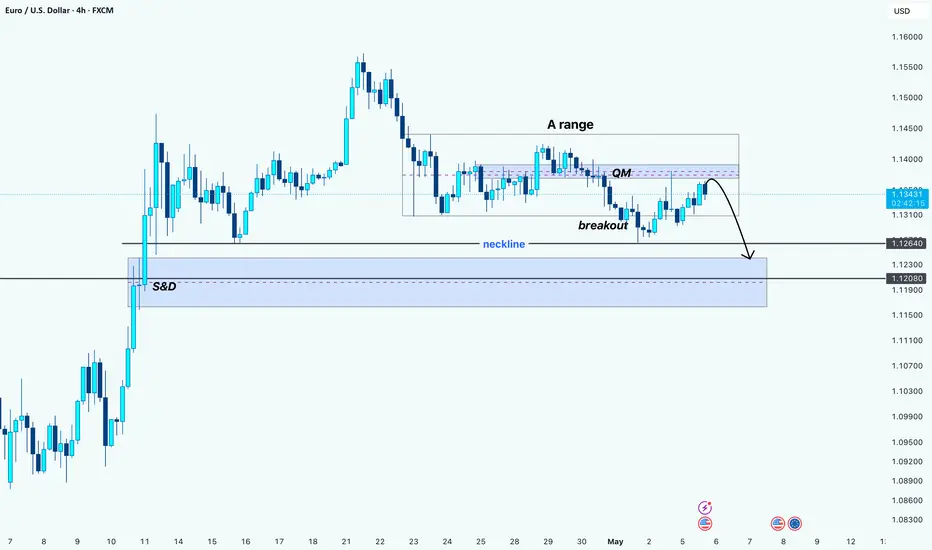
EUR/USD Bearish Setup: QM + Breakout Play Targeting Demand Zone!Hello guys!
I think eurusd is bearish! why?
A Range: Market consolidated in a tight horizontal range before breaking out.
QM Pattern: A lower high and lower low structure indicates potential for a trend reversal.
Neckline Break: Bearish confirmation with a strong break and close below neckline support.
Retest Zone: Price is now revisiting the QM supply zone, offering a high-probability short setup.
Bearish Projection: The next expected move is a drop toward the S&D (Support & Demand) zone between 1.12640 and 1.11900, which aligns with historical demand and previous accumulation.
________________________
🎯 Bearish Target Zone:
First TP: 1.12640
Final TP: 1.11900 - 1.12080 (Demand Zone)