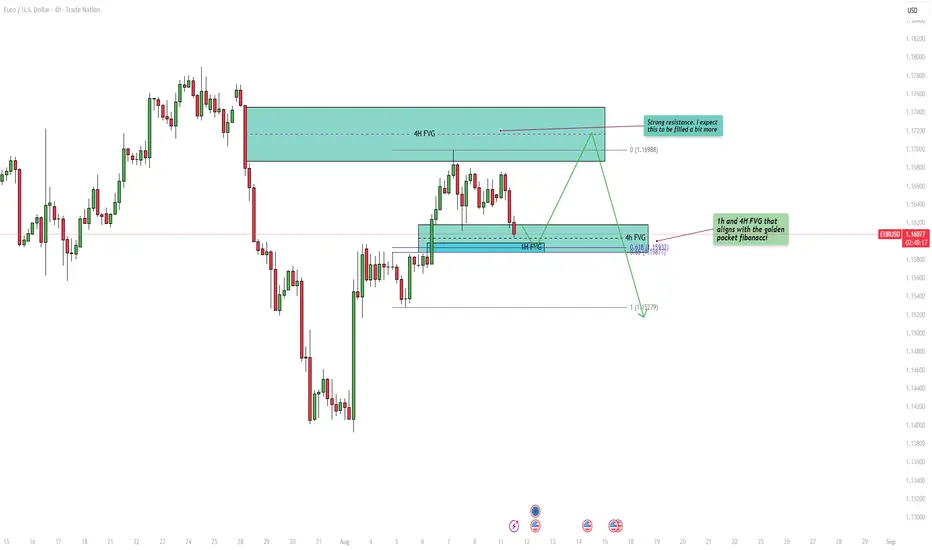
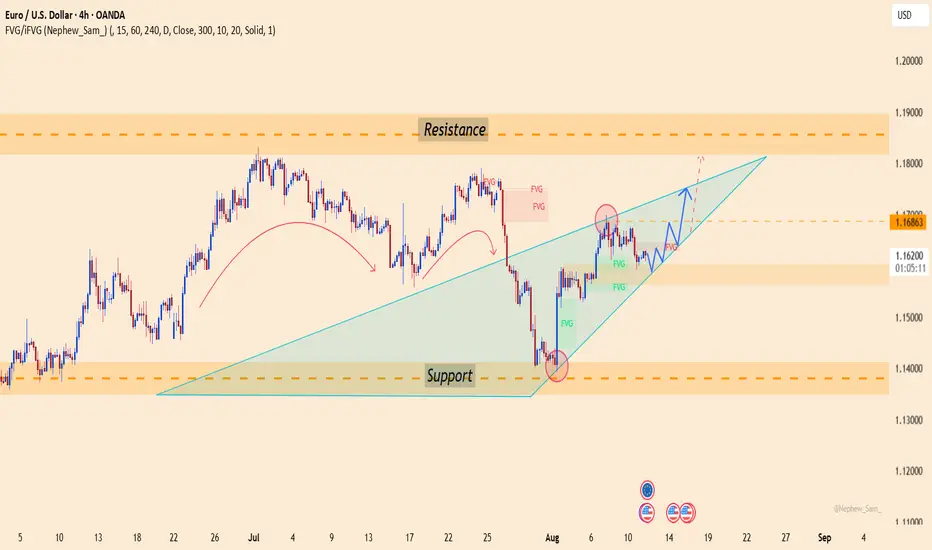
EURUSD - Bullish fair value gap and fibonacci support!At the end of July, EUR/USD experienced a sharp and decisive move to the downside, signaling a strong bearish momentum in the market. Following this decline, the pair began to recover, steadily climbing and partially filling the 4-hour Fair Value Gap (FVG). After tapping into the 4-hour FVG, price action has entered a corrective phase, moving lower towards a confluence of bullish levels. This area is defined by both the 1-hour and 4-hour FVGs, which align perfectly with the golden pocket of the Fibonacci retracement tool, a high-probability zone often watched by traders for potential reversals.
Bullish Support
The key bullish support zone sits around the 1.158 to 1.160 range. This area holds significant importance because it combines two strong technical factors: the 1-hour and 4-hour FVGs, as well as the golden pocket Fibonacci retracement. The overlap of these technical elements often acts as a magnet for price and can create a strong foundation for a bullish reaction. If the market respects this zone, we could see EUR/USD push higher in the short term, as traders capitalize on the support to drive price towards higher resistance areas.
Bearish Resistance
On the upside, the main bearish resistance zone lies between 1.170 and 1.174. This area represents the final portion of the unfilled bearish 4-hour FVG and could act as a significant barrier for further bullish progress. If price returns to this level, the strong supply pressure could result in a sweep of recent highs, fully filling the 4-hour FVG before potentially resuming the downward trend. This scenario aligns with the idea that sellers may re-enter the market aggressively once this resistance zone is tested.
Final Thoughts
Given the current market structure, my expectation is that the bullish support zone around 1.158 to 1.160 will hold, providing a potential launchpad for price to revisit and possibly complete the filling of the bearish 4-hour FVG near 1.174. However, if the market breaks decisively below the 1-hour FVG, it could indicate a shift in sentiment, opening the door for a bearish continuation and deeper downside targets. The coming sessions will be critical in determining whether EUR/USD can maintain bullish momentum or if sellers will regain control.
-------------------------
Disclosure: I am part of Trade Nation's Influencer program and receive a monthly fee for using their TradingView charts in my analysis.
Thanks for your support. If you enjoyed this analysis, make sure to follow me so you don't miss the next one. And if you found it helpful, feel free to drop a like 👍 and leave a comment 💬, I’d love to hear your thoughts!
Eurusd-3
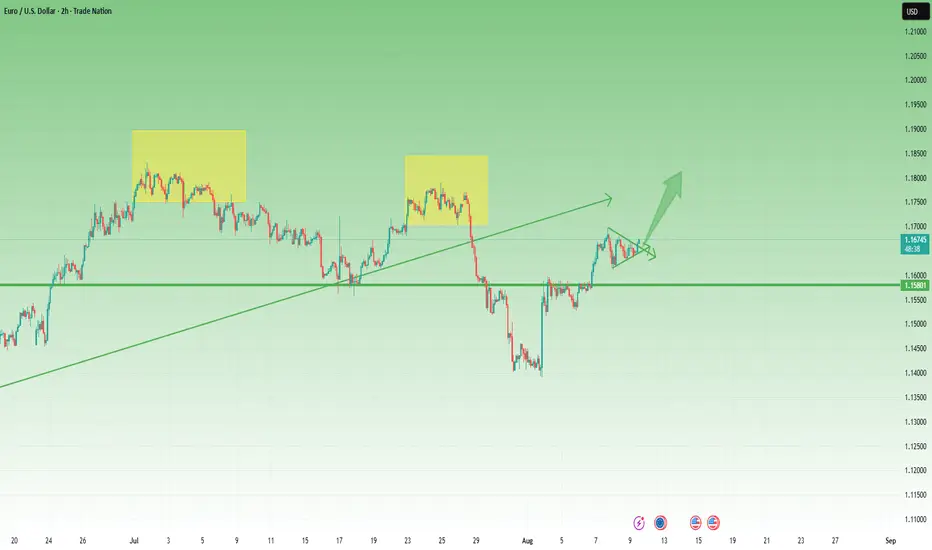
EUR/USD Momentum Builds After Pennant BreakAfter reversing to retest the broken double top neckline and consolidating early last week, the probabilities shifted in favour of an upside continuation.
Following this consolidation under resistance, EUR/USD broke back above, hitting a local high at 1.17 on Tuesday. A pullback followed, forming a clean pennant pattern on the lower timeframes.
The Asian open today brought a decisive breakout above that pennant’s resistance, putting the bias once again to the upside.
Upside target : 1.18 zone
Invalidation: Only if price drops back below 1.16
Disclosure: I am part of TradeNation's Influencer program and receive a monthly fee for using their TradingView charts in my analyses and educational articles.
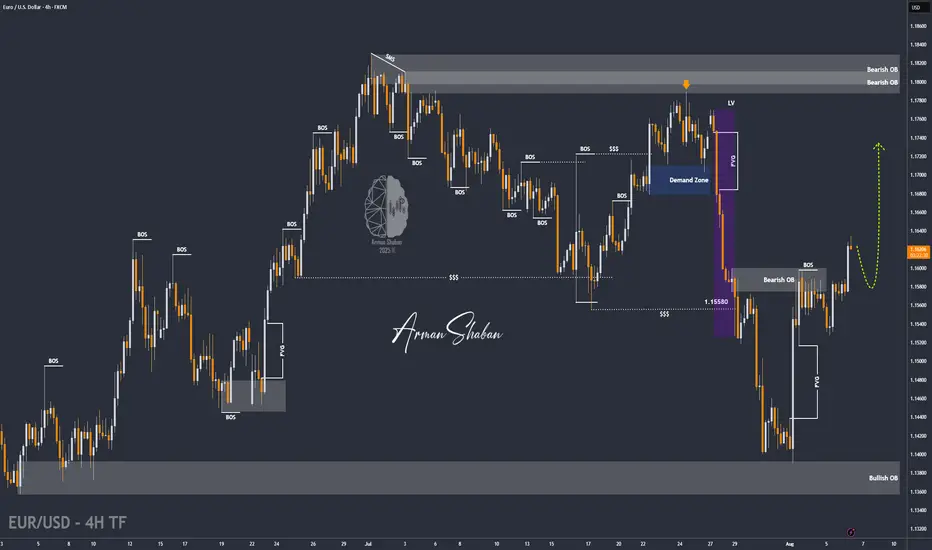
XAU/USD | Gold at Make-or-Break $3400! BUY or SHORT ? (READ)By analyzing the gold chart on the 4-hour timeframe, we can see that, as expected from the previous analysis, the price began to rise and gained over 250 pips, reaching the $3409 supply zone. Upon hitting this key level, gold faced selling pressure and dropped more than 290 pips down to $3380. When it returned to this important level, strong buying stepped in again, and it is now trading around $3391.
The total return from this analysis so far has been over 540 pips. If gold manages to hold above $3400, the next upside targets will be $3409, $3416, and $3419. Keep an eye on the $3419–$3434 zone for potential reactions. Show some strong support for this analysis, friends, and stay tuned for direct trade setups based on it!
THE Previous Analysis :
Best Regards , Arman Shaban

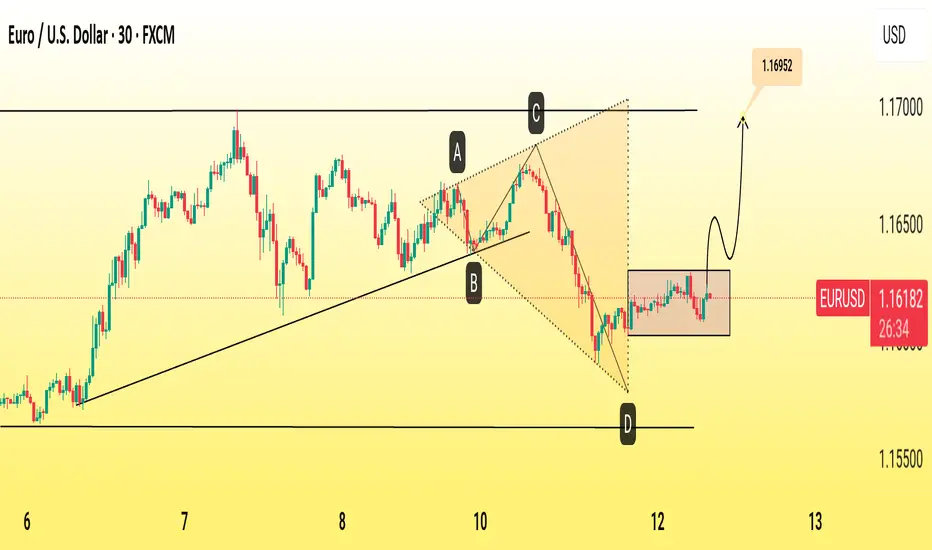
EUR/USD Bullish Reversal Pattern Targets 1.1695The EUR/USD 30-minute chart shows a completed ABCD harmonic pattern with a sharp bounce from the 1.1600 support zone. Price action suggests a bullish reversal toward the projected target of 1.1695, supported by strong demand at point D and a break above minor resistance. Traders may watch for confirmation on pullbacks before continuation.
1. Pattern Structure – ABCD Harmonic
The chart outlines an ABCD harmonic pattern, with points labeled A, B, C, and D.
Point D aligns with a strong horizontal support level around 1.1600, suggesting a potential reversal zone.
2. Trend Context
The pair had been in an uptrend from August 6–8, followed by a correction forming the ABCD structure.
The correction ended with a sharp drop from point C to D, creating an oversold condition.
3. Support & Reversal Zone
Point D is positioned at a confluence of prior lows and trendline support, increasing the probability of a bounce.
The recent candles show stabilization and early bullish pressure.
4. Projection & Target
The pattern projects a potential upward move toward 1.16952.
This aligns with previous swing highs and offers a realistic short-term bullish target.
5. Trade Implication
A break above minor consolidation near 1.1625 would add confirmation.
Risk management should place stops below 1.1600 in case of a false breakout.
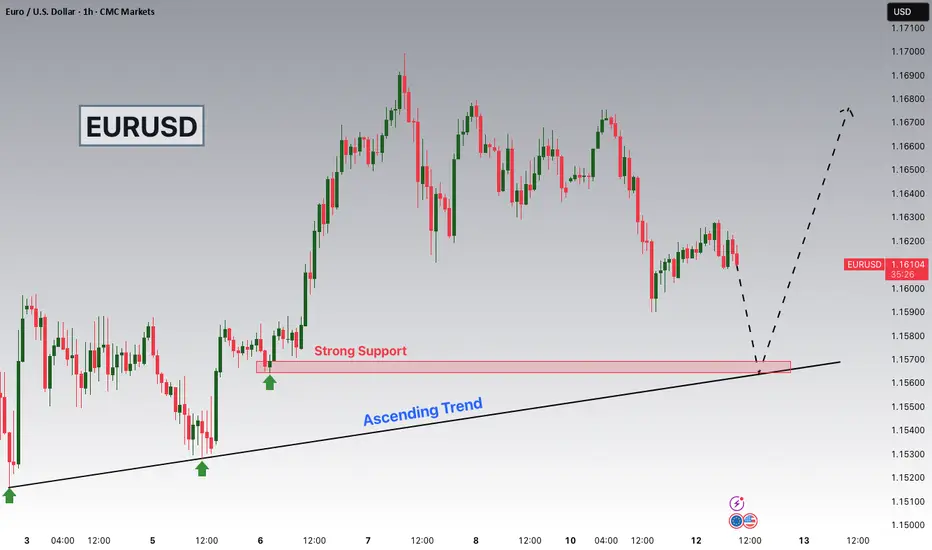
EURUSD Potential UpsiddesHey Traders, in today's trading session we are monitoring EURUSD for a buying opportunity around 1.15700 zone, EURUSD is trading in an uptrend and currently is in a correction phase in which it is approaching the trend at 1.15700 support and resistance area.
Trade safe, Joe.
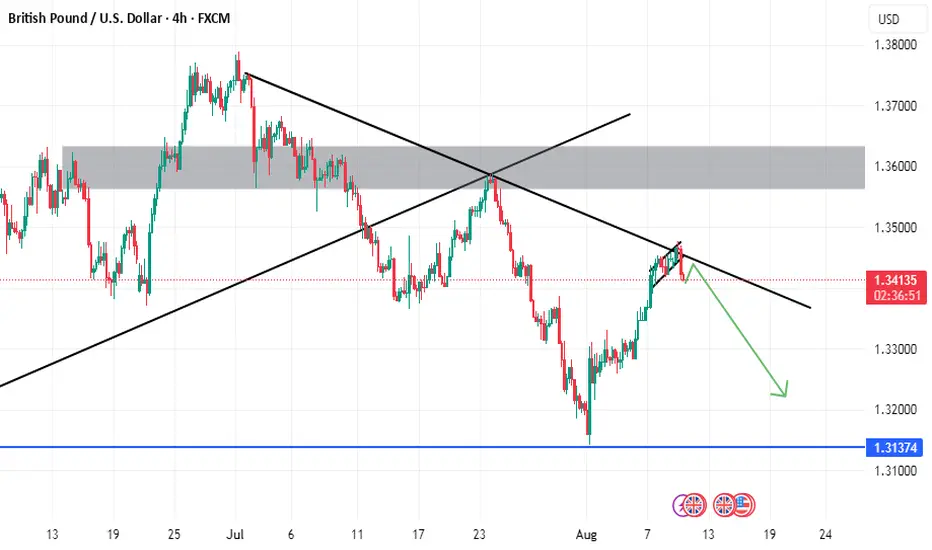
GBPUSD SELL SETUPI EXPECT THE PRICE Will fall as we have bearish flag has been broken
and we have down trend and we have supply
EUR/USD: Can the Uptrend Continue?Hello everyone, it's great to be back with you today!
In our previous discussion, we talked about the short-term uptrend in FX:EURUSD , and it seems that things are still going smoothly.
Recently, the weakening of the USD, with expectations that the Fed will cut interest rates three times this year, has undermined the USD and supported EUR. The DXY chart clearly reflects the weakness of the USD.
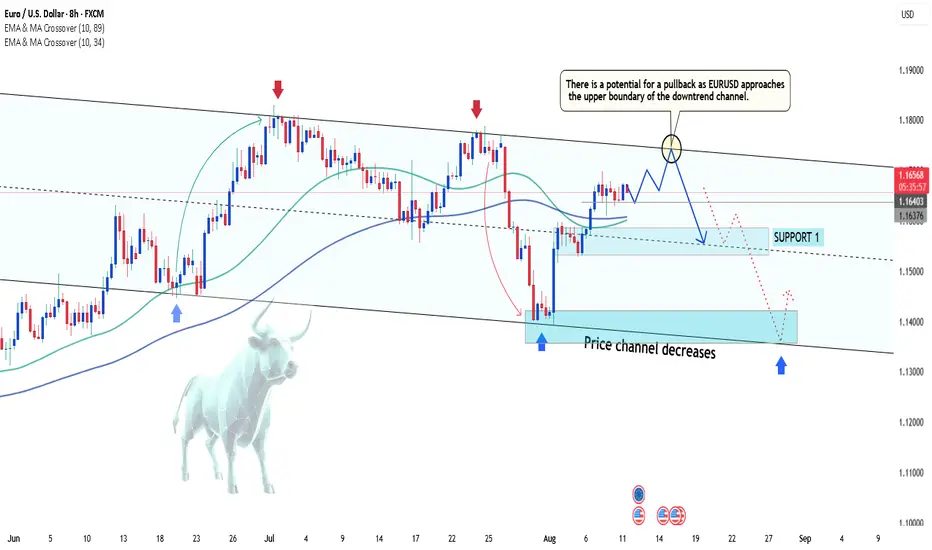
In the short term, EUR/USD may continue to fluctuate within a narrow range, with support at 1.163 and resistance at 1.1750. If U.S. inflation data remains weak and the Fed continues to cut rates, the EUR could appreciate.
However, in the long term, attention should be given to the 1.1750 resistance level, as it is a strong barrier and also the upper limit of the price channel.
What do you think, will EURUSD be able to maintain its uptrend?
EURUSD: Local Bullish Bias! Long!
My dear friends,
Today we will analyse EURUSD together☺️
The price is near a wide key level
and the pair is approaching a significant decision level of 1.16045 Therefore, a strong bullish reaction here could determine the next move up.We will watch for a confirmation candle, and then target the next key level of 1.16229.Recommend Stop-loss is beyond the current level.
❤️Sending you lots of Love and Hugs❤️

EURUSD : Buy to Win ? Hello everyone, what’s your view on FX:EURUSD trend?
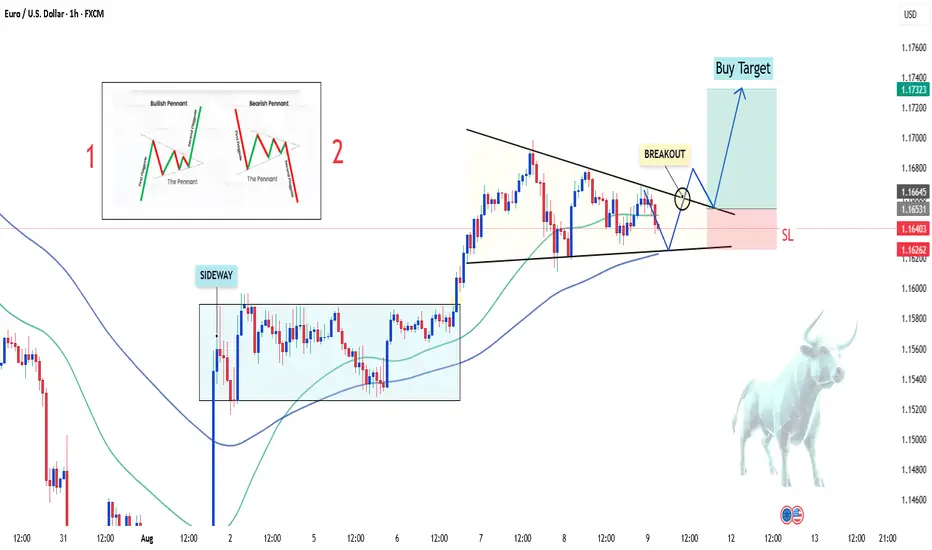
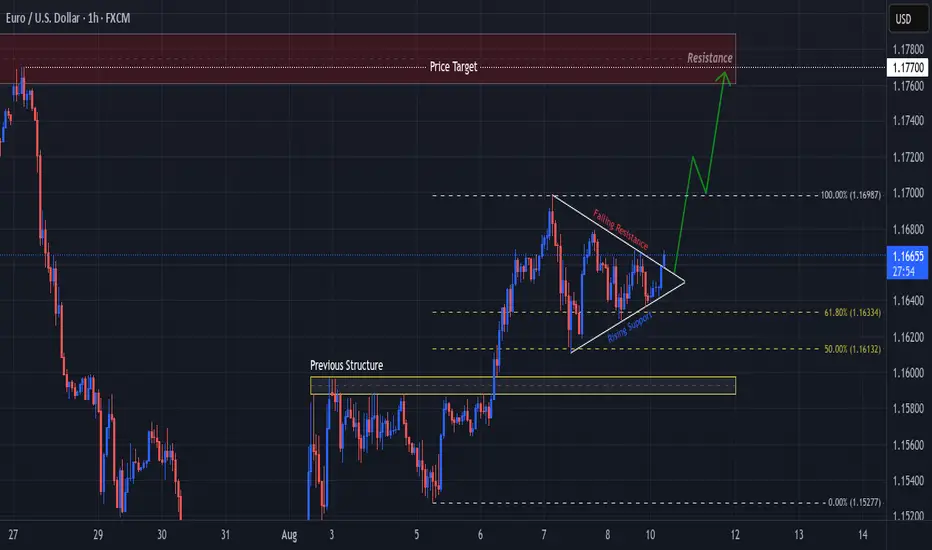
EURUSD is currently forming its first Bullish Pennant pattern after a strong upward move, suggesting a high probability that the market will continue to push higher.
On the H1 chart, after a period of sideways movement, the price has broken out and entered a narrowing consolidation zone – a hallmark of the pennant pattern. The short-term EMA remains above the long-term EMA, supporting the bullish bias.
Preferred scenario: If the price breaks clearly above the upper boundary of the pattern, the buying target will be in the 1.17xx zone.
This pattern often appears in the middle of a trend, so if the breakout is successful, the rally could extend with stronger buying momentum.
Good luck!
Kevinn_Nguyen!
BEARISH ON EURUSDStrong bullish push on the Monthly TF and Bearish on DXY, expeting pullback. Daily TF traded into an FVG with indicision candle followed with bearish candle. BOS on 1H TF and pushing down.

EUR/USD Analysis – Hunting a Buy Opportunity from a Key Zone💹 EUR/USD Analysis – Hunting a Buy Opportunity from a Key Zone 🇪🇺💵
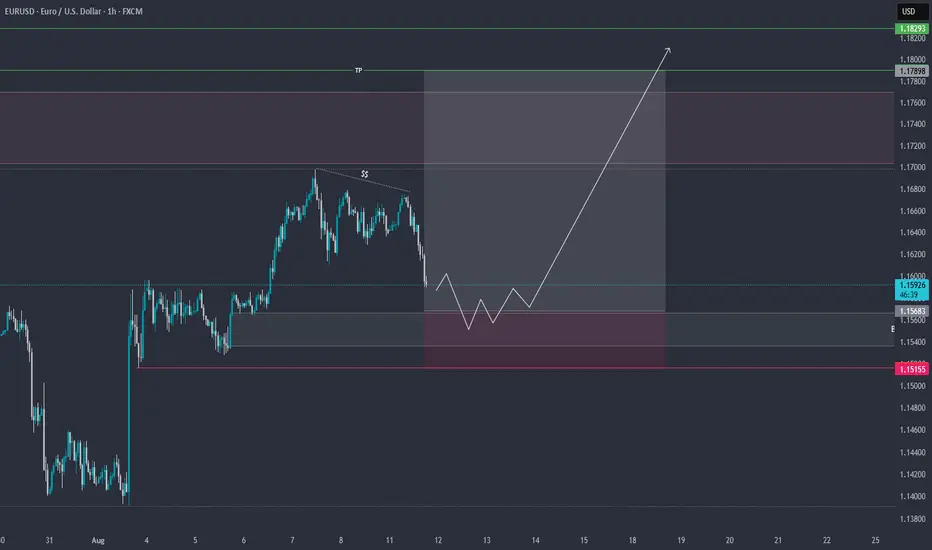
After a correction and drop from the recent high, the Euro is approaching a major support area and the Buy Zone.
My scenario: If price reaches this area and confirms with price action, I expect a strong rebound towards higher targets.
📌 Key points:
Short-term bearish structure, but correction nearing completion
Support zone overlapping with Fibonacci confluence
Potential target above the previous high
⚠️ This is a personal view, not financial advice. Always apply risk management.
❓ What do you think? Could this correction be the start of a bullish rally, or will the drop continue?
------------------------------------------------------------------------------------------------------
🚀 Who am I?
I'm Mahdi, a prop firm trader with 7+ years of experience in technical analysis, mainly focusing on Smart Money Concepts and Elliott Wave theory.
I specialize in delivering high-quality trading signals, market insights, and educational content tailored for serious traders and investors.
📊 My Tools: SMC, Elliott Wave, Fibonacci, Liquidity Grabs, Order Blocks
💼 Prop Challenge Passed: Yes | Funded Account: In Progress
🔗 Follow for consistent updates and trading insights.
EURUSD: Uptrend Continues, Targeting New Resistance!Market Overview:
The CPI m/m was reported at 0.3%, higher than the expected 0.2%, boosting expectations that the Fed will continue to raise interest rates. Despite the strengthening USD, EURUSD continues its uptrend due to strong price structure and technical support in the short term.
Technical Analysis:
EURUSD is currently trading in an upward price channel, with strong support at 1.15800 USD. If the price maintains above this level, there is a high chance it will test the resistance at 1.16863 USD. If this resistance is broken, the price could continue to rise towards 1.17500 USD.
The chart shows that the upward price structure is supporting the trend, forming higher highs and higher lows, signaling the continuation of the bullish trend.
EUR/USD | Holding Above 1.16 Could Unlock More Upside! (READ IT)By analyzing the EURUSD chart on the 4-hour timeframe, we can see that the price reacted beautifully to all the marked zones on the chart. Especially after reaching the 1.14 demand area, it experienced a strong bullish move, rallying over 200 pips to hit 1.16. Currently, EURUSD is trading around 1.16220, and if it holds above the 1.16 level, we can expect further upside. The next bullish targets are 1.16435, 1.16780, 1.17100, and 1.17500.
Please support me with your likes and comments to motivate me to share more analysis with you and share your opinion about the possible trend of this chart with me !
Best Regards , Arman Shaban
EURUSD retested bearish wedge. Ready to decline?EURUSD retested bearish wedge. Ready to decline?
EURUSD has been trading bullish since the beginning of August after disappointing NFP report data came out. By the end of last week price has come to a lower border of the wedge and SMA200 on 4-h chart, but failed to develop bullish momentum and pulled back from it. The asset shows weakness and further decline towards 1.14000 as a first target is expected. MACD is in the red zone.

EURUSD – Eyes on the Supply Zone Before the Big DropRight now, I see EURUSD gearing up for a bigger fall. The recent price rejection and break below key fib levels hint at strong bearish pressure. My expectation is for the price to head toward the highlighted Supply Zone around 1.1553.
If the market respects this zone, we could see a short-term bounce. But if price breaks and closes below it, I’m looking for a bearish continuation toward deeper levels near 1.1518 and possibly 1.1494.
The EMA is also above current price action, adding extra weight to the bearish bias. For me, this setup signals a “stay short until proven otherwise” approach.
📉 Bias – Bearish towards the Supply Zone
📍 Key Break Point – 1.1553 zone
🎯 Next Targets if broken – 1.1518 / 1.1494

Fiber Cable and Dollar Index. 11.08.2025, MondayTVC:DXY
FX:EURUSD
FX:GBPUSD
Expecting onesided distribution on DXY towards June monthly open. And according to strength analysis on EURGBP euro looks weaker. Which means it is a better pair for shorts compare to Pound

EURUSD: Will Go UP! BUY!
My dear friends,
Please, find my technical outlook for EURUSD below:
The price is coiling around a solid key level - 1.1623
Bias - Bullish
Technical Indicators: Pivot Points Low anticipates a potential price reversal.
Super trend shows a clear buy, giving a perfect indicators' convergence.
Goal - 1.1671
Safe Stop Loss - 1.1587
About Used Indicators:
The pivot point itself is simply the average of the high, low and closing prices from the previous trading day.
Disclosure: I am part of Trade Nation's Influencer program and receive a monthly fee for using their TradingView charts in my analysis.
———————————
WISH YOU ALL LUCK

EURUSD H4 | Bullish bounce EUR/USD is falling towards the buy entry which is an overlap support that lines up with the 38.2% Fibonacci retracement and could bounce from this level to the take profit.
Buy entry is at 1.15871, which is an overlap support that lines up with the 38.2% Fibonacci retracemnt.
Stop loss is at 1.1521, which is a pullback support that lines up with the 61.8% FIbonacci retracement.
Take profit is at 1.17055, which is a pullback resistance.
High Risk Investment Warning
Trading Forex/CFDs on margin carries a high level of risk and may not be suitable for all investors. Leverage can work against you.
Stratos Markets Limited (tradu.com ):
CFDs are complex instruments and come with a high risk of losing money rapidly due to leverage. 65% of retail investor accounts lose money when trading CFDs with this provider. You should consider whether you understand how CFDs work and whether you can afford to take the high risk of losing your money.
Stratos Europe Ltd (tradu.com ):
CFDs are complex instruments and come with a high risk of losing money rapidly due to leverage. 66% of retail investor accounts lose money when trading CFDs with this provider. You should consider whether you understand how CFDs work and whether you can afford to take the high risk of losing your money.
Stratos Global LLC (tradu.com ):
Losses can exceed deposits.
Please be advised that the information presented on TradingView is provided to Tradu (‘Company’, ‘we’) by a third-party provider (‘TFA Global Pte Ltd’). Please be reminded that you are solely responsible for the trading decisions on your account. There is a very high degree of risk involved in trading. Any information and/or content is intended entirely for research, educational and informational purposes only and does not constitute investment or consultation advice or investment strategy. The information is not tailored to the investment needs of any specific person and therefore does not involve a consideration of any of the investment objectives, financial situation or needs of any viewer that may receive it. Kindly also note that past performance is not a reliable indicator of future results. Actual results may differ materially from those anticipated in forward-looking or past performance statements. We assume no liability as to the accuracy or completeness of any of the information and/or content provided herein and the Company cannot be held responsible for any omission, mistake nor for any loss or damage including without limitation to any loss of profit which may arise from reliance on any information supplied by TFA Global Pte Ltd.
The speaker(s) is neither an employee, agent nor representative of Tradu and is therefore acting independently. The opinions given are their own, constitute general market commentary, and do not constitute the opinion or advice of Tradu or any form of personal or investment advice. Tradu neither endorses nor guarantees offerings of third-party speakers, nor is Tradu responsible for the content, veracity or opinions of third-party speakers, presenters or participants.

EUR-USD Potential Long! Buy!
Hello,Traders!
EUR-USD made a retest
Of the horizontal support
Of 1.1590 from where we
Are already seeing a bullish
Rebound thus we will be
Expecting a further
Bullish move up
Buy!
Comment and subscribe to help us grow!
Check out other forecasts below too!
Disclosure: I am part of Trade Nation's Influencer program and receive a monthly fee for using their TradingView charts in my analysis.

EURUSD On The Rise! BUY!
My dear friends,
EURUSD looks like it will make a good move, and here are the details:
The market is trading on 1.1618 pivot level.
Bias - Bullish
Technical Indicators: Supper Trend generates a clear long signal while Pivot Point HL is currently determining the overall Bullish trend of the market.
Goal - 1.1642
Recommended Stop Loss - 1.1606
About Used Indicators:
Pivot points are a great way to identify areas of support and resistance, but they work best when combined with other kinds of technical analysis
Disclosure: I am part of Trade Nation's Influencer program and receive a monthly fee for using their TradingView charts in my analysis.
———————————
WISH YOU ALL LUCK

Pennant Breakout, EUR vs USD, Late July Highs Next?Price on FX:EURUSD has made a Pennant Breakout to the upside!
Next we will want to see a Retest to the Breakout of the Pattern and if successful, should be the Support Bulls need to take Price Higher!
The Late July Highs, last visited on July 27th @ 1.1770, will be the Price Target if the Breakout is Validated and Retest is Successful.
This week there is some heavy hitting news for the USD with CPI on Tuesday, PPI on Thursday and Retail Sales and Empire State Manufacturing (being forecast more bearish of all news) on Friday.
EURUSD: July inflation shapes sentiment Two weeks ago was a quite intensive time when it comes to U.S. macro data, so investors used the previous week to digest the latest available information and adjust their positions accordingly. As for data posted during the previous week for the U.S. economy, the ISM Services PMI in July reached 50,1, which was a bit lower from forecasted 51,5.
Economic data posted for the EuroZone include the HCOB Composite PMI final for July in Germany, which was standing at 50,6 while the same indicator for the Euro Zone was at the level of 50,9. Both indicators were in line with market expectations. The Producers Price Index in the Euro Zone in June was increased by 0,8% for the month, reaching 0,6% on a yearly basis. Factory orders in June in Germany dropped by -1,0% for the month, while the market was expecting to see an increase of 0,8%. Retail Sales in the Euro Zone in June were higher by 0,3%, leading the indicator to 3,1% for the year. The figure was higher from market expectations of 2,6%. The Balance of Trade in Germany in June was standing at euro 14,6B, much lower from expected euro 17,3B. The Industrial Production in Germany in June dropped by -1,9% for the month, again significantly surpassing the expected drop of -0,5%.
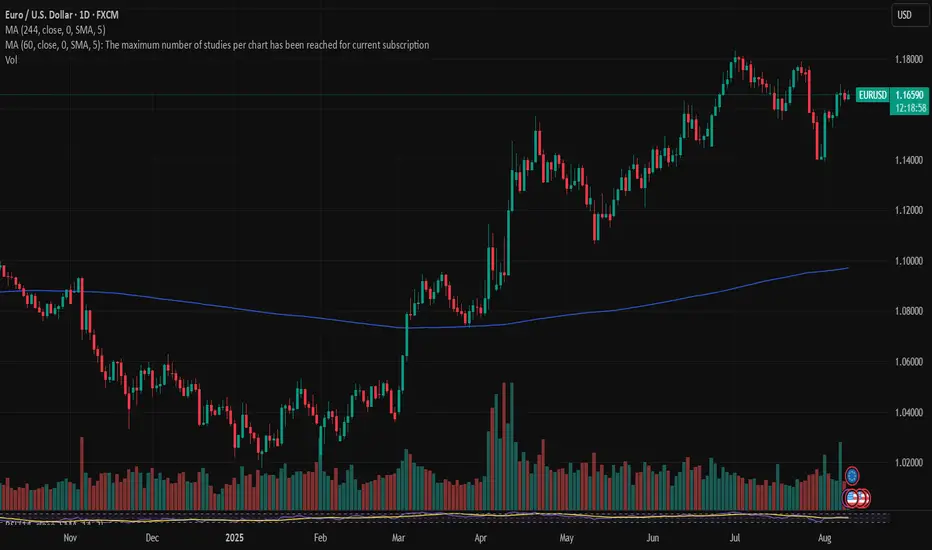
In line with the market repositioning based on the latest published data, so the U.S. Dollar headed toward the levels from three weeks ago. The eurusd pair started the previous week by testing the 1,14 support line and swiftly moved to the higher grounds, reaching 1,1691 as the highest weekly level. The currency pair closed the week at 1,1640. The RSI moved from the oversold market side, and reached the level of 50 as of the weekend. It still does not provide a clear suggestion that the market is ready to head toward the overbought market side. The MA50 continued its divergence from MA200, without an indication of a potential slowdown of divergence in the coming period.
Based on current charts, there is some potential for eurusd to move to even higher grounds in the coming period, in order to test the 1,17 resistance level. At the same time, there is also some probability that a modest reversal might continue from Friday's trading session at the start of the week ahead. In this sense, support at 1,16 could be tested for one more time. Still, it should be considered that the US inflation figures for July will be posted during the week, as well as retail sales in July, in which sense, some modestly higher volatility might be implied at the release of these data.
Important news to watch during the week ahead are:
EUR: ZEW Economic Sentiment Index in August in Germany, Industrial Production in the Euro Zone in June, GDP Growth Rate second estimate for Q2 in Euro Zone,
USD: Inflation Rate in July, Producers Price Index in July, Retail Sales in July, Industrial Production in July, University of Michigan Consumer Sentiment Index preliminary for August.
Bullish rise?The Fiber (EUR/USD) is falling towards the pivot and could bounce to the 1st resistance.
Pivot: 1.1591
1st Support: 1.1391
1st Resistance: 1.1811
Risk Warning:
Trading Forex and CFDs carries a high level of risk to your capital and you should only trade with money you can afford to lose. Trading Forex and CFDs may not be suitable for all investors, so please ensure that you fully understand the risks involved and seek independent advice if necessary.
Disclaimer:
The above opinions given constitute general market commentary, and do not constitute the opinion or advice of IC Markets or any form of personal or investment advice.
Any opinions, news, research, analyses, prices, other information, or links to third-party sites contained on this website are provided on an "as-is" basis, are intended only to be informative, is not an advice nor a recommendation, nor research, or a record of our trading prices, or an offer of, or solicitation for a transaction in any financial instrument and thus should not be treated as such. The information provided does not involve any specific investment objectives, financial situation and needs of any specific person who may receive it. Please be aware, that past performance is not a reliable indicator of future performance and/or results. Past Performance or Forward-looking scenarios based upon the reasonable beliefs of the third-party provider are not a guarantee of future performance. Actual results may differ materially from those anticipated in forward-looking or past performance statements. IC Markets makes no representation or warranty and assumes no liability as to the accuracy or completeness of the information provided, nor any loss arising from any investment based on a recommendation, forecast or any information supplied by any third-party.
