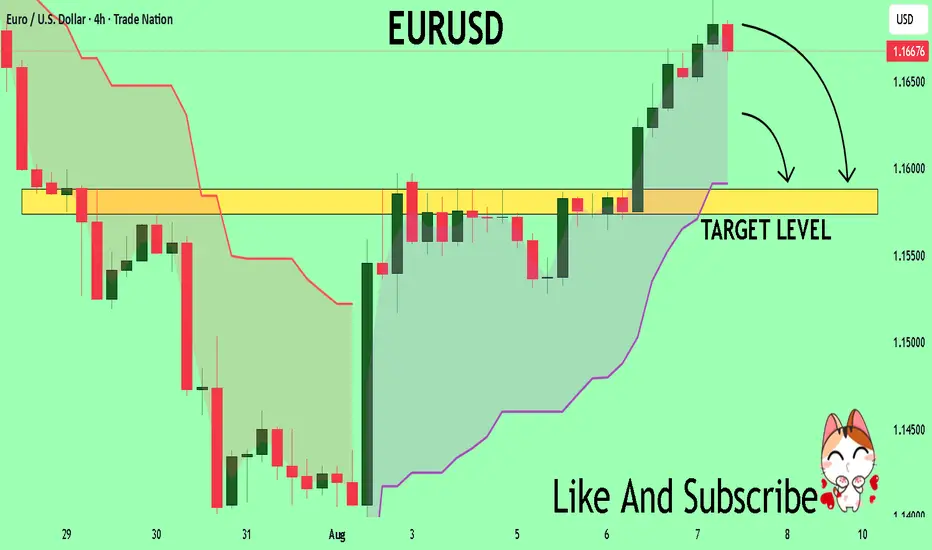
EUR/USD | Holding Above 1.16 Could Unlock More Upside! (READ IT)By analyzing the EURUSD chart on the 4-hour timeframe, we can see that the price reacted beautifully to all the marked zones on the chart. Especially after reaching the 1.14 demand area, it experienced a strong bullish move, rallying over 200 pips to hit 1.16. Currently, EURUSD is trading around 1.16220, and if it holds above the 1.16 level, we can expect further upside. The next bullish targets are 1.16435, 1.16780, 1.17100, and 1.17500.
Please support me with your likes and comments to motivate me to share more analysis with you and share your opinion about the possible trend of this chart with me !
Best Regards , Arman Shaban
Eurusd-3
EURUSD – DAILY FORECAST Q3 | W33 | D11 | Y25
📊 EURUSD – DAILY FORECAST
Q3 | W33 | D11 | Y25
Daily Forecast 🔍📅
Here’s a short diagnosis of the current chart setup 🧠📈
Higher time frame order blocks have been identified — these are our patient points of interest 🎯🧭.
It’s crucial to wait for a confirmed break of structure 🧱✅ before forming a directional bias.
This keeps us disciplined and aligned with what price action is truly telling us.
📈 Risk Management Protocols
🔑 Core principles:
Max 1% risk per trade
Only execute at pre-identified levels
Use alerts, not emotion
Stick to your RR plan — minimum 1:2
🧠 You’re not paid for how many trades you take, you’re paid for how well you manage risk.
🧠 Weekly FRGNT Insight
"Trade what the market gives, not what your ego wants."
Stay mechanical. Stay focused. Let the probabilities work.
FX:EURUSD

EURUSD: July inflation shapes sentiment Two weeks ago was a quite intensive time when it comes to U.S. macro data, so investors used the previous week to digest the latest available information and adjust their positions accordingly. As for data posted during the previous week for the U.S. economy, the ISM Services PMI in July reached 50,1, which was a bit lower from forecasted 51,5.
Economic data posted for the EuroZone include the HCOB Composite PMI final for July in Germany, which was standing at 50,6 while the same indicator for the Euro Zone was at the level of 50,9. Both indicators were in line with market expectations. The Producers Price Index in the Euro Zone in June was increased by 0,8% for the month, reaching 0,6% on a yearly basis. Factory orders in June in Germany dropped by -1,0% for the month, while the market was expecting to see an increase of 0,8%. Retail Sales in the Euro Zone in June were higher by 0,3%, leading the indicator to 3,1% for the year. The figure was higher from market expectations of 2,6%. The Balance of Trade in Germany in June was standing at euro 14,6B, much lower from expected euro 17,3B. The Industrial Production in Germany in June dropped by -1,9% for the month, again significantly surpassing the expected drop of -0,5%.
In line with the market repositioning based on the latest published data, so the U.S. Dollar headed toward the levels from three weeks ago. The eurusd pair started the previous week by testing the 1,14 support line and swiftly moved to the higher grounds, reaching 1,1691 as the highest weekly level. The currency pair closed the week at 1,1640. The RSI moved from the oversold market side, and reached the level of 50 as of the weekend. It still does not provide a clear suggestion that the market is ready to head toward the overbought market side. The MA50 continued its divergence from MA200, without an indication of a potential slowdown of divergence in the coming period.
Based on current charts, there is some potential for eurusd to move to even higher grounds in the coming period, in order to test the 1,17 resistance level. At the same time, there is also some probability that a modest reversal might continue from Friday's trading session at the start of the week ahead. In this sense, support at 1,16 could be tested for one more time. Still, it should be considered that the US inflation figures for July will be posted during the week, as well as retail sales in July, in which sense, some modestly higher volatility might be implied at the release of these data.
Important news to watch during the week ahead are:
EUR: ZEW Economic Sentiment Index in August in Germany, Industrial Production in the Euro Zone in June, GDP Growth Rate second estimate for Q2 in Euro Zone,
USD: Inflation Rate in July, Producers Price Index in July, Retail Sales in July, Industrial Production in July, University of Michigan Consumer Sentiment Index preliminary for August.
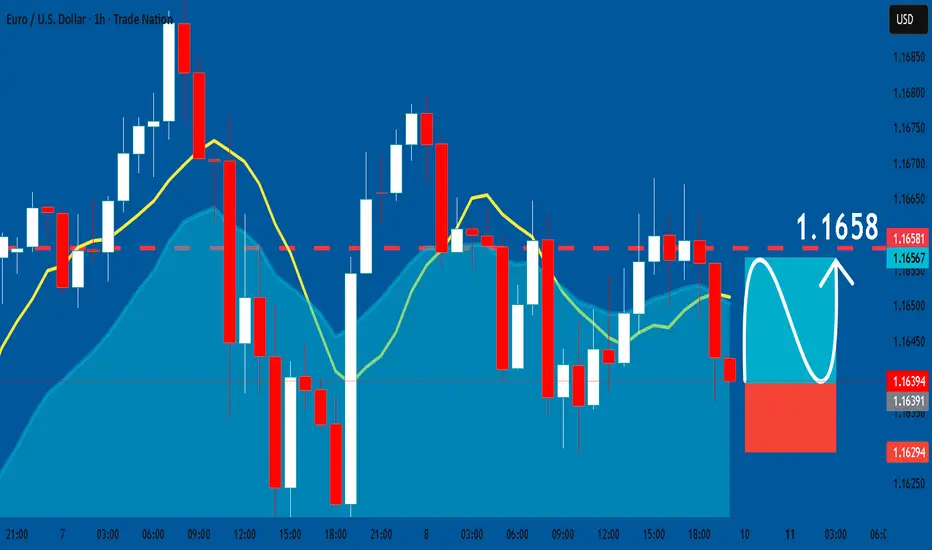
EURUSD: Long Signal Explained
EURUSD
- Classic bullish formation
- Our team expects growth
SUGGESTED TRADE:
Swing Trade
Buy EURUSD
Entry Level - 1.1639
Sl - 1.1629
Tp - 1.1658
Our Risk - 1%
Start protection of your profits from lower levels
Disclosure: I am part of Trade Nation's Influencer program and receive a monthly fee for using their TradingView charts in my analysis.
❤️ Please, support our work with like & comment! ❤️
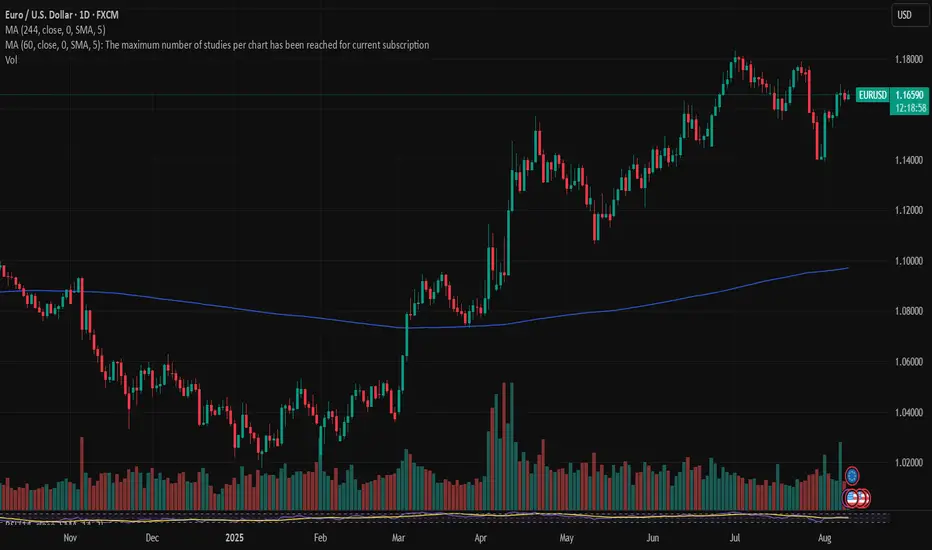
EURUSD 1D MA100 bounce targets 1.8750 at least.The EURUSD pair has been trading within a 4-month Channel Up and recently priced its latest Higher Low (pattern's bottom).
That happened to take place just above the 1D MA100 (green trend-line), giving a strong medium-term buy signal. As long as it holds, we expect the emerging Bullish Leg to target at least 1.18750 (the 1.1 Fibonacci extension) and in continuation 1.19700 (+5.11% from the bottom), both based on the previous Bullish Leg.
Notice also that the 1D MACD is forming its first Bullish Cross since May 26, a very strong additional buy signal.
-------------------------------------------------------------------------------
** Please LIKE 👍, FOLLOW ✅, SHARE 🙌 and COMMENT ✍ if you enjoy this idea! Also share your ideas and charts in the comments section below! This is best way to keep it relevant, support us, keep the content here free and allow the idea to reach as many people as possible. **
-------------------------------------------------------------------------------
Disclosure: I am part of Trade Nation's Influencer program and receive a monthly fee for using their TradingView charts in my analysis.
💸💸💸💸💸💸
👇 👇 👇 👇 👇 👇

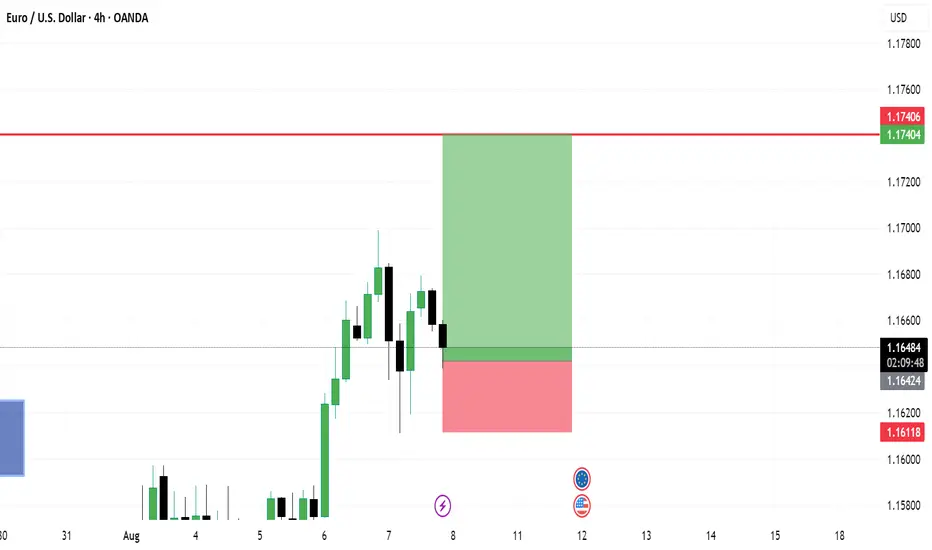
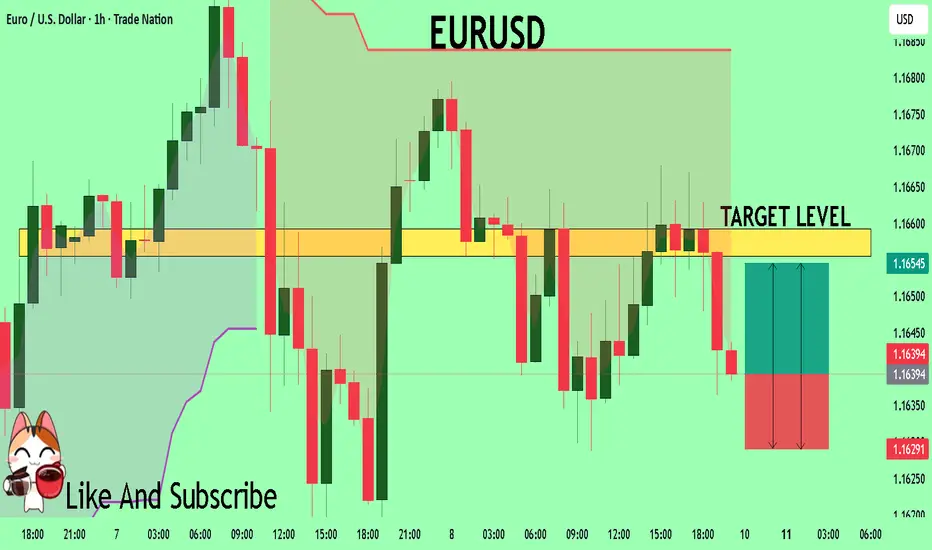
EURUSD: Short Signal with Entry/SL/TP
EURUSD
- Classic bearish setup
- Our team expects bearish continuation
SUGGESTED TRADE:
Swing Trade
Short EURUSD
Entry Point - 1.1625
Stop Loss - 1.1635
Take Profit - 1.1605
Our Risk - 1%
Start protection of your profits from lower levels
Disclosure: I am part of Trade Nation's Influencer program and receive a monthly fee for using their TradingView charts in my analysis.
❤️ Please, support our work with like & comment! ❤️

EURUSD Under Pressure Ahead of U.S. CPI ReleaseIn line with the dollar’s hold, EURUSD is trading between 1.1580 support and 1.17 resistance, forming a bullish rebound from its 200+ pip drop in July. A clean hold above 1.17 may extend gains toward the 1.18 resistance, with further upside possible toward the 2021 highs — with key levels in sight at 1.20 and 1.24.
On the downside, if the DXY recovery continues, EURUSD may face selling pressure below 1.1580, potentially pulling prices toward 1.1450 and 1.1380. A confirmed break of those levels could open the way for a deeper decline toward 1.12 and 1.11, where renewed bullish positioning may re-emerge.
- Written by Razan Hilal

EURUSD Bullish Flag continuation support at 1.1544EURUSD Bullish Flag continuation support at 1.1544
The EURUSD remains in a bullish trend, with recent price action showing signs of a corrective pullback within the broader uptrend.
Support Zone: 1.1544 – a key level from previous consolidation. Price is currently testing or approaching this level.
A bullish rebound from 1.1544 would confirm ongoing upside momentum, with potential targets at:
1.1714 – initial resistance
1.1795 – psychological and structural level
1.1890 – extended resistance on the longer-term chart
Bearish Scenario:
A confirmed break and daily close below 1.1544 would weaken the bullish outlook and suggest deeper downside risk toward:
1.1500 – minor support
1.1450 – stronger support and potential demand zone
Outlook:
Bullish bias remains intact while the EURUSD holds above 1.1544 A sustained break below this level could shift momentum to the downside in the short term.
This communication is for informational purposes only and should not be viewed as any form of recommendation as to a particular course of action or as investment advice. It is not intended as an offer or solicitation for the purchase or sale of any financial instrument or as an official confirmation of any transaction. Opinions, estimates and assumptions expressed herein are made as of the date of this communication and are subject to change without notice. This communication has been prepared based upon information, including market prices, data and other information, believed to be reliable; however, Trade Nation does not warrant its completeness or accuracy. All market prices and market data contained in or attached to this communication are indicative and subject to change without notice.

EURUSD Holds Steady Ahead of CPI DataAfter the payrolls revision shock, EURUSD appears to have stabilized between the 1.1600 and 1.1710 levels. This sideways movement may continue at least until the release of inflation data tomorrow.
The upcoming inflation report is expected to align with forecasts that see Core PCE rising above 3% by the end of this year, with a gradual monthly increase. However, a downside surprise could trigger a rally in stocks, cryptocurrencies, and EURUSD over the next few days.

SHORT EURUSDEntry is brought a bit lower to prevent being trapped in a false breakout. this triangular pattern is a wave 2 correction which should follow a sharp move downwards to fill the FVG-fair value gap on the daily timeframe at least

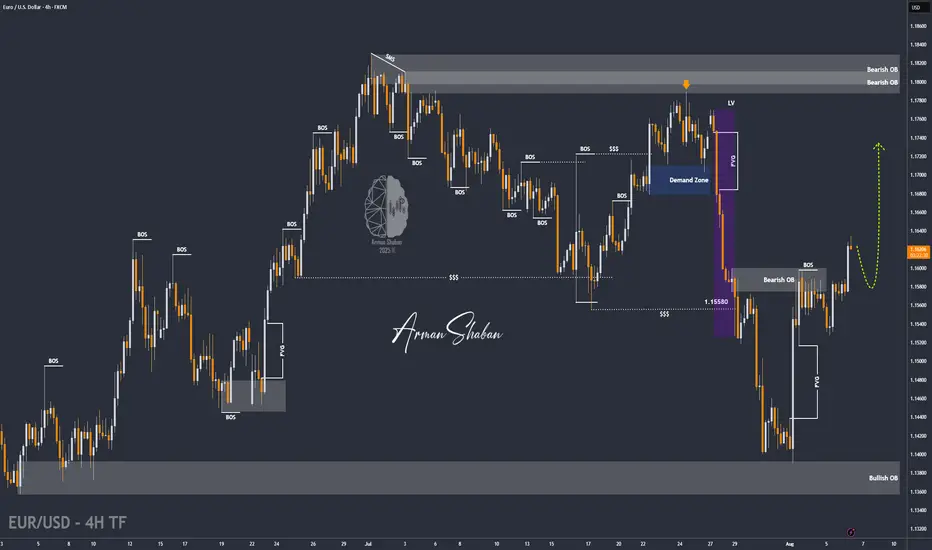
EURUSDMy Bias: cautiously bearish unless reclaimed.
Context: Price broke the daily structure (“day break”), retraced into a fair value gap and reacted.
Plan: I’ll wait for a clean LTF break of structure and displacement from that FVG before taking shorts on a pullback into fresh imbalance. If the FVG is reclaimed and we close back above it, I will reassess the bias. Be patient until next week’s session opens. NFA.

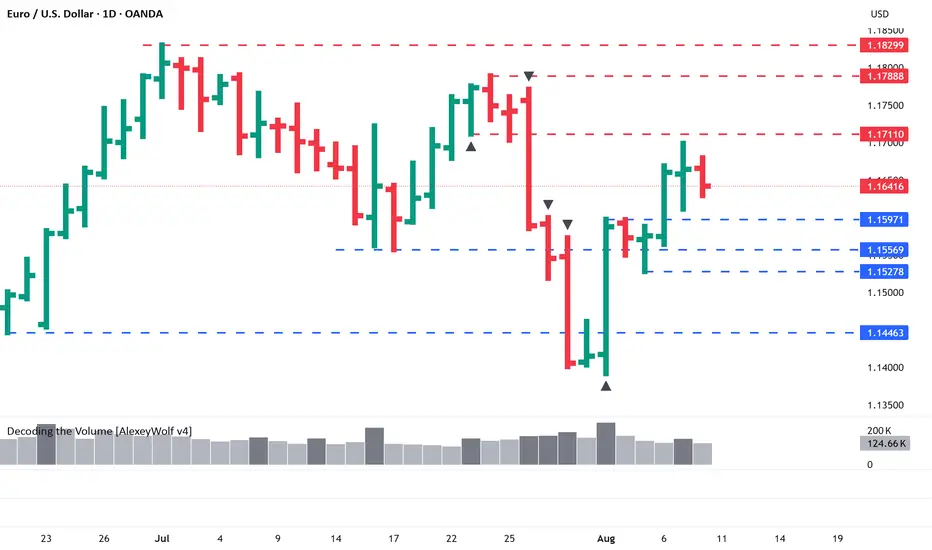
EURUSD - General dynamics and rangesCurrent technical status (Daily/Weekly)
After breaking through the key support at ~1.1445 and then rebounding, EUR/USD is moving up within a steady daily trend, confirmed by the formation of the morning star candlestick pattern, with the short-term target at 1.1800.
The monthly chart shows the development of an upward trend from the October 2025 closing level, with the target of raising prices to 1.1710, but a correction to 1.1588 — the 14.6% Fibonacci retracement level — is possible.
Short-term levels (H1–H4)
Support:
1.1500–1.1480 — the buy zone, from where a reversal has already occurred; the stop level should logically be placed below 1.1440.
Resistance:
1.1600–1.1680 — the near zone, then — 1.1700 and 1.1800 if growth continues.
General dynamics and ranges
The week from August 4 to 8 was characterized by a slowdown in growth, fluctuations in the range of 1.1390–1.1500. The MACD and Stochastic indicators reflect the sellers' momentum, but the oversold situation can provoke a local rebound — growth is possible only with a breakout of 1.1550.
The 1.1650 level is a historically significant barrier. It coincides with the 50% Fibonacci correction and a number of moving averages. Its breakout will open the way to the 1.1700–1.1750 zones. Otherwise, a rollback to 1.1580–1.1530–1.1500 is likely.

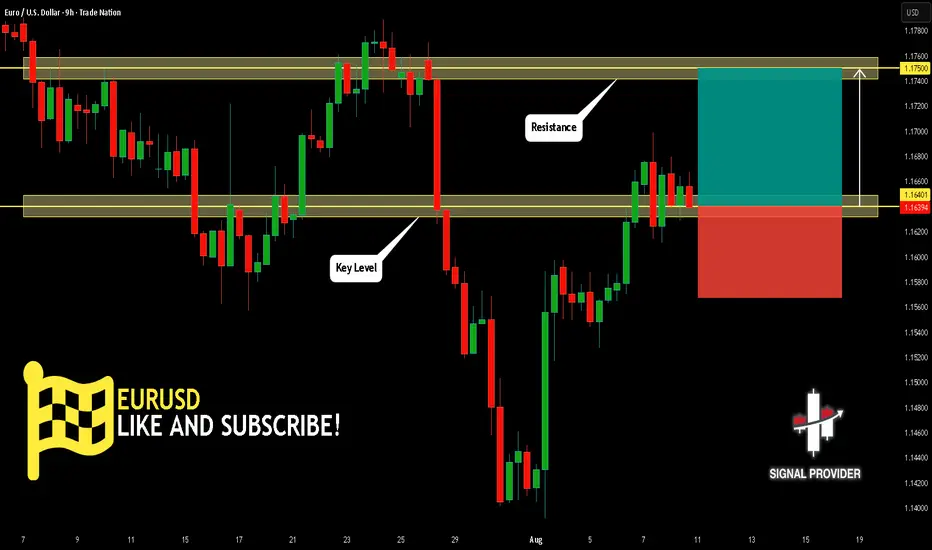
EURUSD Will Go Higher! Buy!
Please, check our technical outlook for EURUSD.
Time Frame: 9h
Current Trend: Bullish
Sentiment: Oversold (based on 7-period RSI)
Forecast: Bullish
The market is approaching a significant support area 1.164.
The underlined horizontal cluster clearly indicates a highly probable bullish movement with target 1.175 level.
P.S
Overbought describes a period of time where there has been a significant and consistent upward move in price over a period of time without much pullback.
Disclosure: I am part of Trade Nation's Influencer program and receive a monthly fee for using their TradingView charts in my analysis.
Like and subscribe and comment my ideas if you enjoy them!
Why the 95% failIt's no secret that over 90% of retail traders lose money. I am not talking about throwing some money into crypto and hoping for the moon type wins or losses. I mean actually trading and making a living from it.
You see, when you start, you are hungry for information - what's the best course, who has the best strategy, what if I trade 25 instruments on a 1-minute timeframe. Surely more profits...
After doing this for over 25 years, you get to see people come and go, sometimes they come back with a new idea and more funds to give the market.
But overall, some of the core problems are - all the gear and no idea.
Not only do people invest in screens, the latest hardware and of course the legendary Bloomberg subscription for 24/7 news.
What about indicators?
Has your screen ever looked a little bit like this?
The issue with more indicators is the majority of them lag to price action, re-paint or are simply not needed. Then combine that with the lack of experience, and you are left questioning do I buy or sell if my RSI is up but the moving average just crossed down?
You are not alone, most traders have been there if not all!
It is hard enough when even the brokers and exchanges fight against you - have you ever seen a scam wick directly to your stop and bounce?
What about the A-book vs the B-book?
In an A-book model, the broker passes their clients' trades directly to the market. Essentially, the broker acts as a middleman, executing trades on behalf of clients in the open market. This means that the broker's profits come primarily from commissions and spreads rather than trading against the client.
B-book, the broker takes the opposite side of the client's trades, essentially acting as the counterparty. Instead of sending trades to the open market, the broker keeps them internally.
The next one that always tickles me is the 100% win rate strategy that someone automated and for a few hundred dollars, it's all yours!!
Look, if there was a silver bullet, a 100% winning strategy you could buy off the shelf - we wouldn't have any other profession on the planet! The world's population would be professional traders. You know the saying " if it sounds too good to be true, it probably is".
You see Elliott waves where they have no right to be. Simply no logic or using them on a tick chart and hoping for miracles.
How about getting some financial advice from a spotty teen who rented a sports car for a video shoot this afternoon? Yeah, sounds like a good plan to help you retire young!
==============================
So, how to avoid all of these things?
Well, to start with, your tradingview chart, on a regular laptop or desktop with one screen, removing all the indicators and increasing the timeframe.
Then you reduce the number of pairs you look at and get to know them. Treat them like a new language. Learn the character traits, how they behave around major news events, what happens to them if the dollar goes up or oil drops 5%.
Don't treat trading like a game.
Instead, treat it like a business, use hours that suit your lifestyle. Deploy proper risk management. Don't see it as a one trade one win type concept. Treat it with respect and profit from it weekly.
You will find, when you learn to manage risk correctly, you care very little about markets going up or down. You tend to sleep with ease and a growing bank balance.
The market has plenty of soldiers fighting on its side, and it does its best to recruit you to fight against yourself!
In summary, less screens, less data inputs (indicators), less instruments, higher timeframes, ignore the influencers, Proper risk management and learn to understand there is no silver bullet.
Trading is statistics and that's all it is.
You can be very profitable with a low strike rate and a large risk-to-reward ratio. Or as simple as a 2% gain per 1% loss and a 50/50 win rate still makes you money!
Disclaimer
This idea does not constitute as financial advice. It is for educational purposes only, our principal trader has over 25 years' experience in stocks, ETF's, and Forex. Hence each trade setup might have different hold times, entry or exit conditions, and will vary from the post/idea shared here. You can use the information from this post to make your own trading plan for the instrument discussed. Trading carries a risk; a high percentage of retail traders lose money. Please keep this in mind when entering any trade. Stay safe.
EUR/USD Bullish Breakout SetupEUR/USD on the 1H chart is forming a descending wedge pattern near support. A breakout above resistance could push the price toward the 1.17500 target.

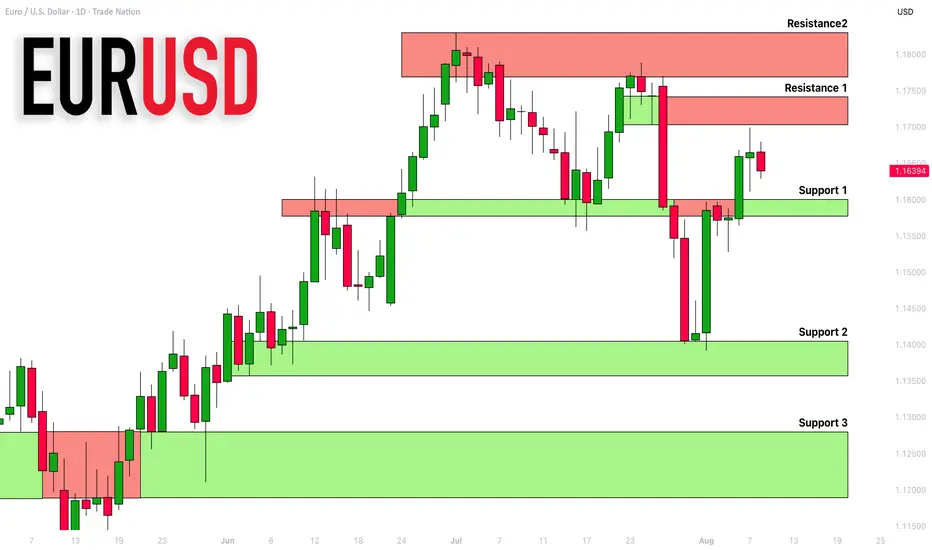
EURUSD: Support & Resistance Analysis For Next Week 🇪🇺🇺🇸
Here is my latest structure analysis and important supports & resistances
for EURUSD for next week.
Consider these structures for pullback/breakout trading.
❤️Please, support my work with like, thank you!❤️
I am part of Trade Nation's Influencer program and receive a monthly fee for using their TradingView charts in my analysis.
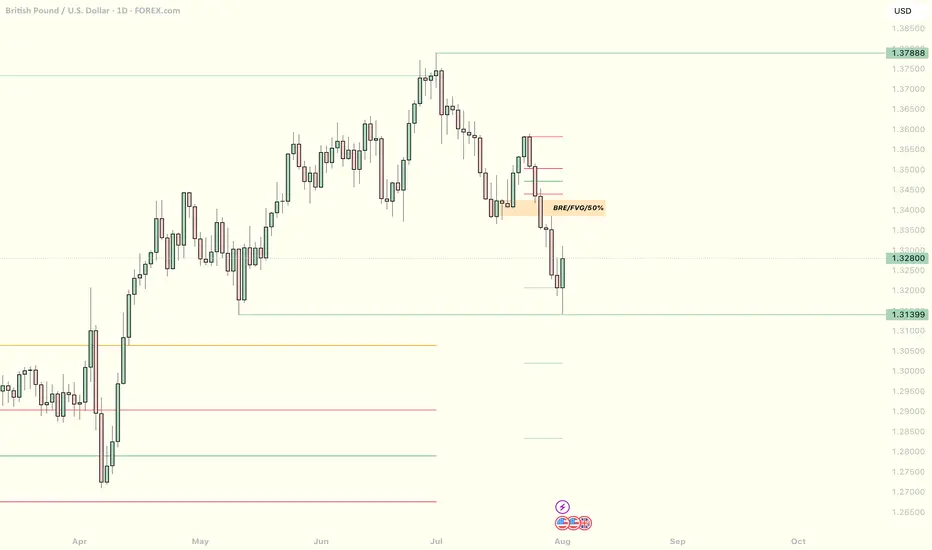
EURUSD. Daily AnalysisHi traders and investors!
This analysis is based on the Initiative Analysis concept (IA).
Buyers have broken through 1.15994 and 1.16108.
Buyer targets on the daily TF remain the same: 1.17110, 1.17888, 1.18299.
If a strong seller doesn’t emerge (spread/volume), look for buy setups at the blue levels: 1.15971, 1.15278.
Prefer scouting for patterns on the 1H, 2H, or 4H timeframes.
Wishing you profitable trades!
EURUSD: Are Sellers About To Take Control? CPI May Decide!Welcome back to the Weekly Forex Forecast for the week of Aug 11 - 15th.
In this video, we will analyze the following FX market:
EURUSD
The EURUSD saw a relatively small range of action Friday, forming an Inside Bar for the week. Although it closed bullishly, it did so in the middle of the range. With CPI Data coming Tuesday, it may be a holding pattern until the announcement.
Structure wise, the Daily TF shows a bearish shift in the market, with a retracement into a
-FVG. If the inefficiency holds, lower prices are coming for the near term. Wait for valid sell setups, especially after the news announcement.
Enjoy!
May profits be upon you.
Leave any questions or comments in the comment section.
I appreciate any feedback from my viewers!
Like and/or subscribe if you want more accurate analysis.
Thank you so much!
Disclaimer:
I do not provide personal investment advice and I am not a qualified licensed investment advisor.
All information found here, including any ideas, opinions, views, predictions, forecasts, commentaries, suggestions, expressed or implied herein, are for informational, entertainment or educational purposes only and should not be construed as personal investment advice. While the information provided is believed to be accurate, it may include errors or inaccuracies.
I will not and cannot be held liable for any actions you take as a result of anything you read here.
Conduct your own due diligence, or consult a licensed financial advisor or broker before making any and all investment decisions. Any investments, trades, speculations, or decisions made on the basis of any information found on this channel, expressed or implied herein, are committed at your own risk, financial or otherwise.

EURUSD Massive Long! BUY!
My dear followers,
This is my opinion on the EURUSD next move:
The asset is approaching an important pivot point 1.1639
Bias - Bullish
Safe Stop Loss - 1.1629
Technical Indicators: Supper Trend generates a clear long signal while Pivot Point HL is currently determining the overall Bullish trend of the market.
Goal - 1.1655
About Used Indicators:
For more efficient signals, super-trend is used in combination with other indicators like Pivot Points.
Disclosure: I am part of Trade Nation's Influencer program and receive a monthly fee for using their TradingView charts in my analysis.
———————————
WISH YOU ALL LUCK
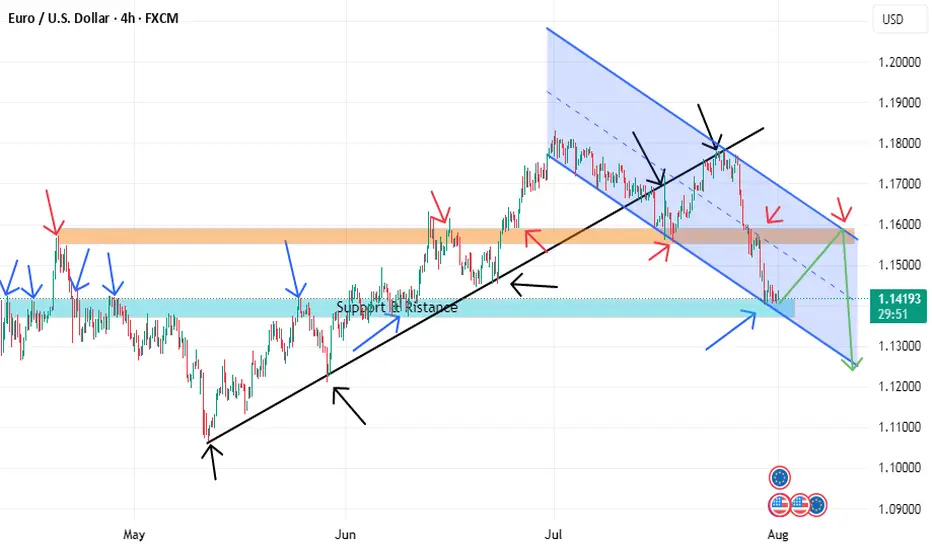
EURUSD BUYING CORRECTION AND SHORTThe price is now at a strong support level and if it can be a double bottom it will retest the descending channel line and reach the orange resistance, but in the general direction the price prefers to fall due to breaking the black uptrend line. We also have a more beautiful scenario, which is if it can break the strong support we will go with the downward trend.
EURUSD My Opinion! SELL!
My dear subscribers,
My technical analysis for EURUSD is below:
The price is coiling around a solid key level - 1.1668
Bias - Bearish
Technical Indicators: Pivot Points Low anticipates a potential price reversal.
Super trend shows a clear sell, giving a perfect indicators' convergence.
Goal - 1.1588
About Used Indicators:
By the very nature of the supertrend indicator, it offers firm support and resistance levels for traders to enter and exit trades. Additionally, it also provides signals for setting stop losses
Disclosure: I am part of Trade Nation's Influencer program and receive a monthly fee for using their TradingView charts in my analysis.
———————————
WISH YOU ALL LUCK