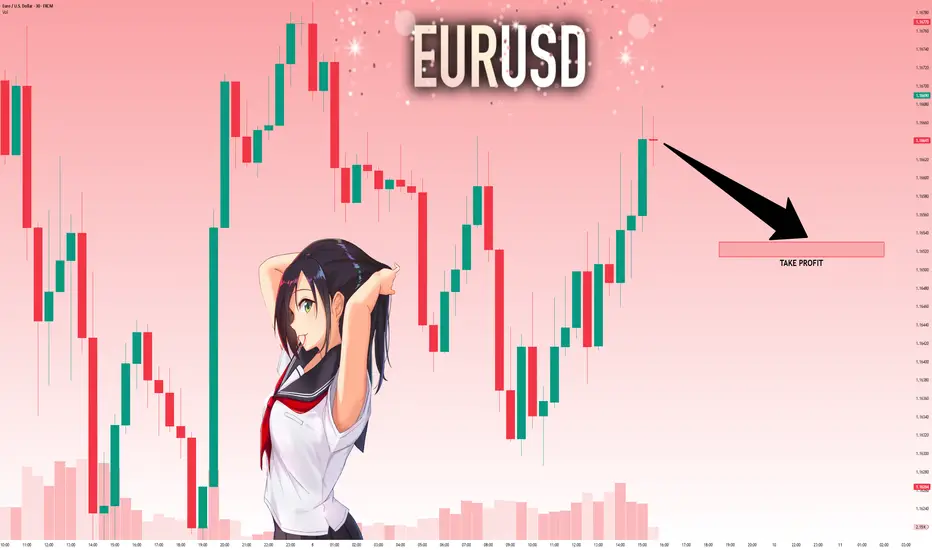
EURUSD: Market of Sellers
The price of EURUSD will most likely collapse soon enough, due to the supply beginning to exceed demand which we can see by looking at the chart of the pair.
Disclosure: I am part of Trade Nation's Influencer program and receive a monthly fee for using their TradingView charts in my analysis.
❤️ Please, support our work with like & comment! ❤️
Eurusd-3

EURUSD: Local Bearish Bias! Short!
My dear friends,
Today we will analyse EURUSD together☺️
The recent price action suggests a shift in mid-term momentum. A break below the current local range around 1.16638 will confirm the new direction downwards with the target being the next key level of 1.16530 and a reconvened placement of a stop-loss beyond the range.
❤️Sending you lots of Love and Hugs❤️
EURUSDHello Traders! 👋
What are your thoughts on EURUSD?
EUR/USD is trading below a key resistance area and has recently completed a pullback to the broken trendline.
As long as the pair remains under this resistance, we expect some short-term consolidation, followed by a renewed bearish move toward lower levels.
The bearish outlook remains valid while price stays below the resistance zone.
A clean break above this level would invalidate the bearish scenario.
Will EUR/USD resume its decline, or break through resistance? Share your view below! 👇
Don’t forget to like and share your thoughts in the comments! ❤️

EUR/USD Breaking Point! ALERT Price action is coiling up in a tight triangle and a breakout is imminent! See how the ABCDE pattern on the chart is setting up for a potential explosive move. Will EUR/USD surge higher or drop to key support?
I've mapped out BOTH scenarios with clear technical targets—don’t miss your chance to catch the next big wave!
💡 Tap "Boost" if you found this analysis helpful.
📈 Follow my page for daily actionable trading setups!
👇 Drop your predictions in the comments below—are you bullish or bearish on EUR/USD this week?
Let’s win together!

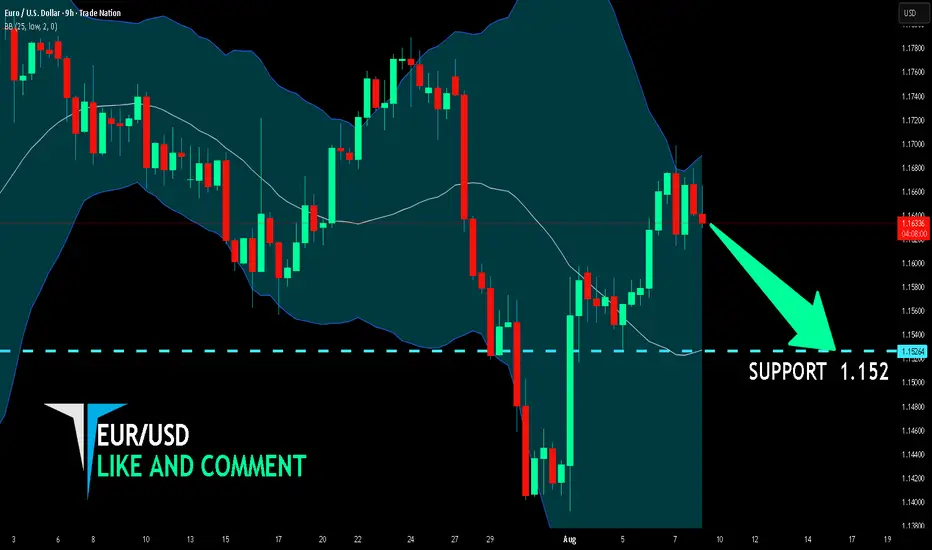
EUR/USD SELLERS WILL DOMINATE THE MARKET|SHORT
Hello, Friends!
Previous week’s green candle means that for us the EUR/USD pair is in the uptrend. And the current movement leg was also up but the resistance line will be hit soon and upper BB band proximity will signal an overbought condition so we will go for a counter-trend short trade with the target being at 1.152.
Disclosure: I am part of Trade Nation's Influencer program and receive a monthly fee for using their TradingView charts in my analysis.
✅LIKE AND COMMENT MY IDEAS✅
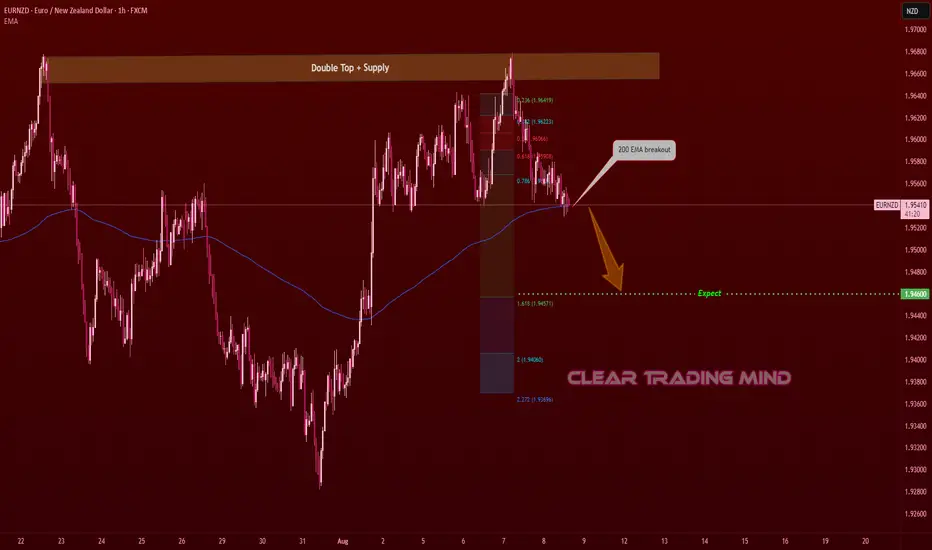
EURNZD – Double Top + 200 EMA Break… Is the Fall Coming?I think this pair has more chance to go down because a clear Double Top pattern has been formed exactly at a supply zone. After that, price has broken below the 200 EMA, showing weakness in the recent bullish move.
From here, I’m looking at the possibility of a bearish continuation. My expectation is for price to drop towards the 1.94600 area, which aligns with the Fibonacci extension target.
This is just my personal view based on the pattern and 200 EMA break — let’s see how the market reacts in the coming sessions.
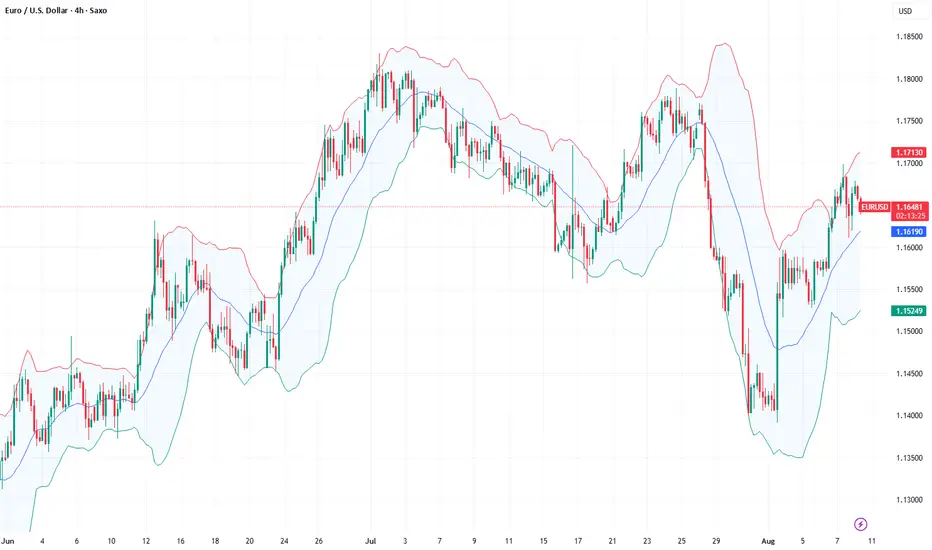
EURUSD stops at the SMA200, ready to pullback.EURUSD stops at the SMA200, ready to pullback.
The pair has been forming the bearish wedge since the April 2025 till July 2025. At the end of July the lower border of the pattern got broken and the price has rapidly reached the 1.14000 support level. Then the rebound from this level occurred and currently the price is retesting the lower border of the wedge from below. Additionally, the SMA200 is situated just above the current price, which is a fair argument for the price to pullback in the nearest future. The price is expected to decline with a first target of 1.14000.

EURUSD – DAILY FORECAST Q3 | W32 | D8 | Y25📊 EURUSD – DAILY FORECAST
Q3 | W32 | D8 | Y25
Daily Forecast 🔍📅
Here’s a short diagnosis of the current chart setup 🧠📈
Higher time frame order blocks have been identified — these are our patient points of interest 🎯🧭.
It’s crucial to wait for a confirmed break of structure 🧱✅ before forming a directional bias.
This keeps us disciplined and aligned with what price action is truly telling us.
📈 Risk Management Protocols
🔑 Core principles:
Max 1% risk per trade
Only execute at pre-identified levels
Use alerts, not emotion
Stick to your RR plan — minimum 1:2
🧠 You’re not paid for how many trades you take, you’re paid for how well you manage risk.
🧠 Weekly FRGNT Insight
"Trade what the market gives, not what your ego wants."
Stay mechanical. Stay focused. Let the probabilities work.
FX:EURUSD

Fundamental Market Analysis for August 8, 2025 EURUSDThe EUR/USD exchange rate remains stable after rising during the previous three sessions, trading at around 1.1660 during Asian trading hours on Friday. The pair may regain its positions as the US dollar (USD) may struggle as markets assess the probability of a 25 basis point (bp) rate cut at the September meeting at nearly 93%, compared to 48% a week ago.
Expectations for a Fed rate cut in September have intensified as the number of new applications for unemployment benefits in the US increased after the US nonfarm payrolls (NFP) report for July pointed to a cooling labor market.
Data on initial jobless claims in the US showed that the number of US citizens filing new claims for unemployment benefits rose to 226,000 for the week ending August 2. This figure exceeded the market consensus forecast of 221,000 and was higher than the previous week's figure of 218,000.
The probability that the central bank will leave rates unchanged is approximately 87%. Markets estimate the probability of another ECB rate cut before March 2026 at only 60%.
Trade recommendation: BUY 1.1660, SL 1.1625, TP 1.1710
EUR/USD Holds Steady Ahead of US DataHello everyone, what are your thoughts on FX:EURUSD ?
Today, the pair is trading in a narrow range around 1.1650 on Friday. While the US dollar is struggling to regain strength, a slight pullback in EUR/GBP following the Bank of England’s policy announcement has limited the upside for EUR/USD. The market now awaits upcoming US economic data.
From a technical perspective, EUR/USD remains anchored above newly established support levels. If these levels hold, this pullback could be an excellent accumulation phase before a breakout move.
What do you think? How will EUR/USD move by the end of the session and in the coming days?
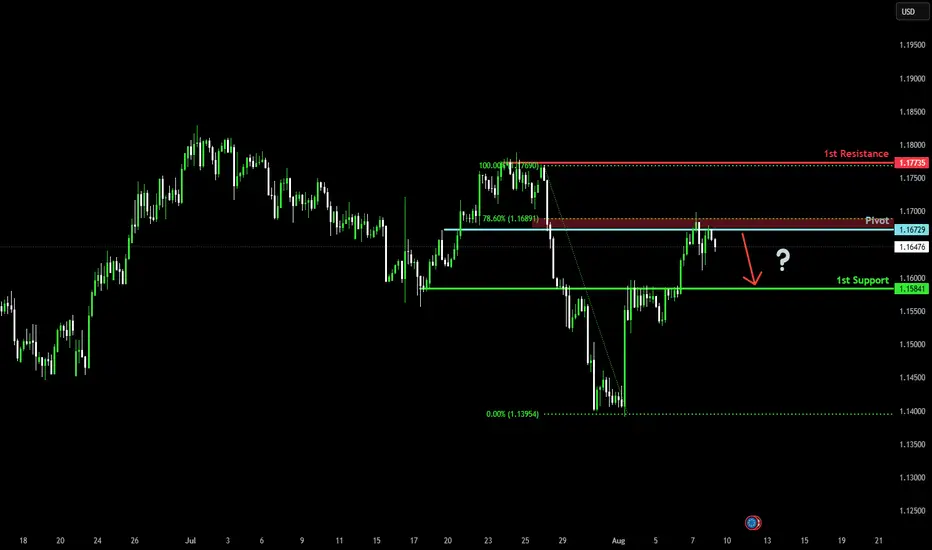
Potential bearish drop?The Fiber (EUR/USD) has rejected off the pivot which acts as a pullback resistance that is slightly below the 78.6% Fibonacci retracement and could drop to the 1st support.
Pivot: 1.1672
1st Support: 1.1584
1st Resistance: 1.1773
Risk Warning:
Trading Forex and CFDs carries a high level of risk to your capital and you should only trade with money you can afford to lose. Trading Forex and CFDs may not be suitable for all investors, so please ensure that you fully understand the risks involved and seek independent advice if necessary.
Disclaimer:
The above opinions given constitute general market commentary, and do not constitute the opinion or advice of IC Markets or any form of personal or investment advice.
Any opinions, news, research, analyses, prices, other information, or links to third-party sites contained on this website are provided on an "as-is" basis, are intended only to be informative, is not an advice nor a recommendation, nor research, or a record of our trading prices, or an offer of, or solicitation for a transaction in any financial instrument and thus should not be treated as such. The information provided does not involve any specific investment objectives, financial situation and needs of any specific person who may receive it. Please be aware, that past performance is not a reliable indicator of future performance and/or results. Past Performance or Forward-looking scenarios based upon the reasonable beliefs of the third-party provider are not a guarantee of future performance. Actual results may differ materially from those anticipated in forward-looking or past performance statements. IC Markets makes no representation or warranty and assumes no liability as to the accuracy or completeness of the information provided, nor any loss arising from any investment based on a recommendation, forecast or any information supplied by any third-party.
EURUSD SELL SETUP SHOOOOOOOOORTWHAT'S YOUR OPINION ?
EURUSD formed ascending pattern on time frame Daily
and it break uptrend line and do retest on it
so we should research selling opportunities

GBPUSD SELL SETUP ROOOOCK SHOOOOOOOOOOOOORTGBPUSD in descending channel and it on strong resistance zone
and momentum started to weak
and can't make higher high
so shortly I will sell but after confirmation
and sure from this photo

USD Set To bounce? EUR/USD, USD/JPY, USD/CHFIt has been a week since the US dollar plunged following a weak NFP report. Given it has consolidated within a tight range near last week's low, alongside price action clues on EUR/USD, USD/JPY and USD/CHF, I suspect the dollar could bounce before its losses resume.
Matt Simpson, Market Analyst at City Index and Forex.com

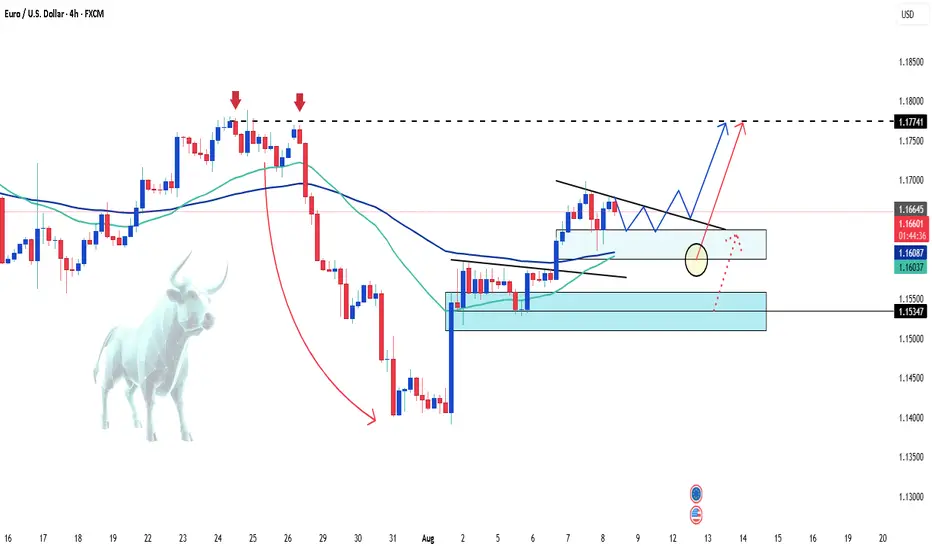
EURUSD Short-Term Bullish Momentum - Buy ? Hello everyone, what do you think about EURUSD?
Yesterday, we discussed the sideways movement of this pair, and now, it seems that EUR/USD is showing a short-term bullish trend. The price is currently moving around 1.165, as marked on the chart.
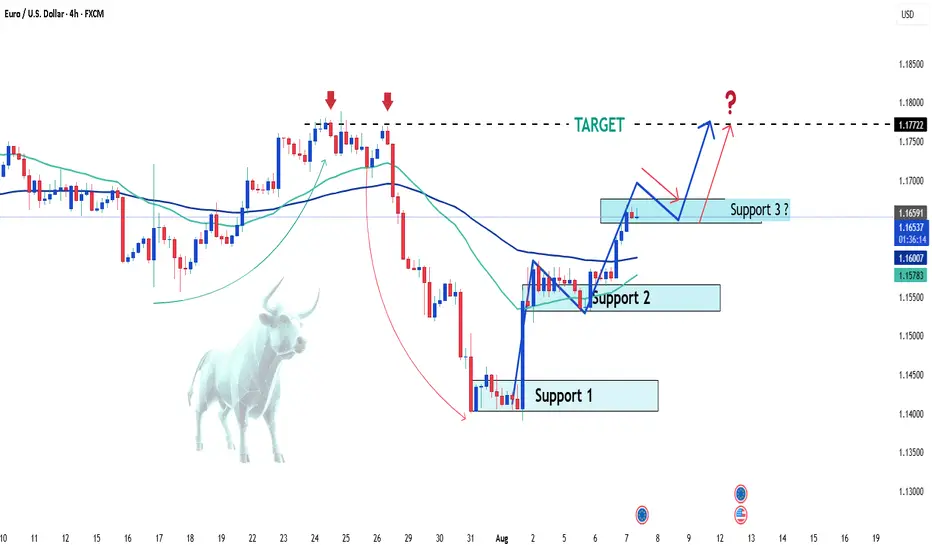
In the short term, the market appears ready for further upward movement. With support at multiple levels (Support 1 and Support 2), and the possibility of forming a Support 3 to reach the target of 1.177, the overall outlook remains optimistic.
Keep an eye on how the market reacts at these important levels! Don’t forget to like if you agree with my view!
Good luck!
EURUSD | Eyes on the 50EMA — One Bold Candle and I’m All InThe 1-hour chart has carved a beautiful bullish range from 1.1565 to 1.1696. A little 15-minute pullback tried to test our love, but I’ve got all the signs — the retracement is over, and the ride is calling again.
WHAT TO DO
Just one confident Marubozu closing above the 50EMA, and I’m jumping in — no hesitation, no second thoughts. Let’s ride this story back to the top.
TP1: 1.1696 (where the heart first skipped)
TP2: 1.1716 (where dreams begin)
SL: If that candle speaks loud and clear, my stop loss will be just below it — because love deserves a little risk, but never recklessness.
WHAT IF IT WONT CROSS?
This is day trading setup. While watching 15m candle to bear below 50EMA also I glance 1hr chart. This setup will be valid as long as 1hr chart is still in bearing range.
Wish me luck — this might just be the ride of the day! 💞📈

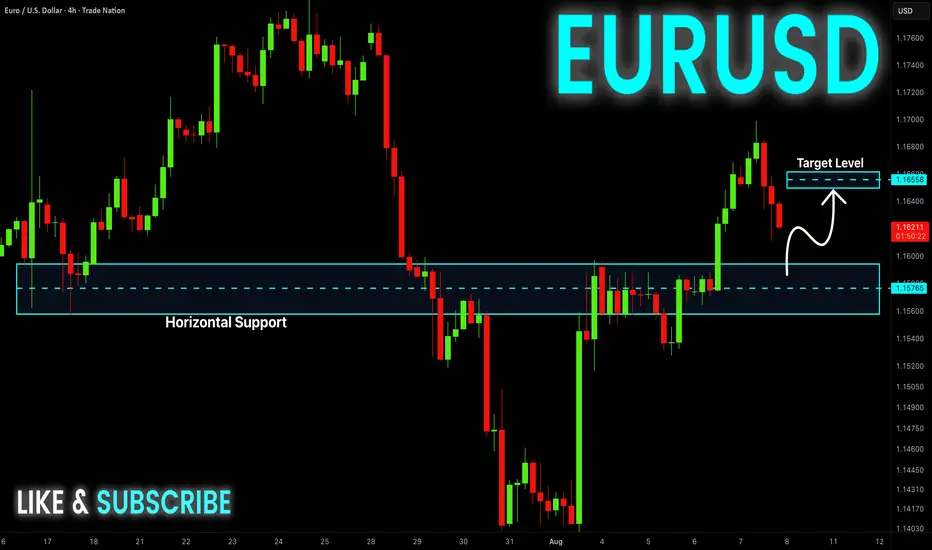
EUR-USD Support Ahead! Buy!
Hello,Traders!
EUR-USD is making a local
Bearish correction but
We are bullish biased mid-term
So after the pair hits the horizontal
Support of 1.1577 we will be
Expecting a local bullish rebound
Buy!
Comment and subscribe to help us grow!
Check out other forecasts below too!
Disclosure: I am part of Trade Nation's Influencer program and receive a monthly fee for using their TradingView charts in my analysis.
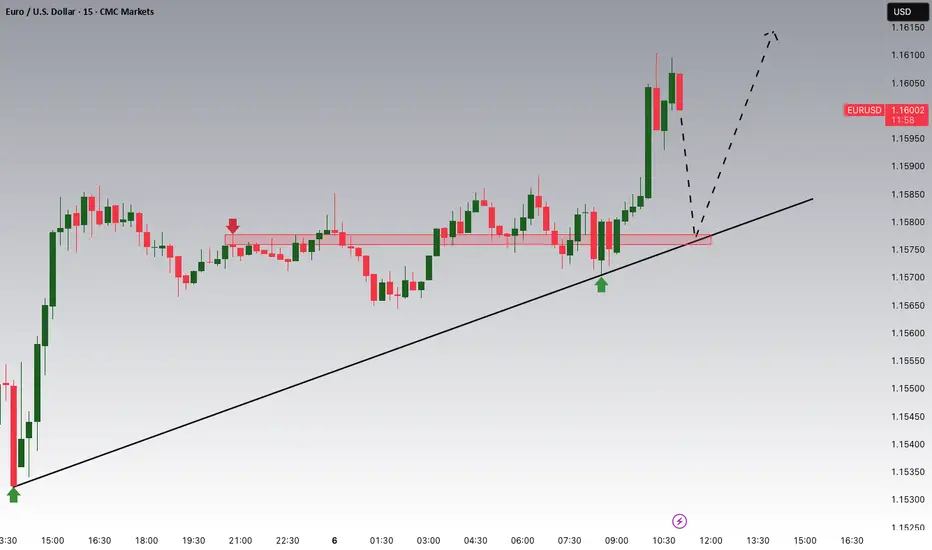
EURUSD Potential UpsidesHey Traders, in today's trading session we are monitoring EURUSD fora buying opportunity around 1.15800 zone, EURUSD is trading in an uptrend and currently is in a correction phase in which it is approaching the trend at 1.15800 support and resistance area.
Trade safe, Joe.
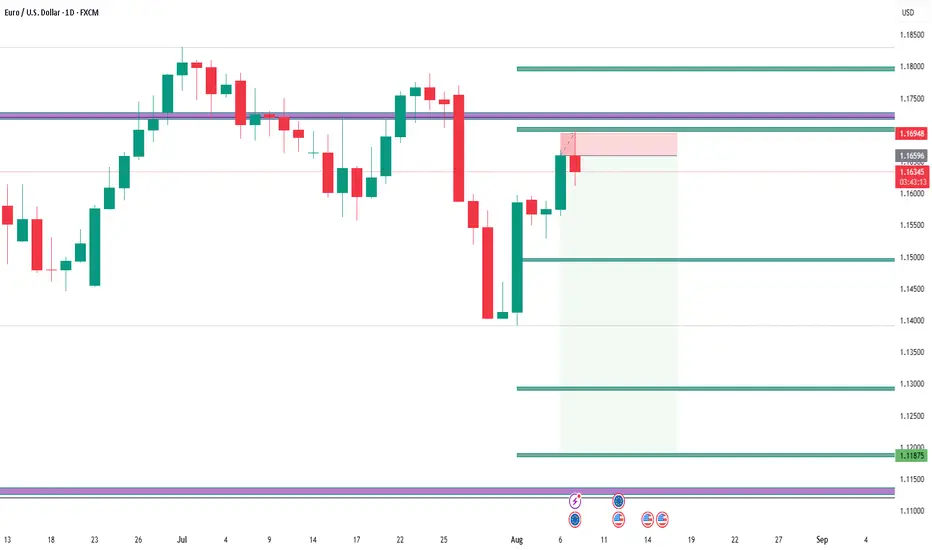
EUR/USD – Day 12 of 100 Days Analysis
We’re closely watching price action around the 1.16164 demand zone. If price holds above this range and breaks 1.16472, we may see a bullish continuation up to 1.17060.
🔍 Smart Money Perspective:
Price may dip below the minor low to sweep liquidity
Retest around 1.16472 can offer a long opportunity
Target Zones:
🟢 TP1 – 1.16722
🟢 TP2 – 1.17060
⚠️ Risk Zone:
Below 1.16164, invalidation for longs. Break of 1.15981 = bearish shift.
📆 Recorded on: August 7, 2025
📍 Session: New York
💥 Watch this level-by-level roadmap unfold and stay consistent through 100 days of EUR/USD analysis!
👇 Comment your bias – Bullish or Bearish?
#forexsignals #eurusdanalysis #tradingview #priceactiontrader #forexchart #technicalanalysis #traderlifestyle #nyopen #smcforex #forexjourney

EURUSD: Will Go Up! Long!
My dear friends,
Today we will analyse EURUSD together☺️
The market is at an inflection zone and price has now reached an area around 1.16337 where previous reversals or breakouts have occurred.And a price reaction that we are seeing on multiple timeframes here could signal the next move up so we can enter on confirmation, and target the next key level of 1.16551.Stop-loss is recommended beyond the inflection zone.
❤️Sending you lots of Love and Hugs❤️
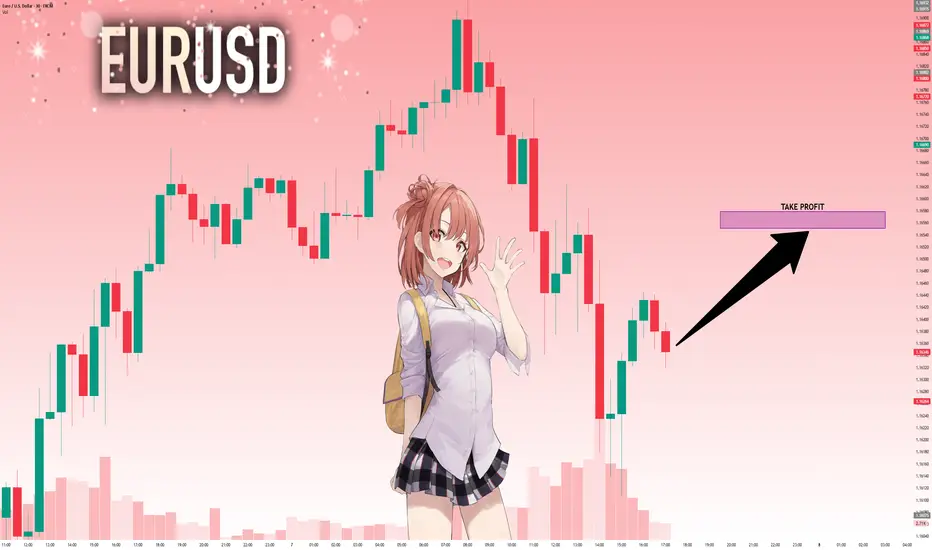
SWING TRADE IN EURUSD SWING Trade in EURUSD.📉🔻
Swing opportunity is forming in EURO to Short
Follow for more swing analysis on Indices, Commodities
Dr. Iqra Shah
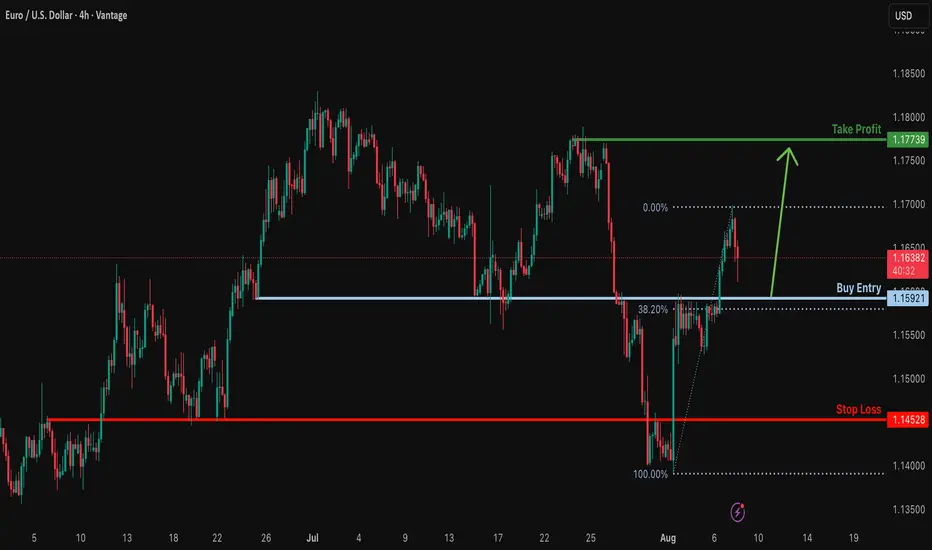
Bullish bounce off overlap support?EUR/USD is falling towards the support level which is an overlap support that aligns with the 38.2% Fibonacci retracement and could bounce from this level to our take profit.
Entry: 1.1592
Why we like it:
There is an overlap support level that lines up with the 38.2% Fibonacci retracement.
Stop loss: 1.1452
Why we like it:
There is a pullback support level that aligns with the 50% Fibonacci retracement.
Take profit: 1.1773
Why we llike it:
There is a swing high resistance.
Enjoying your TradingView experience? Review us!
Please be advised that the information presented on TradingView is provided to Vantage (‘Vantage Global Limited’, ‘we’) by a third-party provider (‘Everest Fortune Group’). Please be reminded that you are solely responsible for the trading decisions on your account. There is a very high degree of risk involved in trading. Any information and/or content is intended entirely for research, educational and informational purposes only and does not constitute investment or consultation advice or investment strategy. The information is not tailored to the investment needs of any specific person and therefore does not involve a consideration of any of the investment objectives, financial situation or needs of any viewer that may receive it. Kindly also note that past performance is not a reliable indicator of future results. Actual results may differ materially from those anticipated in forward-looking or past performance statements. We assume no liability as to the accuracy or completeness of any of the information and/or content provided herein and the Company cannot be held responsible for any omission, mistake nor for any loss or damage including without limitation to any loss of profit which may arise from reliance on any information supplied by Everest Fortune Group.
EURUSD; Heikin Ashi Trade Idea📈 Hey Traders!
Here’s a fresh outlook from my trading desk. If you’ve been following me for a while, you already know my approach:
🧩 I trade Supply & Demand zones using Heikin Ashi chart on the 4H timeframe.
🧠 I keep it mechanical and clean — no messy charts, no guessing games.
❌ No trendlines, no fixed sessions, no patterns, no indicator overload.
❌ No overanalyzing market structure or imbalances.
❌ No scalping, and no need to be glued to the screen.
✅ I trade exclusively with limit orders, so it’s more of a set-and-forget style.
✅ This means more freedom, less screen time, and a focus on quality setups.
✅ Just a simplified, structured plan and a calm mindset.
💬 Let’s Talk:
💡Do you trade supply & demand too ?
💡What’s your go-to timeframe ?
💡Ever tried Heikin Ashi ?
📩 Got questions about my strategy or setup? Drop them below — ask me anything, I’m here to share.
Let’s grow together and keep it simple. 👊
