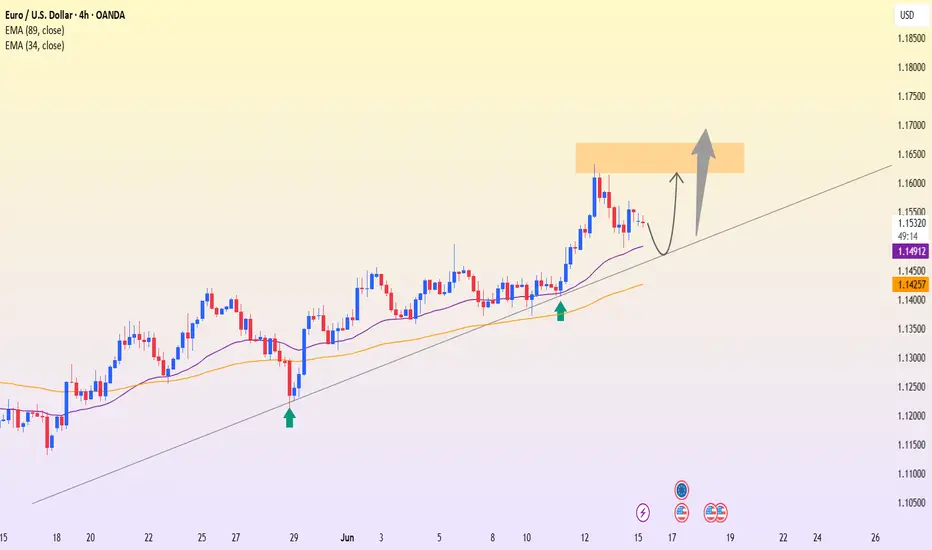
Trading balanceTrading balance The price of the asset has rebounded from the balance zone. With the prospect of growth into the resistance zone.
Eurusd-3
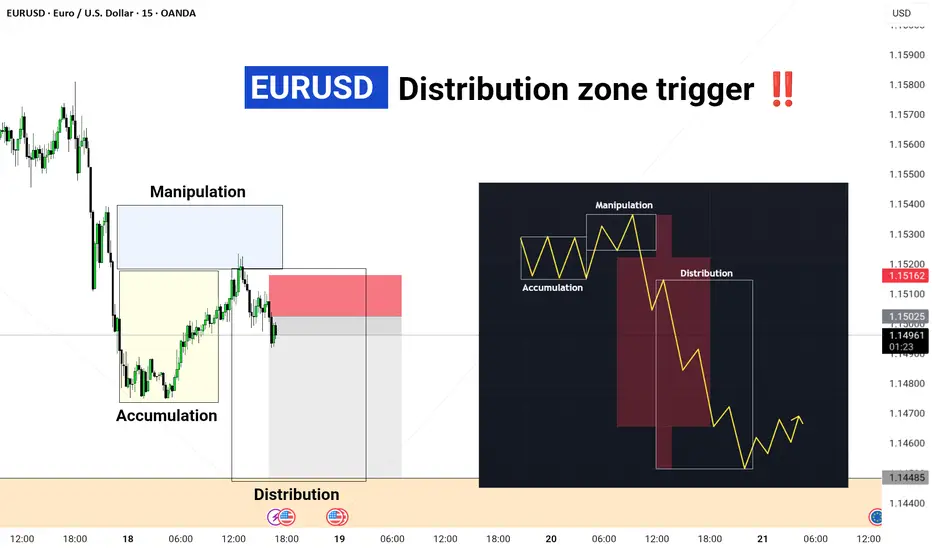
Distribution Zone Triggered⏰ Timeframe: 15-Minute (M15)
💱 Pair: EUR/USD
📍 Event: Distribution Zone Triggered ‼️
🔍 Market Structure Breakdown: 1️⃣ Accumulation Phase 🟨
📌 Smart money builds long positions
📌 Stops hunted below support
2️⃣ Manipulation Phase 🟦
📌 Liquidity grab above resistance
📌 Trap set for retail buyers
3️⃣ Distribution Phase 🟥
📌 Entry for institutional sellers
📌 Shift in order flow to bearish bias
📊 What’s next?
🔻 Price likely heading to lower demand zones
🔄 Expecting continuation move post-distribution
🧠 Powered by Smart Money Concepts + Wyckoff Logic
🎯 Trader's Tip: Always wait for confirmation inside distribution to avoid false entries!
#EURUSD #DistributionZone #SmartMoney #WyckoffLogic #LiquidityGrab #SMCTrading
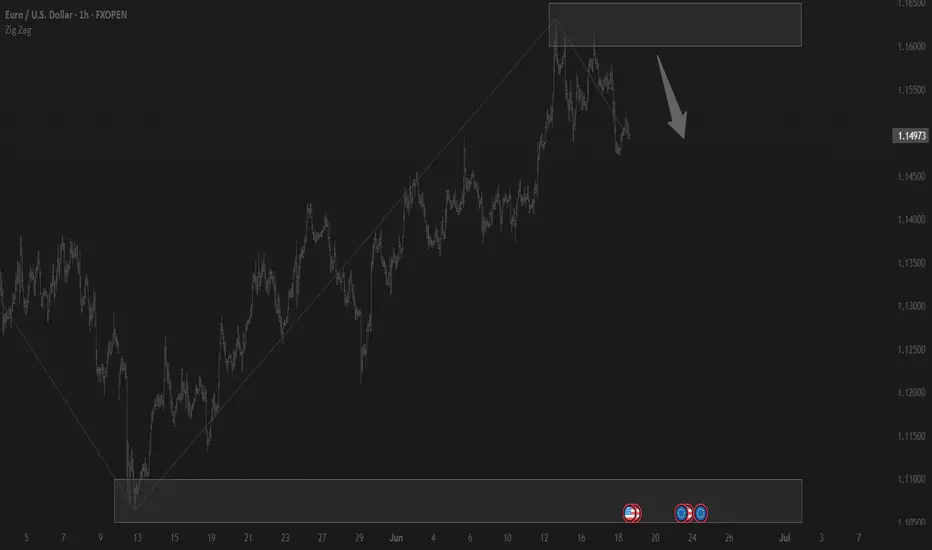
EURUSD Bearish move ideaEURUSD is at a reversal point were orders are being collected and the execution an timing of this trade idea must still be taken into consideration. I am expecting a move to the downside in the next couple of weeks.
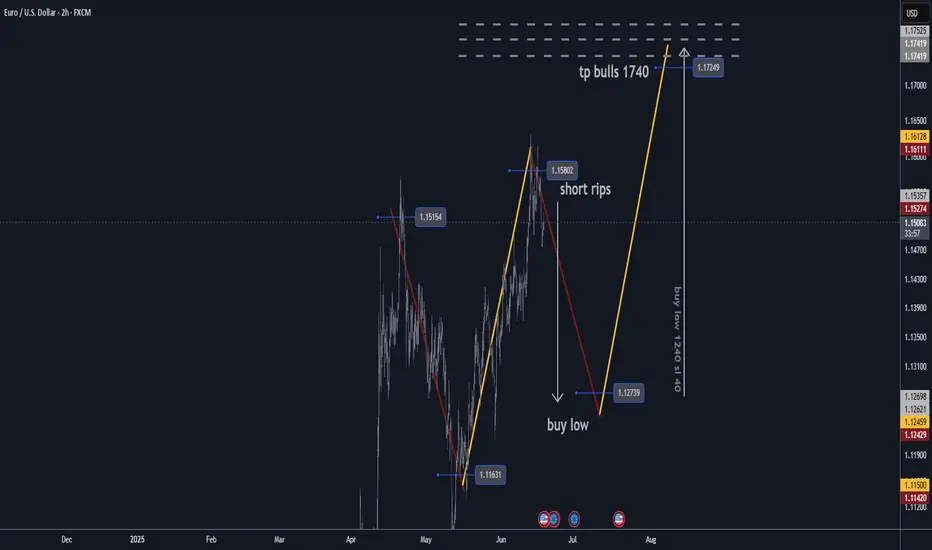
EURUSD H2 Best Levels to BUY/SELL and Market Update🏆 EURUSD Market Update m20 short-term trade
📊 Technical Outlook
🔸Short-term: BEARS 1275
🔸1500/1540 short sell rips/rallies
🔸Mid-Term outlook: BULLS 1750
🔸bulls buy low 1250/1275 reload
🔸bulls exit at 1750 swing trade
🔸Price Target Bears: 1250/1275
🔸Price Target Bulls: 1750
🌍 Macro & Political Drivers
U.S. tax & spending concerns: The Congressional Budget Office now projects President Trump's tax‑and‑spending bill will raise deficits by about $2.8 trillion over the next decade. This massive debt addition is pressuring the U.S. dollar, as rising Treasury issuance and weaker fiscal confidence weigh on demand.
Geopolitical tensions: Escalation in the Israel–Iran conflict is pushing investors toward the safe-haven U.S. dollar. The DXY jumped to around 98.80 as President Trump’s remarks on Iran sent the EUR/USD down to approximately 1.1484.
EU developments: ECB officials, including Christine Lagarde, are doubling down on strengthening Europe’s financial infrastructure to elevate the euro as a viable alternative to the dollar — calling this a “global euro moment.”
Key resistance is around 1.1550–1.1575; downside support zones near 1.1450 and broader range 1.1360–1.1420 remain intact, though current levels suggest consolidation above the lower range. Strength from safe-haven flows could stall upward momentum.
📊 ECB Policy & Inflation Signals
The ECB cut rates by 25 bp last week to 2.0%, reinforcing the message that inflation remains subdued (1.9% in May) and prompting a data-driven, meeting-by-meeting decision approach.
ECB speakers stress “agile pragmatism” given global uncertainties, citing the euro’s ~10% rally year-to-date but cautioning amid rising oil prices and geopolitical risks.
⚡ What to Watch Next
Catalyst Outlook
U.S. yields & bond auctions More issuance tied to tax plans could steepen the curve and support the USD.
Middle East headlines Escalation may continue to offer dollar safe-haven benefits, pressuring EUR/USD.
EU economic data Inflation softness (e.g., France) could weaken ECB’s stance, re-pressuring the euro.
Technical levels Watch 1.1450 support—holds for possible rebound; resistance 1.1550–1.1575 for upside pressure.
✅ Summary
Current: EUR/USD around 1.1484, with bearish tilt amid risk aversion.
Bull case: Ongoing U.S. fiscal weakness, delayed tariffs, and ECB support for euro could cap downside.
Bear case: Safe-haven demand from geopolitical tensions, Fed‑ECB divergence, and technical breakdown through 1.1450 could push toward 1.1360.
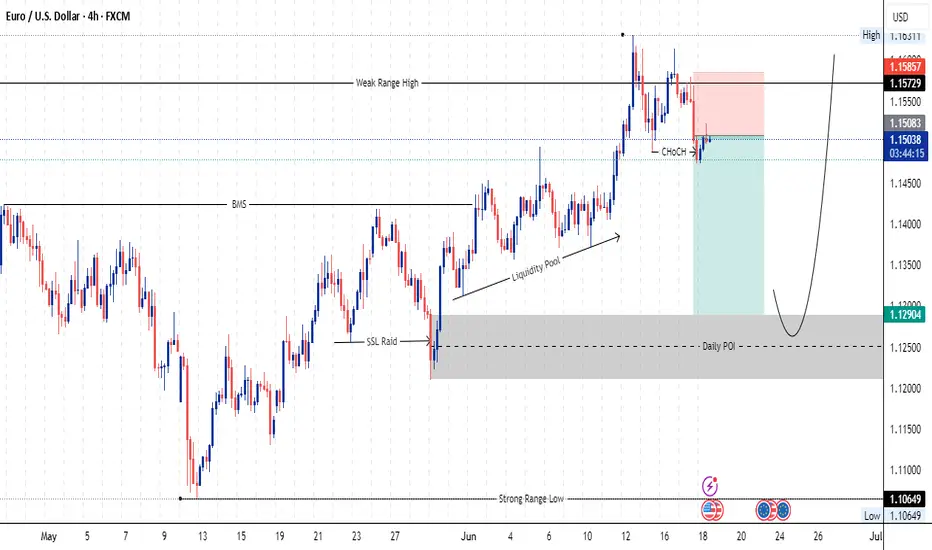
This is my views on EURUSD so far.I have not yet taken a single position on this pair because price has not yet met my execution requirements. Overall views on the pair are short term bullish to the Weekly/Monthly POI's then I will be looking for a long term bearish structure.
EUR/USD Pressured by Safe-Haven Dollar DemandEUR/USD traded near 1.15 on Wednesday, under pressure from safe-haven demand for the U.S. dollar as Middle East tensions escalated. Fears of broader conflict involving the U.S. kept the dollar firm. Markets await the Federal Reserve’s policy decision, with rates expected to stay unchanged, though guidance may shape future expectations. The euro remained weak, burdened by Europe’s energy import exposure amid rising oil prices.
Resistance is located at 1.1580, while support is seen at 1.1460.
Fundamental Market Analysis for June 18, 2025 EURUSDEvent to pay attention to today:
12:00 EET. EUR - Consumer Price Index
15:30 EET. USD - Unemployment Claims
21:00 EET. USD - FOMC Rate Decision
Declining confidence in the US economy amid trade policy is undermining the US Dollar (USD) against the Euro (EUR). Data released by the US Census Bureau on Tuesday showed that US retail sales fell 0.9% m/m in May, compared to a 0.1% decline (revised from +0.1%) recorded in April. The figure was weaker than estimates of -0.7%. Meanwhile, US industrial production in May declined 0.2% m/m vs. 0.1% previously (revised from 0%), worse than expectations of 0.1%.
Traders expect the US Federal Reserve to leave borrowing costs unchanged at its June meeting on Wednesday. Markets now estimate a nearly 80% chance that the Fed will cut rates in September and then another in October, according to Reuters.
The mood of European Central Bank (ECB) policymakers is supportive of the common currency. ECB President Christine Lagarde said that rate cuts are coming to an end as the central bank is now in a “good position” to deal with the current uncertainty.
Meanwhile, investors will keep an eye on geopolitical risks. Israel is set to step up strikes on Tehran, while the US is considering expanding its role amid rising tensions between Israel and Iran.
Trade recommendation: SELL 1.1460, SL 1.1560, TP 1.1260
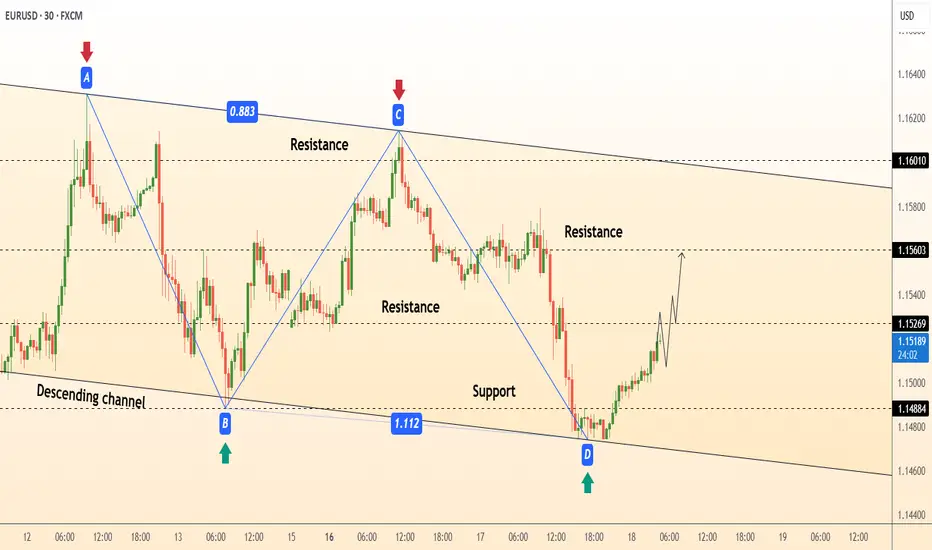
DeGRAM | EURUSD rebound from the lower boundary of the channel📊 Technical Analysis
● A completed AB=CD (0.883 / 1.112) pattern at the channel floor (1.1488) produced a hammer, signalling exhaustion of bears at the measured PRZ.
● Price is now reclaiming the micro structure high 1.1526; that flips the inner range to support and opens the next intra-channel pivot 1.1560, with room to the upper wall near 1.1600.
💡 Fundamental Analysis
● EZ May trade balance swung back to a €4 bn surplus while weak US housing starts shaved another 4 bp off 2-yr yields, compressing the short-rate gap and underpinning EUR bids.
✨ Summary
Buy 1.1500-1.1530; break >1.1560 targets 1.1600, stretch 1.1650. Bull bias void on 30 min close below 1.1480.
-------------------
Share your opinion in the comments and support the idea with like. Thanks for your support!
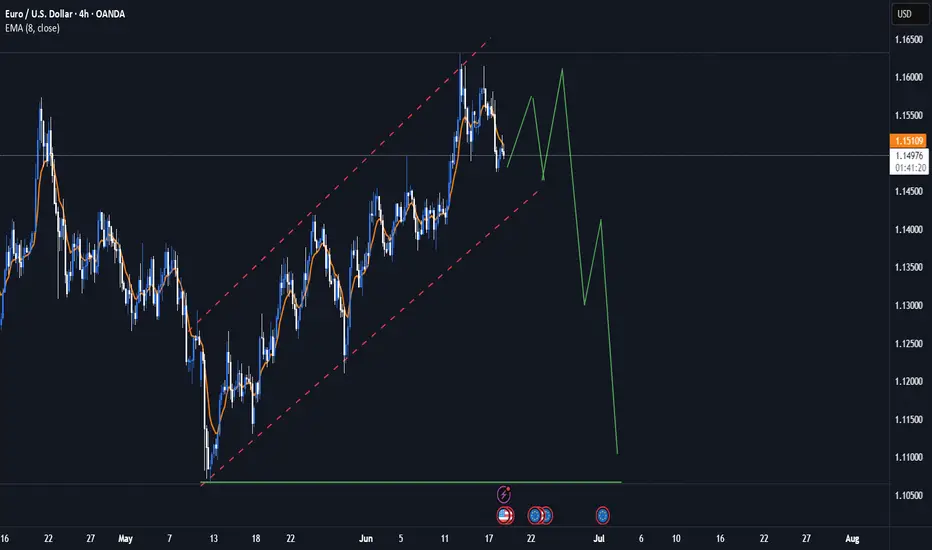
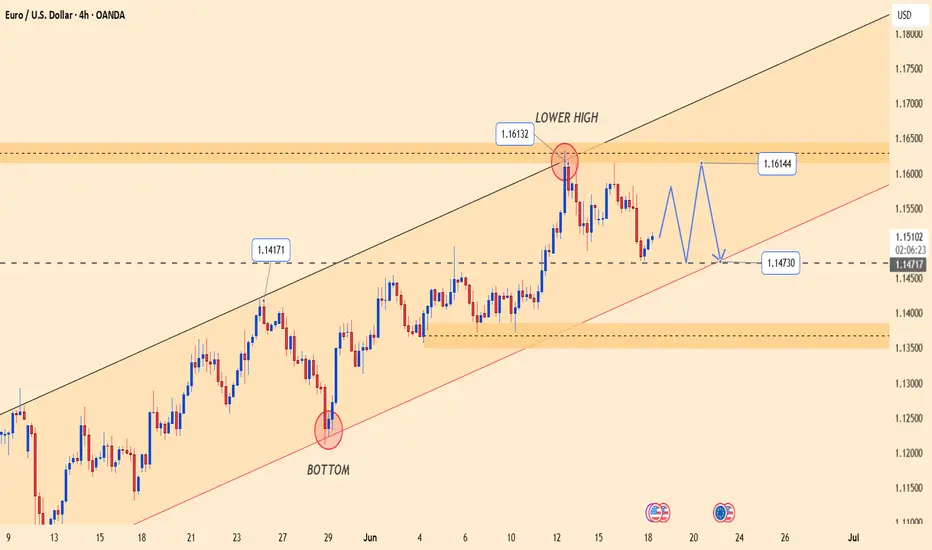
EURUSD – Bullish momentum fades, downside pressure intensifiesEURUSD formed a lower high near 1.1613, signaling weakening bullish momentum. Price is now testing a key trendline, and a break below 1.1473 could confirm a bearish move toward 1.1350.
Market sentiment is currently dominated by the Fed’s hawkish stance following the latest FOMC meeting, where the central bank kept rates unchanged but expressed readiness to hike further if necessary. Meanwhile, although tensions in the Middle East are escalating, they have yet to deliver a significant blow to the USD.
Given the current backdrop, EURUSD is under considerable pressure and may soon break its bullish structure unless strong buying interest re-emerges.
EURUSD LONGPrice swept below support around 1.1473, grabbing liquidity and quickly bouncing back — this is a classic Wyckoff spring setup.
📌 Key Levels
Entry: Around 1.1500
Stop Loss: Below 1.1424 (spring low)
Target 1: 1.1567 (range high)
Target 2: 1.1614 (measured move)
🔍 Why I like this setup:
Fake breakdown (spring) and quick recovery
Buyers showed up right after the sweep
Expecting price to return to the top of the range and possibly break higher . This a trade we hold
💡 A spring is where smart money steps in after trapping sellers — I'm following them.
“I always say that you could publish my rules in the newspaper and no one would follow them. The key is consistency and discipline.”

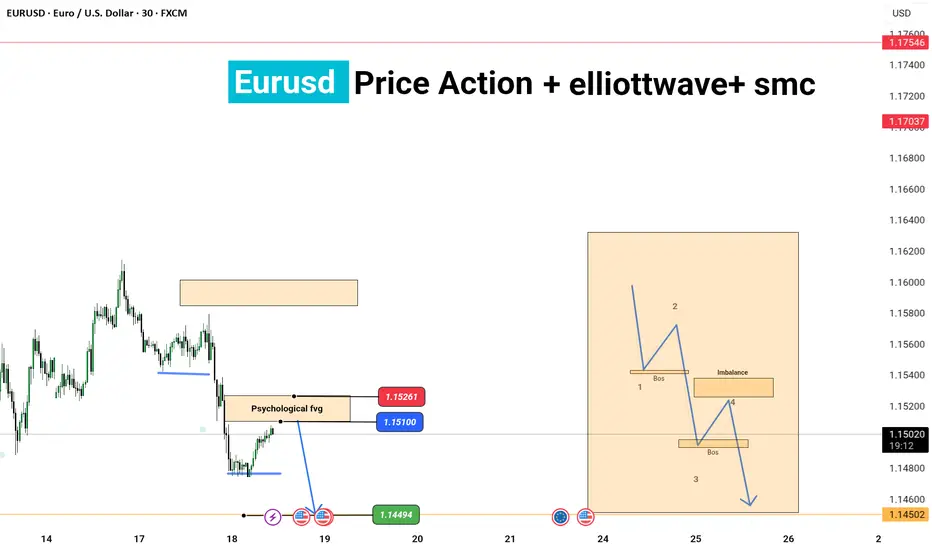
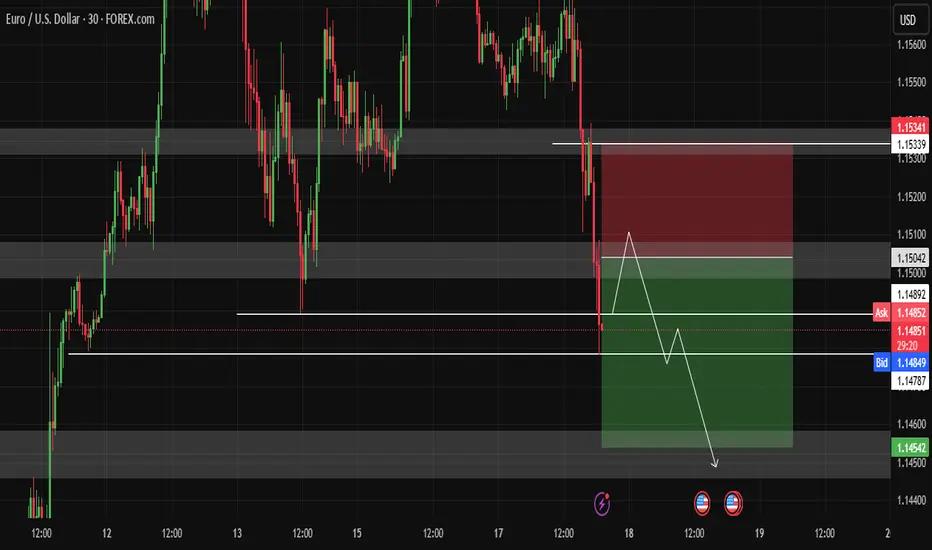
EURUSD: Price Action + Elliott Wave + SMC Analysis
"Hello traders!
Today, we're diving deep into EURUSD with a comprehensive analysis combining Price Action, Elliott Wave principles, and Smart Money Concepts (SMC).
On the chart, we observe key price action elements including:
* A 'Psychological FVG' (Fair Value Gap) around the 1.15100 - 1.15261 area, which could act as a potential resistance or reversal poin
* A target or support level identified around 1.14494 and further down at 1.14502.
Looking ahead, the diagram on the right illustrates a potential Elliott Wave structure integrated with SMC concepts:
* We see proposed waves leading to a 'BOS' (Break of Structure) indicating a shift in market control.
* An 'Imbalance' zone is highlighted, suggesting an area where price might seek to rebalance before continuing its move.
* The overall structure points towards a continued bearish momentum after potential retracements.
Key Takeaways:
* Watch the identified FVG for potential reactions.
* Monitor for further BOS confirmations to validate the bearish outlook.
* The 'Imbalance' zone could offer shorting opportunities if price retests it.
This analysis provides a multi-faceted approach to understanding potential future price movements in EURUSD. Always remember to manage your risk effectively.
What are your thoughts on this analysis? Share your insights in the comments below!
#EURUSD #Forex #PriceAction #ElliottWave #SMC #TradingAnalysis #TechnicalAnalysis #MarketOutlook #ForexTrading"
Bullish bounce?The Fiber (EUR/USD) is falling towards the pivot and could bounce to the 1st resistance.
Pivot: 1.1451
1st Support: 1.1342
1st Resistance: 1.1614
Risk Warning:
Trading Forex and CFDs carries a high level of risk to your capital and you should only trade with money you can afford to lose. Trading Forex and CFDs may not be suitable for all investors, so please ensure that you fully understand the risks involved and seek independent advice if necessary.
Disclaimer:
The above opinions given constitute general market commentary, and do not constitute the opinion or advice of IC Markets or any form of personal or investment advice.
Any opinions, news, research, analyses, prices, other information, or links to third-party sites contained on this website are provided on an "as-is" basis, are intended only to be informative, is not an advice nor a recommendation, nor research, or a record of our trading prices, or an offer of, or solicitation for a transaction in any financial instrument and thus should not be treated as such. The information provided does not involve any specific investment objectives, financial situation and needs of any specific person who may receive it. Please be aware, that past performance is not a reliable indicator of future performance and/or results. Past Performance or Forward-looking scenarios based upon the reasonable beliefs of the third-party provider are not a guarantee of future performance. Actual results may differ materially from those anticipated in forward-looking or past performance statements. IC Markets makes no representation or warranty and assumes no liability as to the accuracy or completeness of the information provided, nor any loss arising from any investment based on a recommendation, forecast or any information supplied by any third-party.

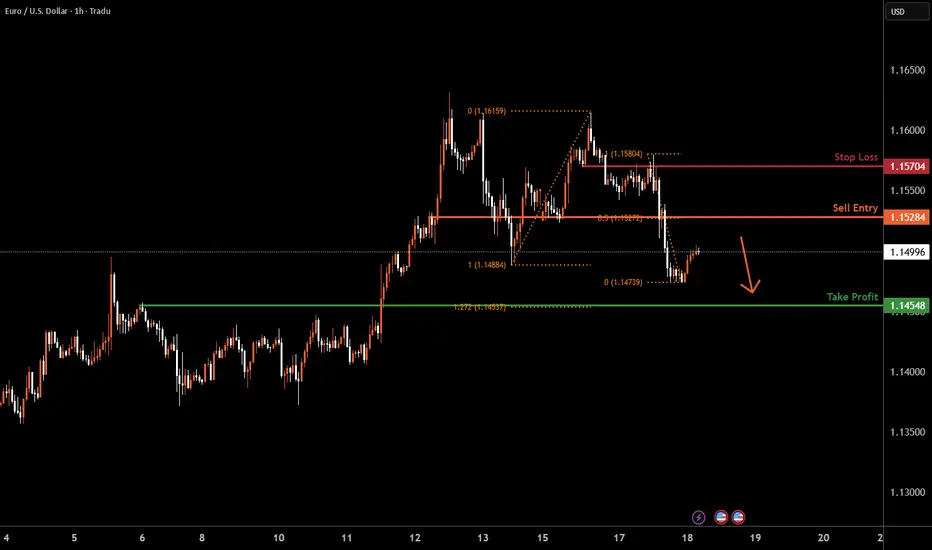
EURUSD H1 I Bearish Reversal Based on the H1 chart, the price is rising toward our sell entry level at 1.1538, a pullback resistance that aligns with the 50% Fib retracement.
Our take profit is set at 1.1454, a pullback support that aligns with the 127.2 Fib extension.
The stop loss is set at 1.1570, an overlap resistance.
High Risk Investment Warning
Trading Forex/CFDs on margin carries a high level of risk and may not be suitable for all investors. Leverage can work against you.
Stratos Markets Limited (tradu.com ):
CFDs are complex instruments and come with a high risk of losing money rapidly due to leverage. 63% of retail investor accounts lose money when trading CFDs with this provider. You should consider whether you understand how CFDs work and whether you can afford to take the high risk of losing your money.
Stratos Europe Ltd (tradu.com ):
CFDs are complex instruments and come with a high risk of losing money rapidly due to leverage. 63% of retail investor accounts lose money when trading CFDs with this provider. You should consider whether you understand how CFDs work and whether you can afford to take the high risk of losing your money.
Stratos Global LLC (tradu.com ):
Losses can exceed deposits.
Please be advised that the information presented on TradingView is provided to Tradu (‘Company’, ‘we’) by a third-party provider (‘TFA Global Pte Ltd’). Please be reminded that you are solely responsible for the trading decisions on your account. There is a very high degree of risk involved in trading. Any information and/or content is intended entirely for research, educational and informational purposes only and does not constitute investment or consultation advice or investment strategy. The information is not tailored to the investment needs of any specific person and therefore does not involve a consideration of any of the investment objectives, financial situation or needs of any viewer that may receive it. Kindly also note that past performance is not a reliable indicator of future results. Actual results may differ materially from those anticipated in forward-looking or past performance statements. We assume no liability as to the accuracy or completeness of any of the information and/or content provided herein and the Company cannot be held responsible for any omission, mistake nor for any loss or damage including without limitation to any loss of profit which may arise from reliance on any information supplied by TFA Global Pte Ltd.
The speaker(s) is neither an employee, agent nor representative of Tradu and is therefore acting independently. The opinions given are their own, constitute general market commentary, and do not constitute the opinion or advice of Tradu or any form of personal or investment advice. Tradu neither endorses nor guarantees offerings of third-party speakers, nor is Tradu responsible for the content, veracity or opinions of third-party speakers, presenters or participants.
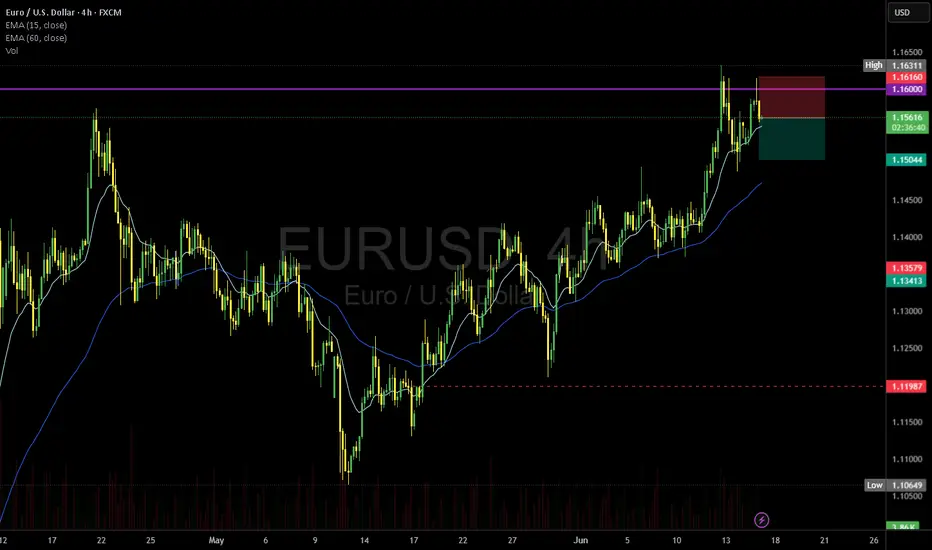
Try a RR1 🔻 Sell Setup 1
Entry: 1.15600
SL: 1.16160
TP: 1.15050
R:R ≈ 1
Rejected from 1.160; Signal bar key bar detected.
Please manage your risk.
Goldman and BofA agree: The dollar is losing its edgeGoldman Sachs now expects the EUR/USD to hit 1.20 by the end of the year. While this prediction draws comparisons to the 2017 rally in the pair, Goldman notes a key difference. This time, the pricing reflects pessimism in the US dollar, rather than optimism in the euro.
Bank of America seemingly agrees and warns that even a “hawkish” dot plot at this week’s FOMC meeting, where Fed officials signal fewer rate cuts, may only cause a brief bout of euro weakness against the dollar.
EUR/USD has recently broken out of a long-term descending triangle pattern, which capped price action from mid-April through early June, aligning with Goldman Sachs’ and BofA’s view of a broad EUR strength/ USD weakness.
This recent pullback to the 1.1480 area is a retest of former resistance turned support, suggesting a potential continuation pattern if buyers defend this level.

SELL EURUSDIn todays session we are monitoring EURUSD for selling opportunity. Our entry is at 1.15814 and stops are above 1.16050. Our target is 1.15000. Use proper risk management and stay safe fam.
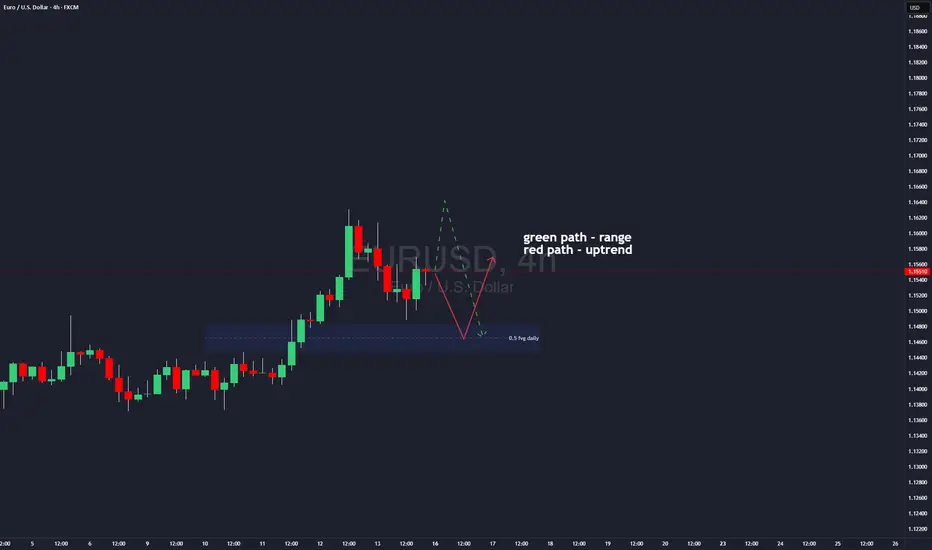
EUR/USD Set to Soar or Crash? Forecast for next weekEverything is simple, if price will drop i will be looking for longs in daily FVG
if price goes up till PWH i will expect move towards daily FVG
If you like this type of content follow and like
I am trying to make my analysis short and simple)
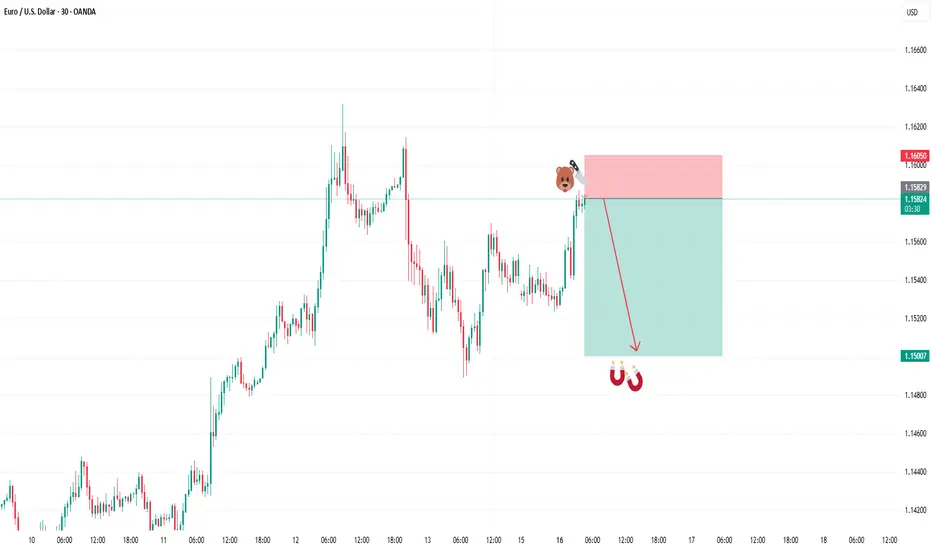
Opportunity for selling EURUSDI see that EURUSD has confirmed strong resistance, so I took a sell trade with it.
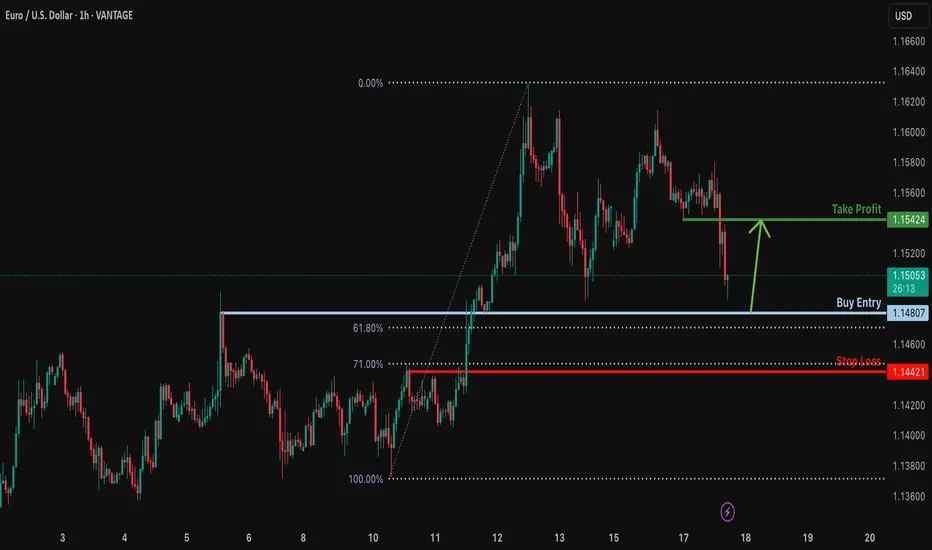
Bullish bounce?EUR/USD is falling towards the support level which is an overlap support that is slightly above the 61.8% Fibonacci retracement and could bounce from this level to our take profit.
Entry: 1.1480
Why we like it:
There is an overlap support that is slightly above the 61.8% Fibonacci retracement.
Stop loss: 1.1438
Why we like it:
There is a pullback support level that lines up with the 71% Fibonacci retracement.
Take profit: 1.1542
Why we like it:
There is a pullback resistance.
njoying your TradingView experience? Review us!
Please be advised that the information presented on TradingView is provided to Vantage (‘Vantage Global Limited’, ‘we’) by a third-party provider (‘Everest Fortune Group’). Please be reminded that you are solely responsible for the trading decisions on your account. There is a very high degree of risk involved in trading. Any information and/or content is intended entirely for research, educational and informational purposes only and does not constitute investment or consultation advice or investment strategy. The information is not tailored to the investment needs of any specific person and therefore does not involve a consideration of any of the investment objectives, financial situation or needs of any viewer that may receive it. Kindly also note that past performance is not a reliable indicator of future results. Actual results may differ materially from those anticipated in forward-looking or past performance statements. We assume no liability as to the accuracy or completeness of any of the information and/or content provided herein and the Company cannot be held responsible for any omission, mistake nor for any loss or damage including without limitation to any loss of profit which may arise from reliance on any information supplied by Everest Fortune Group.
Euro / U.S. Dollar (EUR/USD) 4-Hour Chart - OANDA4-hour candlestick chart from OANDA displays the EUR/USD exchange rate trend from May 19 to June 26, 2025. The current rate is 1.15324, reflecting a 0.25% decrease (-0.00285) as of the latest update. The chart includes a technical analysis section with a green upward trend and a red downward trend, indicating potential price movements between 1.14264 and 1.15500. Key dates and price levels are marked along the x-axis and y-axis, respectively.

EURUSD: Weak Market & Bearish Forecast
Our strategy, polished by years of trial and error has helped us identify what seems to be a great trading opportunity and we are here to share it with you as the time is ripe for us to sell EURUSD.
Disclosure: I am part of Trade Nation's Influencer program and receive a monthly fee for using their TradingView charts in my analysis.
❤️ Please, support our work with like & comment! ❤️

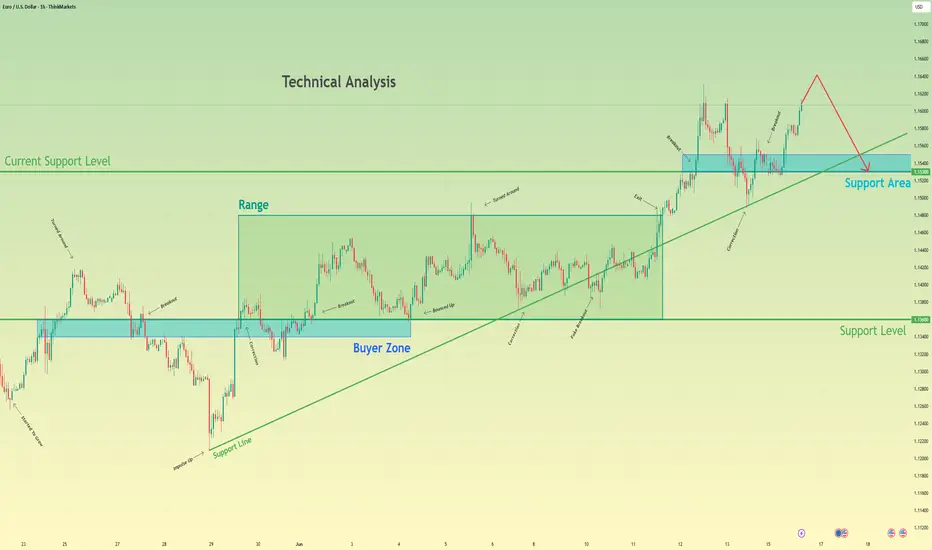
Euro can turn around and start to fall to support areaHello traders, I want share with you my opinion about Euro. Observing this chart, we can see how the price earlier dropped toward the 1.1360 support level and successfully broke it. Then we saw a short recovery move, but the price once again returned to the downside and retested the support line from below. After that, the market created a strong upward impulse, broke back above the 1.1360 level, and entered a phase of consolidation inside a range. This range held for some time, with price respecting both its upper and lower boundaries. Eventually, we saw a breakout from this consolidation, followed by another strong bullish impulse and a steady climb above the 1.1530 zone, where price is currently trading. However, the price has now approached a critical structure and is showing signs of weakening momentum. In my mind, the Euro may attempt one more small move up but then turn around and start declining toward the 1.1530 support level, breaking the ascending support line as well. That's why my TP is this support level, which coincides with the support area. Please share this idea with your friends and click Boost 🚀
Disclaimer: As part of ThinkMarkets’ Influencer Program, I am sponsored to share and publish their charts in my analysis.
EURUSD: Awaiting Confirmation to Continue the UptrendThe EUR/USD pair closed yesterday at 1.1550, moving within the 1.1526–1.1558 range. The euro continues its bullish trend, driven by U.S. inflation data coming in lower than expected, which increases expectations of an upcoming rate cut by the Fed. In addition, geopolitical tensions in the Middle East—particularly between Israel and Iran—have slightly weakened the U.S. dollar, providing additional support to the euro.
From a technical perspective, the price is currently correcting toward the 1.1480 area, where the ascending trendline converges with the exponential moving average. This is a key support zone. If it holds and a clear bullish signal emerges, EURUSD could rebound and move toward the 1.1610 resistance level.
Main scenario: look for buying opportunities around 1.1480 if a bullish confirmation appears, targeting 1.1610.
Alternative scenario: if the 1.1480 level is broken, the short-term uptrend could be at risk.