EURUSD; Heikin Ashi Trade Idea📈 Hey Traders!
Here’s a fresh outlook from my trading desk. If you’ve been following me for a while, you already know my approach:
🧩 I trade Supply & Demand zones using Heikin Ashi chart on the 4H timeframe.
🧠 I keep it mechanical and clean — no messy charts, no guessing games.
❌ No trendlines, no fixed sessions, no patterns, no indicator overload.
❌ No overanalyzing market structure or imbalances.
❌ No scalping, and no need to be glued to the screen.
✅ I trade exclusively with limit orders, so it’s more of a set-and-forget style.
✅ This means more freedom, less screen time, and a focus on quality setups.
✅ Just a simplified, structured plan and a calm mindset.
💬 Let’s Talk:
💡Do you trade supply & demand too ?
💡What’s your go-to timeframe ?
💡Ever tried Heikin Ashi ?
📩 Got questions about my strategy or setup? Drop them below — ask me anything, I’m here to share.
Let’s grow together and keep it simple. 👊
Eurusd-3

EURUSD; Heikin Ashi Trade Idea📈 Hey Traders!
Here’s a fresh outlook from my trading desk. If you’ve been following me for a while, you already know my approach:
🧩 I trade Supply & Demand zones using Heikin Ashi chart on the 4H timeframe.
🧠 I keep it mechanical and clean — no messy charts, no guessing games.
❌ No trendlines, no fixed sessions, no patterns, no indicator overload.
❌ No overanalyzing market structure or imbalances.
❌ No scalping, and no need to be glued to the screen.
✅ I trade exclusively with limit orders, so it’s more of a set-and-forget style.
✅ This means more freedom, less screen time, and a focus on quality setups.
✅ Just a simplified, structured plan and a calm mindset.
💬 Let’s Talk:
💡Do you trade supply & demand too ?
💡What’s your go-to timeframe ?
💡Ever tried Heikin Ashi ?
📩 Got questions about my strategy or setup? Drop them below — ask me anything, I’m here to share.
Let’s grow together and keep it simple. 👊

XAU/USD | Gold at a Turning Point – Breakout or Breakdown Ahead?By analyzing the gold chart on the 4-hour timeframe, we can see that after our last analysis, gold continued its correction and dropped to $3358. It’s currently trading around $3367, and for the bullish scenario to remain valid, we need to see price hold above $3358 and soon close above $3370. If this happens, another bullish move could follow.
Otherwise, if gold breaks and stabilizes below $3358, this scenario will be invalidated, and the alternative outlook suggests further downside toward $3349 and $3339. This analysis will be updated — and don’t forget to show your support, friends!
Please support me with your likes and comments to motivate me to share more analysis with you and share your opinion about the possible trend of this chart with me !
Best Regards , Arman Shaban

EURUSD Will Move Lower! Short!
Here is our detailed technical review for EURUSD.
Time Frame: 4h
Current Trend: Bearish
Sentiment: Overbought (based on 7-period RSI)
Forecast: Bearish
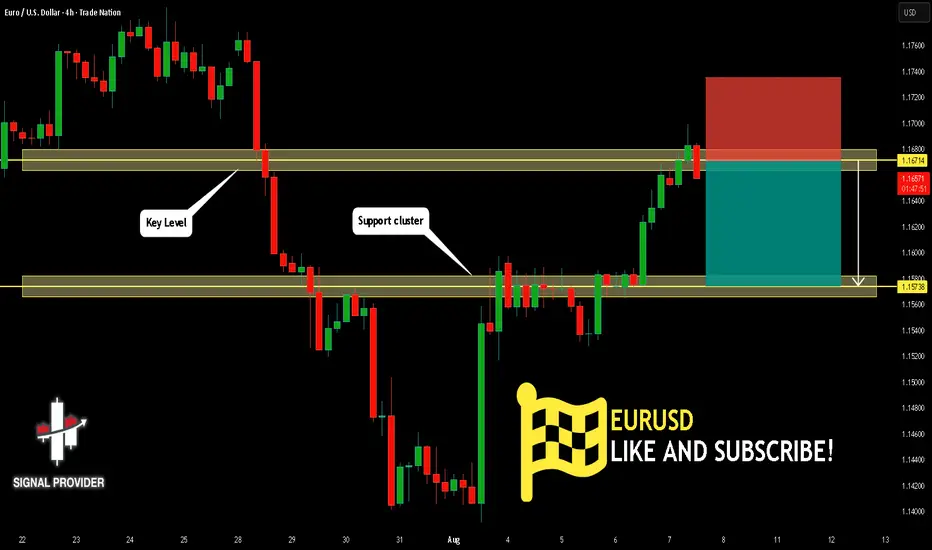
The market is testing a major horizontal structure 1.167.
Taking into consideration the structure & trend analysis, I believe that the market will reach 1.157 level soon.
P.S
The term oversold refers to a condition where an asset has traded lower in price and has the potential for a price bounce.
Overbought refers to market scenarios where the instrument is traded considerably higher than its fair value. Overvaluation is caused by market sentiments when there is positive news.
Disclosure: I am part of Trade Nation's Influencer program and receive a monthly fee for using their TradingView charts in my analysis.
Like and subscribe and comment my ideas if you enjoy them!
EURUSD – Critical Zone AheadBack on June 29, I shared a buy idea on EURUSD (tagged below this post).
Due to a busy schedule, I couldn't post an update—but as you can see, price reacted to my marked zone, did a quick stop-hunt, and moved up strongly.
Now, the current zone marked on the chart is a potential short area,
but again—we don’t tell the market what to do. We follow it.
📌 If the level breaks upward, we’ll wait for a pullback to go long.
If a valid short signal shows up, we’ll go short.
🔁 Anything can happen—this is why I always remind traders:
Don’t stand in front of the market.
Those who do… often end up like sardines eaten by the whales 🐋—liquidated and out of capital.
Let the market choose the direction, and we simply follow.
📈 Stay flexible. Stay humble. Stay profitable.
EURUSD at a Crossroads: The Battle at the 78.6% Fib LevelMarkets rarely move in a straight line. After a powerful rally was stopped by monthly supply, EURUSD has arrived at a critical crossroads. The higher timeframe trend is still bullish, but a potential daily downtrend is emerging. This analysis focuses on the single high-probability short setup that could define the next major move.
After the price found support at the 50% Fibonacci retracement level of the weekly structure , which coincided with the daily structure's break level, further decline was prevented by negative NFP news last Friday, which pushed the dollar index down. The long scenario from this level, which I detailed in my previous analysis " EURUSD: The Logic of Institutional Capital Unveiled ", is still active. An entry directly from that level was impossible due to the reversal occurring on highly volatile news, but it's still possible from the manipulation zone in the form of the bullish order block below.
This current analysis is a continuation of that one, but from the perspective of looking for short positions , as the price has shown its intention to first reach a zone of interest above. So, let's try to further unravel the logic and the next step of large capital.
The global uptrend of the pair was halted by a monthly supply zone , from which a correction began and subsequently reversed at the 50% weekly level. One might expect the uptrend to continue and only look for long entries. However, the fact that the price found its pivot point in a monthly supply zone and has since shown the potential genesis of a bearish daily structure allows us to consider counter-trend short trades, with fresh footprints from "smart money" to guide us.
On its continued ascent, the price will face resistance in the form of a bearish order block in conjunction with the 78.6% retracement level of the new, potentially bearish structure. Everything will depend on whether this level and order block hold and show a reversal reaction. The entry condition for a short will be the mitigation of this order block concurrently with reaching the 78.6% level, followed by price finding acceptance below it .
► Invalidation: Invalidation of the short scenario would be a break of the 78.6% level with the price finding acceptance above it.
In the case of a short setup forming and an entry being confirmed, the minimum target for the price will be the bullish daily order block below, which was formed during the liquidity sweep of the daily structure's break level.
A key global context for EURUSD to consider upon the mitigation of the daily bearish order block is the Dollar Index (DXY) . After breaking its bearish daily structure (BOS D) to the upside, it also began a correction after NFP. The target and potential reversal zone for DXY is the same as EURUSD's but a mirror image: the 78.6% Fibonacci retracement level in conjunction with a daily order block . It is highly probable that the potential setup formation on these two instruments will occur synchronously. Given their strong inverse correlation, a potential short setup on the euro pair would receive additional confirmation if a long setup forms on the Dollar Index.
~~~~~~~~~~~~~~~~~~~~~~~~~~~~~~~~~~~~~~~~~~~~~~~~~~~~~~~~~~~~~~~~~
The principles and conditions for forming the manipulation zones I show in this trade idea are detailed in my educational publication, which was chosen by TradingView for the "Editor's Picks" category and received a huge amount of positive feedback from this insightful trading community. To better understand the logic I've used here and the general principles of price movement in most markets from the perspective of institutional capital, I highly recommend checking out this guide if you haven't already. 👇
P.S. This is not a prediction of the exact price direction. It is a description of high-probability setup that become valid only if specific conditions are met when the price reaches the marked POI. If the conditions are not met, the setup are invalid. No setup has a 100% success rate, so if you decide to use this trade idea, always apply a stop-loss and proper risk management. Trade smart.
~~~~~~~~~~~~~~~~~~~~~~~~~~~~~~~~~~~~~~~~~~~~~~~~~~~~~~~~~~~~~~~~~
If you found this analysis helpful, support it with a Boost! 🚀
Have a question or your own view on this idea? Share it in the comments. 💬
► Follow me on TradingView for timely updates on THIS idea (entry, targets & live trade management) and not to miss my next detailed breakdown.
~~~~~~~~~~~~~~~~~~~~~~~~~~~~~~~~~~~~~~~~~~~~~~~~~~~~~~~~~~~~~~~~~

EURUSD – DAILY FORECAST Q3 | W32 | D7 | Y25📊 EURUSD – DAILY FORECAST
Q3 | W32 | D7 | Y25
Daily Forecast 🔍📅
Here’s a short diagnosis of the current chart setup 🧠📈
Higher time frame order blocks have been identified — these are our patient points of interest 🎯🧭.
It’s crucial to wait for a confirmed break of structure 🧱✅ before forming a directional bias.
This keeps us disciplined and aligned with what price action is truly telling us.
📈 Risk Management Protocols
🔑 Core principles:
Max 1% risk per trade
Only execute at pre-identified levels
Use alerts, not emotion
Stick to your RR plan — minimum 1:2
🧠 You’re not paid for how many trades you take, you’re paid for how well you manage risk.
🧠 Weekly FRGNT Insight
"Trade what the market gives, not what your ego wants."
Stay mechanical. Stay focused. Let the probabilities work.
FX:EURUSD

EURUSD rises slightly as US economy weakens more than expected1) Market Overview
EURUSD fluctuates around 1.0850 - 1.0960, with a slight upward trend thanks to
- US economic data is below expectations
- ECB maintains a mildly dovish stance, affirming that it will continue to monitor inflation instead of declaring an end to interest rate hikes
This week the market will focus on
- US CPI - which can cause strong fluctuations
- Some statements from ECB and FED members
- Geopolitical risks in the Middle East and Europe
2) Technical Analysis
- Trend: EURUSD is trending slightly upward, the main support level is around 1.0850 and strong resistance is at 1.0970-1.10000
- RSI: fluctuates near the 55-60 zone, not overbought, still has room to increase
- MACD: is crossing the signal line - a potential bullish signal
EURUSD – Which Way Will It Break?Hello everyone, what are your thoughts on the EURUSD trend?
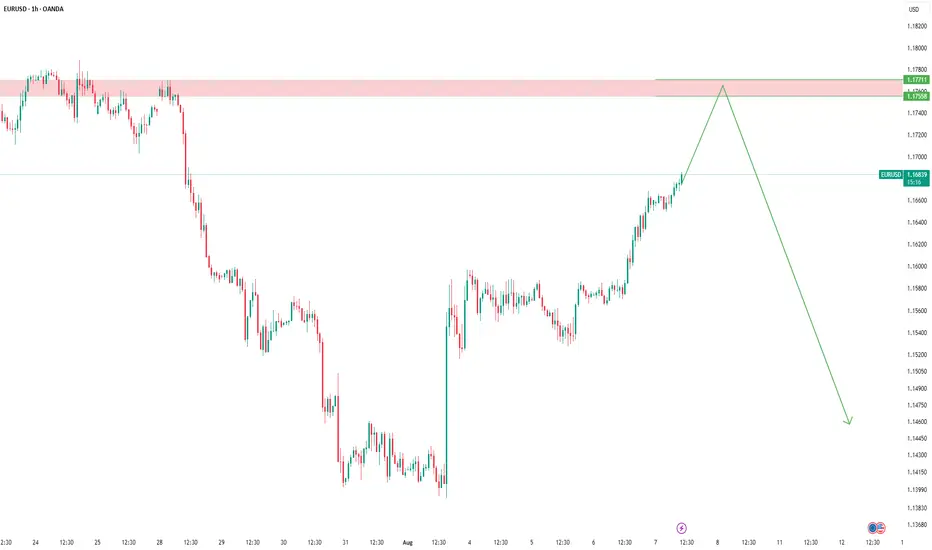
EURUSD is currently experiencing a Bollinger Bands squeeze, signaling a potential breakout in either direction. The price is trading near the lower limit, hovering around 1.157 , with two potential scenarios unfolding:
Bullish scenario: The price could break upward toward 1.172, testing the upper resistance zone.
Bearish scenario: If the price falls below the lower limit, it could head towards the sell target at 1.140.
💬 For me, I’m leaning toward FOMO (Fear of Missing Out) and following the sell trend with a target of 1.140. What about you? Let me know your thoughts in the comments below!

Bearish reversal for the Fiber?The price is rising towards the pivot and could reverse to the 1st support which is an overlap support.
Pivot: 1.1691
1st Support: 1.1591
1st Resistance: 1.1807
Risk Warning:
Trading Forex and CFDs carries a high level of risk to your capital and you should only trade with money you can afford to lose. Trading Forex and CFDs may not be suitable for all investors, so please ensure that you fully understand the risks involved and seek independent advice if necessary.
Disclaimer:
The above opinions given constitute general market commentary, and do not constitute the opinion or advice of IC Markets or any form of personal or investment advice.
Any opinions, news, research, analyses, prices, other information, or links to third-party sites contained on this website are provided on an "as-is" basis, are intended only to be informative, is not an advice nor a recommendation, nor research, or a record of our trading prices, or an offer of, or solicitation for a transaction in any financial instrument and thus should not be treated as such. The information provided does not involve any specific investment objectives, financial situation and needs of any specific person who may receive it. Please be aware, that past performance is not a reliable indicator of future performance and/or results. Past Performance or Forward-looking scenarios based upon the reasonable beliefs of the third-party provider are not a guarantee of future performance. Actual results may differ materially from those anticipated in forward-looking or past performance statements. IC Markets makes no representation or warranty and assumes no liability as to the accuracy or completeness of the information provided, nor any loss arising from any investment based on a recommendation, forecast or any information supplied by any third-party.

EURUSDPrice recently plunged into the deep and has now returned for fair value. We are already in a significant area, on a higher time-frame(1D), so any moment from now they can collapse it, much like last week! Be on the look-out like a meerkat!
1.1680 and 1.1720 are institutional price levels and price tends to have strong reactions in these areas. I expect to see that play out tomorrow.
The following reports will be used to trigger this move:
BoE Monetary Policy Report.
Continuing Jobless Claims 4-Week Average.
Initial Jobless Claims.
Unit Labour Costs.
Nonfarm Productivity.
Stay safe!

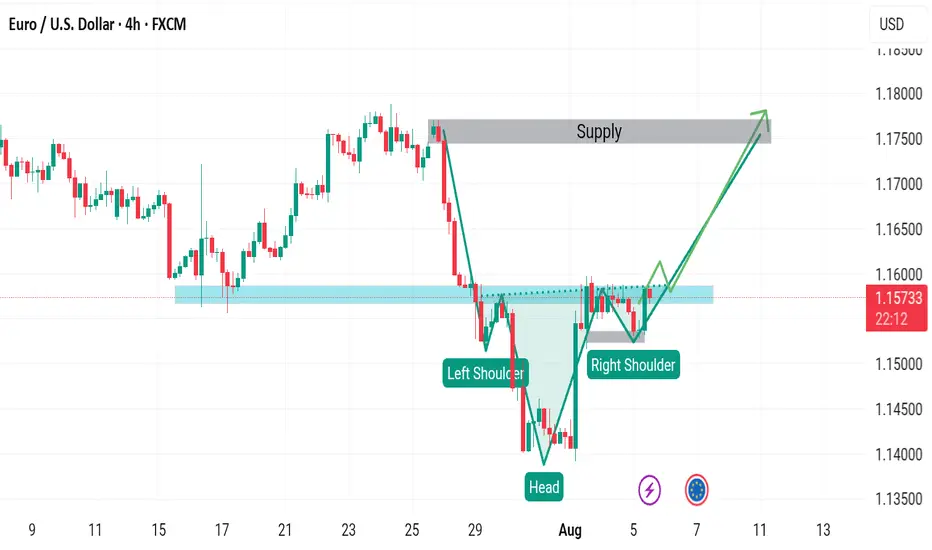
EURUSD BUY SETUPThe price will form a head and shoulders pattern because the candle in the second shoulder is very strong, which indicates that it will break the neck of the pattern. We also have a stronger bounce from below, so I expect an uptrend.
DeGRAM | EURUSD returned to the channel📊 Technical Analysis
● EURUSD broke above the descending channel resistance and reclaimed the 1.1567 level, signaling a potential reversal after defending 1.1446 support.
● The price is forming a bullish sequence of higher lows, and a breakout above 1.1592 could open the path toward the 1.1765 resistance zone.
💡 Fundamental Analysis
● A weaker-than-expected US ISM Services report triggered USD selling, while hawkish ECB remarks from Nagel supported euro recovery.
● Markets are pricing in fewer Fed hikes as job data cools, reducing dollar appeal and favoring EUR upside.
✨ Summary
Long bias above 1.1446. Breakout targets 1.1592 ➜ 1.1765. Setup valid while structure holds above prior resistance-turned-support.
-------------------
Share your opinion in the comments and support the idea with a like. Thanks for your support!

EURUSD: Move Down Expected! Short!
My dear friends,
Today we will analyse EURUSD together☺️
The recent price action suggests a shift in mid-term momentum. A break above the current local range around 1.16384 will confirm the new direction upwards with the target being the next key level of 1.16133 and a reconvened placement of a stop-loss beyond the range.
❤️Sending you lots of Love and Hugs❤️

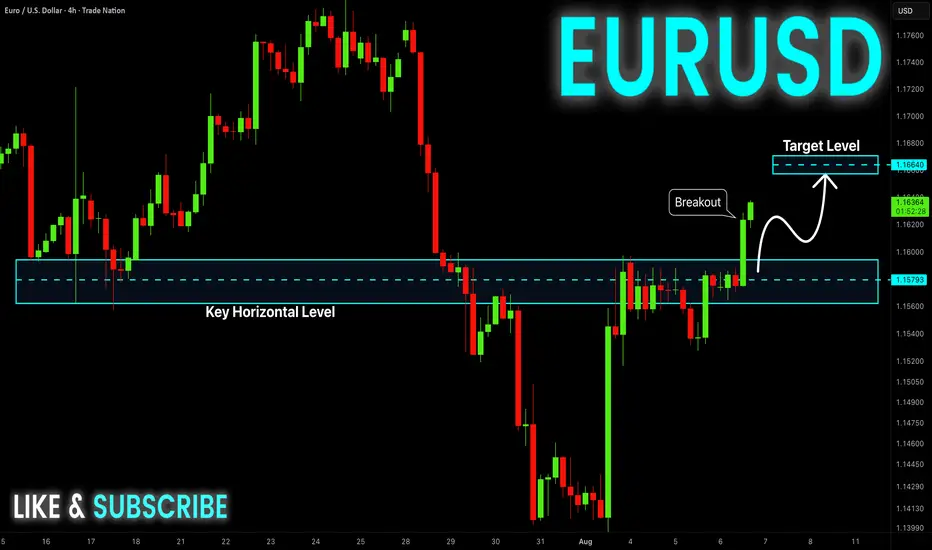
EUR-USD Bullish Breakout! Buy!
Hello,Traders!
EUR-USD is going up now
And the pair made a bullish
Breakout of the key horizontal
Level of 1.1593 and the breakout
Is confirmed so we are bullish
Biased and we will be
Expecting a further
Bullish move up
Buy!
Comment and subscribe to help us grow!
Check out other forecasts below too!
Disclosure: I am part of Trade Nation's Influencer program and receive a monthly fee for using their TradingView charts in my analysis.
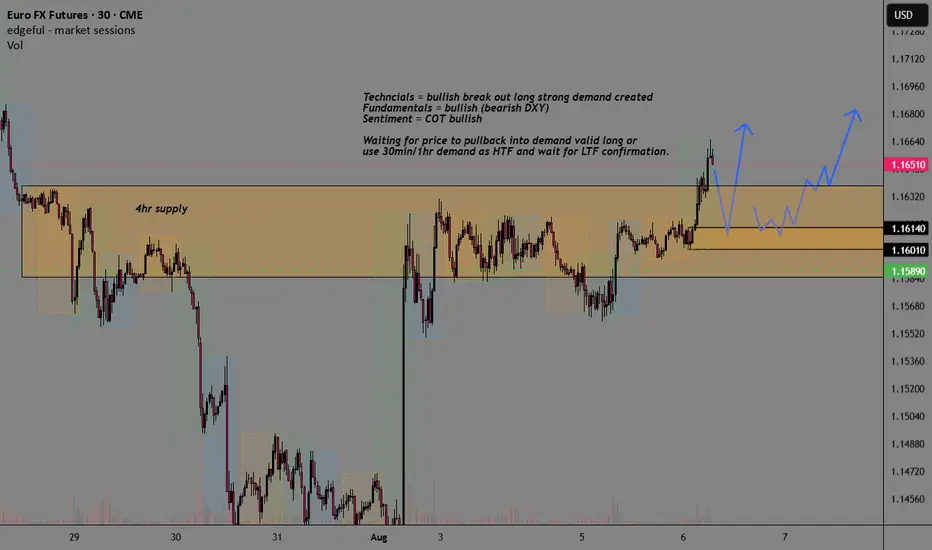
EUR EURUSD Supply-Demand Breakout Buy SetupSee chart for top-down analysis.
Looking at long if price pulls back into break-out level of demand with strong fundamentals, technicals, and sentiment COT reports.
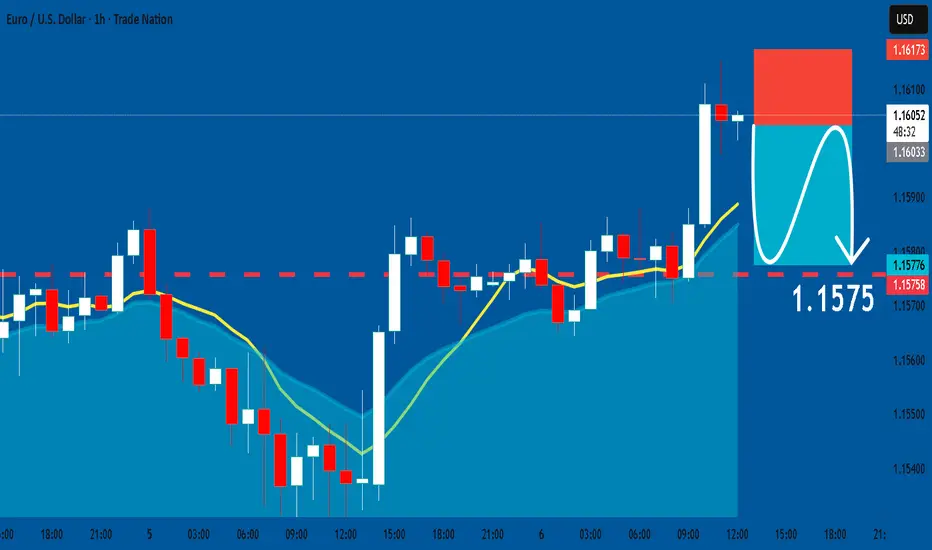
EURUSD: Bearish Continuation & Short Trade
EURUSD
- Classic bearish formation
- Our team expects pullback
SUGGESTED TRADE:
Swing Trade
Short EURUSD
Entry - 1.1603
Sl - 1.1617
Tp - 1.1575
Our Risk - 1%
Start protection of your profits from lower levels
Disclosure: I am part of Trade Nation's Influencer program and receive a monthly fee for using their TradingView charts in my analysis.
❤️ Please, support our work with like & comment! ❤️
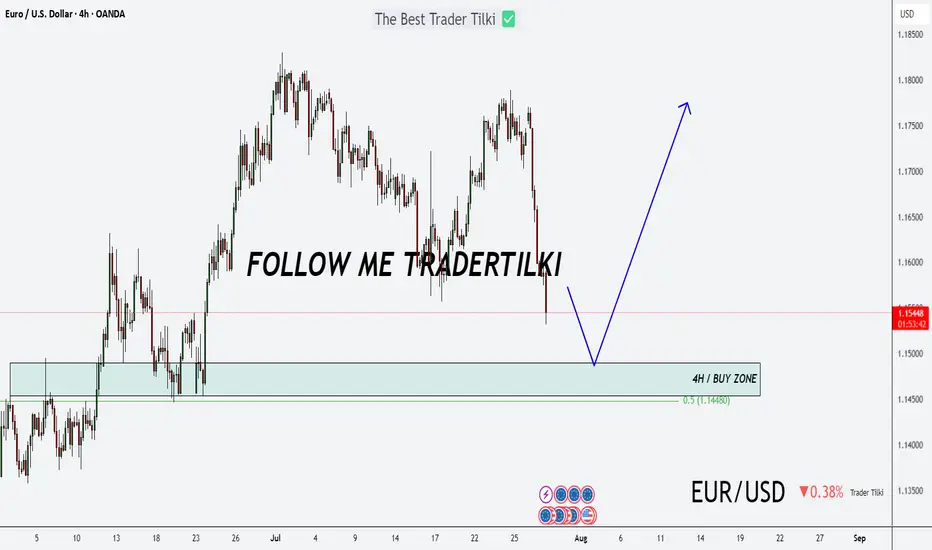
Major U.S. News Ahead—Will EURUSD Pivot?Good morning, my friends 👋
Here’s my EURUSD market analysis 📉
Currently, the pair is in a downtrend. I expect this downward move to end around 1.14899 or 1.14536, where a potential buying opportunity may emerge. I personally plan to enter a buy position once price reaches those zones 💼
Also, keep an eye on major U.S. economic reports being released today—they could trigger increased volatility 🔔
Every like you send is a huge source of motivation for me to keep sharing high-quality analysis 🙏 Thanks to everyone supporting the channel 💙
Pushing Hard To RisePrice has been butting up against the 1.1585 level for days. I believe a large breakout is brewing.
Weekly point of control and the dailies are all in a similar area. Still that huge fair value gap from last week below, but I believe this will stay for now.
I believe the highs at 1.1800 will be tested again and possibly broken. There seems to be little faith in the USD at the moment.

EURUSD After breaking below the ascending trendline, EUR/USD has confirmed a structural shift with strong bearish momentum. The pair retested the broken trendline and is now facing resistance between 1.1589 – 1.1613, which also aligns with a previous demand zone turned supply.
Price is currently respecting this area and forming a potential lower high, indicating the continuation of the downtrend.
🔻 Trade Setup (illustrated on chart):
Entry: Around 1.1589
Stop Loss: Above 1.1629
Target: Down to the 1.1250 area, near previous consolidation support.
This short setup is supported by:
Bearish break of structure
Failed bullish continuation
Macro backdrop (weak US data pushing rate cut odds up, but EUR remains fundamentally weak amid sluggish EU data)
📉 If price holds below 1.1613, bears may remain in control. A break above this zone invalidates the setup.

Double Trap on USTEC: Sell Zones Locked In!Hey Guys,
I’ve prepared a NASDAQ 100 / USTEC 100 analysis for you. I’m planning to open sell positions from two key levels:
🔹 First entry: 23,290 or 23,164
🔹 Second entry: 23,397 – 23,450
🎯 Target levels:
TP1: 22,800
TP2: 22,666
Every single like from you is my biggest source of motivation to keep sharing these analyses. Huge thanks to everyone who supports with a like! 🙏

EURUSD Showing Reversal Signs After 7-Month Bullish TrendHello everybody!
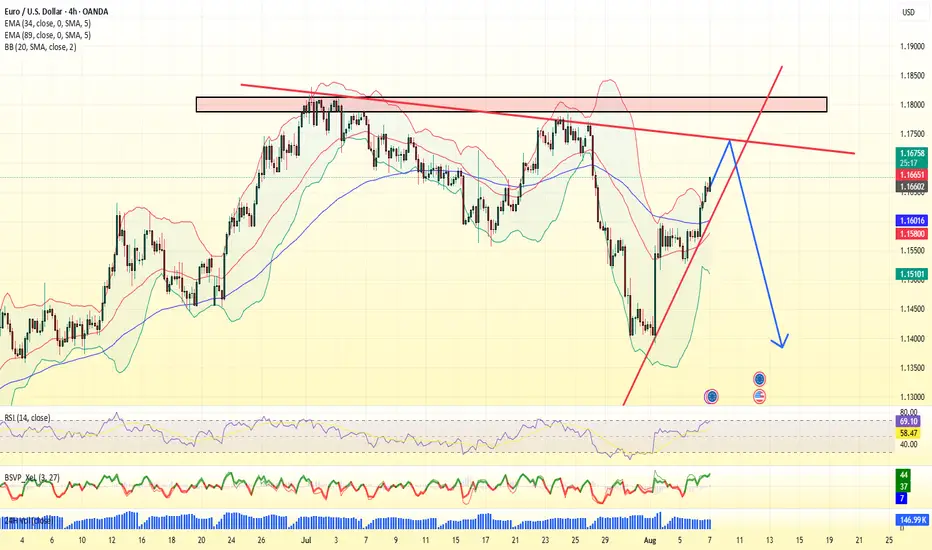
After holding bullish momentum for a long time (7 months), EURUSD is starting to show signs of reversal:
1. It has been rejected from a strong resistance area.
2. It broke a support area, which is now expected to act as resistance.
3. It broke a solid upward trendline with a strong downward move.
If this area holds and price doesn't go above 1.18000, we can look to sell from here.
In that case, the most likely target will be around 1.12000.
Manage your risk and trade safe!

EURUSD – DAILY FORECAST Q3 | W32 | D6 | Y25📊 EURUSD – DAILY FORECAST
Q3 | W32 | D6 | Y25
Daily Forecast 🔍📅
Here’s a short diagnosis of the current chart setup 🧠📈
Higher time frame order blocks have been identified — these are our patient points of interest 🎯🧭.
It’s crucial to wait for a confirmed break of structure 🧱✅ before forming a directional bias.
This keeps us disciplined and aligned with what price action is truly telling us.
📈 Risk Management Protocols
🔑 Core principles:
Max 1% risk per trade
Only execute at pre-identified levels
Use alerts, not emotion
Stick to your RR plan — minimum 1:2
🧠 You’re not paid for how many trades you take, you’re paid for how well you manage risk.
🧠 Weekly FRGNT Insight
"Trade what the market gives, not what your ego wants."
Stay mechanical. Stay focused. Let the probabilities work.
FX:EURUSD
