EURJPY Bulls in Trouble? Massive Rejection Signals📉 Full Multi-Factor Analysis – EUR/JPY
🔍 1. Price Action
EUR/JPY strongly rejected the key supply zone between 164.80–165.50, aligned with a major static resistance.
Last week's breakout was invalidated by a clear bull trap, followed by a bearish engulfing candle.
Price broke below the ascending channel drawn since April and is now heading toward the 162.00 demand area.
The weekly RSI shows a bearish divergence, confirming a slowdown in momentum.
➡️ Technical Bias: Bearish toward 161.50–162.00, with a possible extension to 160.00.
💼 2. COT Data – Commitment of Traders
EUR Futures (CME)
Strong increase in commercial longs (+16,095) and non-commercial shorts (+4,830).
Suggests smart money is accumulating while retail/speculators are pressing shorts — potential accumulation, but no breakout yet.
JPY Futures
Significant rise in non-commercial shorts (+10,575), while long positions declined.
The yen remains pressured, but extreme positioning could fuel a reversal if sentiment flips.
➡️ COT Takeaway: Euro remains in bullish consolidation. Yen is heavily oversold — ripe for mean reversion. Caution warranted.
📊 3. Retail Sentiment
80% of retail traders are short from an average price of 160.46, while price now sits at 164.86.
The crowd is deep in drawdown — a typical condition for short-term consolidations or fakeouts before reversals.
➡️ Implication: Price may hover around 164+ to trap remaining retail shorts before unwinding.
📈 4. Seasonality
June seasonality for EUR/JPY is historically neutral to bearish.
Only the 5-year data shows strength, while 15Y and 20Y trends reveal consistent downside starting mid-June.
➡️ Seasonal Outlook: Adds further weight to a bearish correction scenario for the second half of the month.
✅ Actionable Summary
📌 Weekly Bias: Bearish
📉 Main Target: 162.00–161.50
📉 Extended Target: 160.00
📈 Invalidation: Weekly close above 165.60
🧠 Final Thoughts
All major elements — price action, COT, sentiment, and seasonality — point toward a corrective move on EUR/JPY.
Given the strong underlying trend and retail’s positioning, watch out for bull traps before deeper downside.
Best setup: Sell the pullback or wait for clean breakdown below 163.00.
Eurusd-3

Fundamental Market Analysis for June 10, 2025 EURUSDAn Event to pay attention today:
13:00 EET. USD - NFIB Small Business Optimism Index
EURUSD:
The EUR/USD pair is struggling to capitalise on the previous day's gains and is attracting new sellers around 1.1435 during Tuesday's Asian session. The intraday decline is driven by solid demand for the US dollar (USD) and has pushed spot prices below 1.1400 in the last hour.
Friday's US non-farm payrolls (NFP) report, which showed higher-than-expected data, dampened hopes for an early interest rate cut by the Federal Reserve (Fed) this year. This, along with optimism about the resumption of trade talks between the US and China, is prompting traders to ease their bearish bets on the US dollar, which is proving to be a key factor putting pressure on the EUR/USD pair. However, as negotiations continued into a second day in London, traders may refrain from aggressive directional bets.
In addition, traders still see a rate cut by the US central bank in September as more likely. This, along with concerns about the financial health of the US government, may limit further strengthening of the US dollar and provide support for the EUR/USD pair. In contrast, the European Central Bank (ECB) hinted at the end of its rate-cutting cycle at its meeting last week. This could further benefit the single currency and help limit losses for the currency pair.
Traders may also refrain from aggressive betting ahead of this week's US inflation data release.
Trading recommendation: SELL 1.1390, SL 1.1410, TP 1.1300
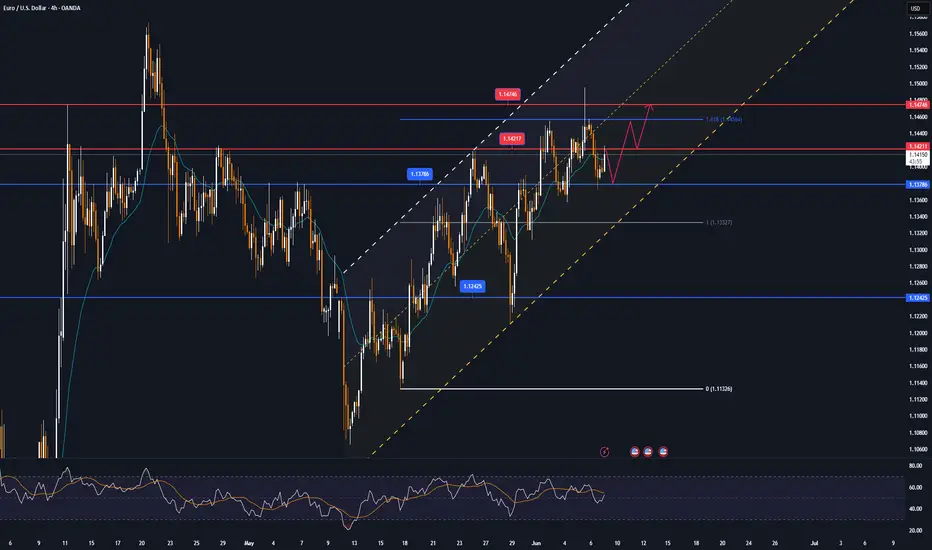
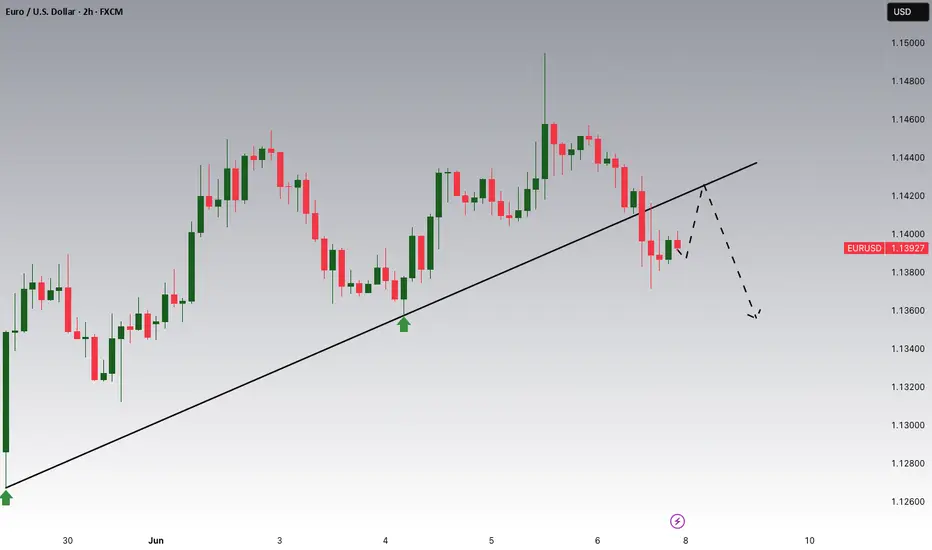
EURUSD – Still a chance to rebound if support holdsEURUSD has recently pulled back slightly after approaching resistance near the rising trendline. Currently, price is heading back to retest the support zone around 1.13200 – a key confluence area with the EMA89 and previous swing lows. This is a crucial level. If it holds, there’s a strong possibility for a rebound toward the 1.14280 resistance area.
On the H4 timeframe, the price structure remains within an ascending channel with no clear signs of trend reversal. The formation of higher lows suggests that buying pressure is still present. Notably, if this week’s CPI, PPI, and NFP data come in weaker than expected, market sentiment may shift further toward the idea of an early Fed rate cut – potentially providing a lift for EURUSD.
Additionally, rising geopolitical tensions could increase risk aversion, weakening the USD and further supporting the euro.
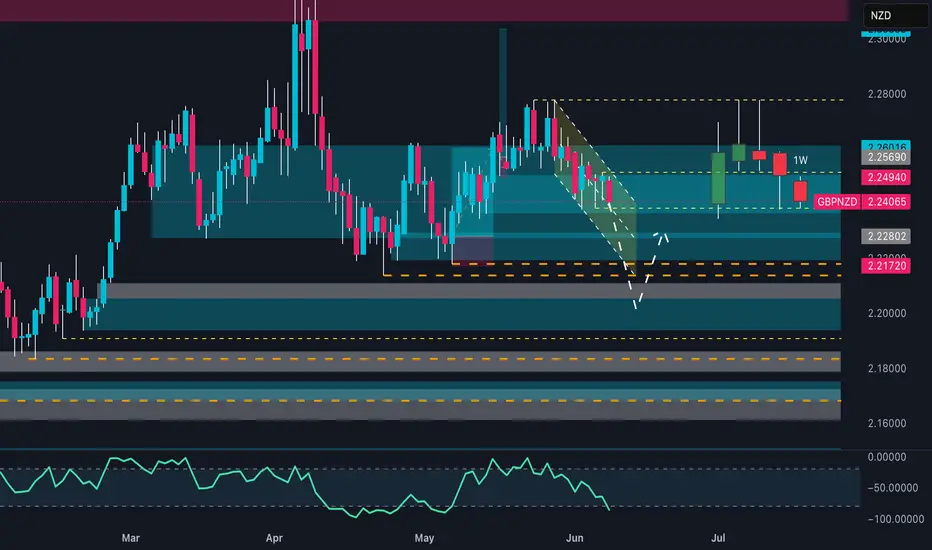
GBPNZD Ready to Flip? Key Reversal Zone in Play🔹 1. Price Action and Technical Structure
Price is currently at 2.2405, declining from the recent high in the 2.26–2.28 area.
The pair completed a descending channel with potential for reversal. A bullish reaction is taking place from the 2.2280–2.2170 demand zone, supported by previous volume spikes.
The RSI is falling, nearing oversold territory but not yet at extreme levels.
Possible technical scenarios:
Bullish: Recovery toward 2.2560–2.2600, with a potential breakout above recent highs.
Bearish: A break below 2.2170 could trigger further downside toward 2.2000 and 2.1800.
🔹 2. Seasonality (June)
NZD
June tends to be slightly positive for NZD (average: +0.0011 over 20 years), with consistent monthly patterns.
GBP
June is historically neutral to negative for GBP (average: +0.0015 over 20 years, but negative over 5 and 2 years).
➡️ This implies a seasonal edge for NZD over GBP.
🔹 3. Retail Sentiment
60% of retail traders are long on GBPNZD.
40% are short, but long positions average 2.1874, currently in profit.
➡️ This presents a mild contrarian bearish pressure, due to crowding on the long side.
🔹 4. Commitment of Traders (COT) – Institutional Positioning
GBP (as of 2025-06-03)
Commercials Net Long: +74.5K
Non-Commercials Net Short: -11.3K
Weekly changes: +30.3K longs vs. +32.6K shorts
➡️ Moderate balance, but growing speculative short interest.
NZD (as of 2025-06-03)
Non-Commercials Net Short: -23.6K
Strong weekly increase in commercial longs (+6.4K) and total long flows
➡️ NZD is seeing renewed interest from commercial players — a potential bullish signal.
🔹 5. Trading Outlook
📌 Current Bias: Neutral with short-term bearish tilt, but medium-term bullish reversal risk rising.
➤ Potential setups:
Conservative Long Entry: On bullish confirmation at 2.2170 (double bottom or bullish engulfing), target 2.2560–2.2600
Aggressive Short Entry: On pullback to 2.2490–2.2560, with stop above 2.2620, target 2.2280–2.2170
🎯 Seasonal and institutional factors favor NZD strength, but technical structure calls for caution and confirmation.
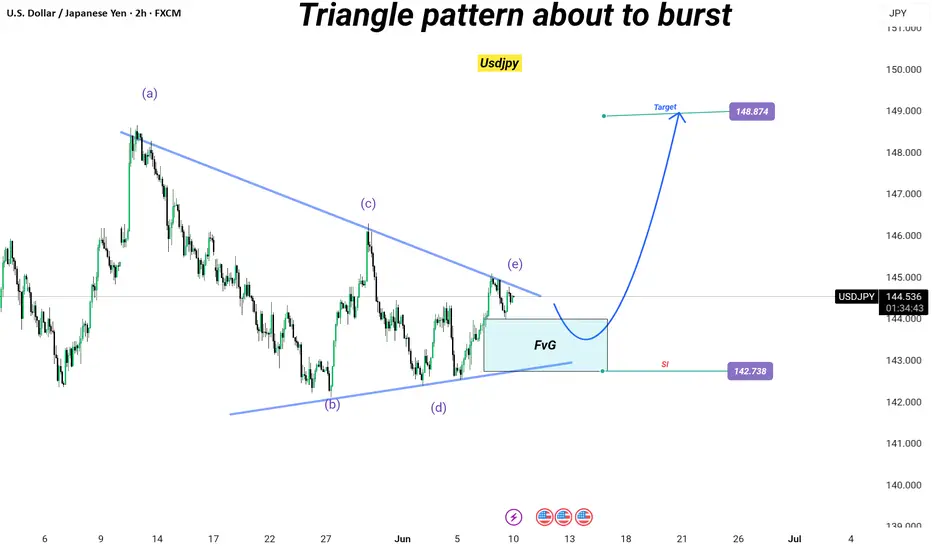
Usdjpy|| — the next move could be explosiveUSD/JPY
Timeframe: 2H
Strategy: Elliott Wave + Triangle Pattern + Fair Value Gap (FvG)
Formation: Contracting Triangle – Wave (a) to (e)
Risk-Reward: High Conviction Setup
Status: On the verge of breakout
🔍 Technical Breakdown:
The chart shows a classic contracting triangle pattern with completed internal waves (a)-(b)-(c)-(d)-(e).
Price is reacting near wave (e), signaling a potential bullish breakout.
A clean Fair Value Gap (FvG) zone lies just below current price — possible last dip before the breakout surge.
Target zone = 148.874, derived from the triangle's height projected from breakout point.
Strong confluence with liquidity hunt below before expansion move.
🎯 Target: 148.874
🛑 Stop Loss: Below 142.738 (SI Level / structural low)
🟢 Entry Trigger: Breakout above trendline + retest confirmation or Smart Money entry at FvG
This setup aligns with Elliott Wave triangle theory, often seen before sharp impulse waves. Smart Money is likely filling orders in the FvG zone before the upward expansion.
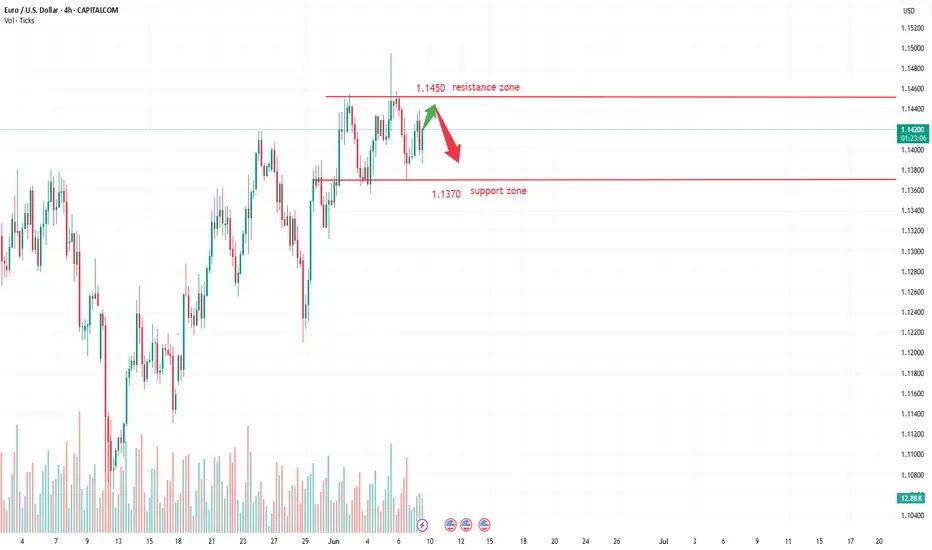
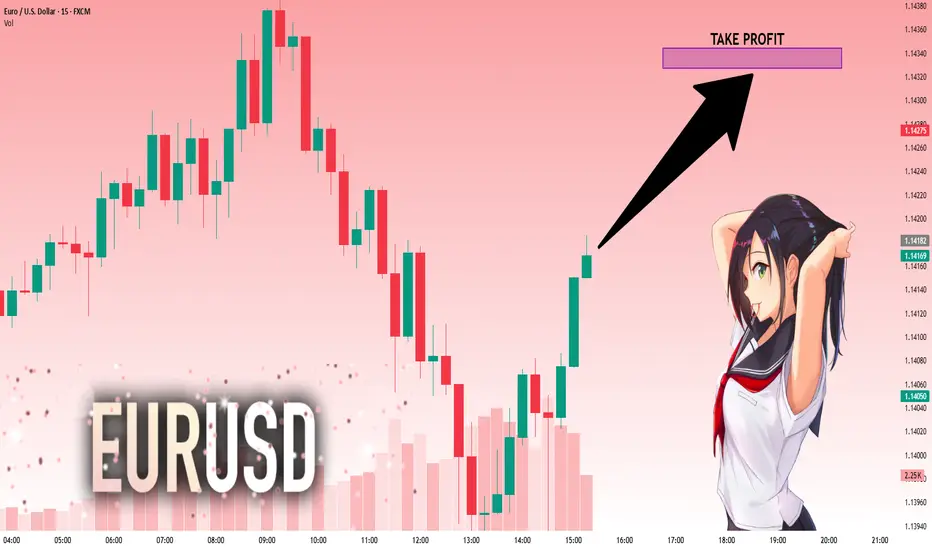
EURUSD: Breakout and Potential RetraceHey Traders, in today's trading session we are monitoring EURUSD for a selling opportunity around 1.14200 zone, EURUSD was trading in an uptrend and successfully managed to break it out. Currently is in a correction phase in which it is approaching the retrace area at 1.14200 support and resistance zone.
Trade safe, Joe.
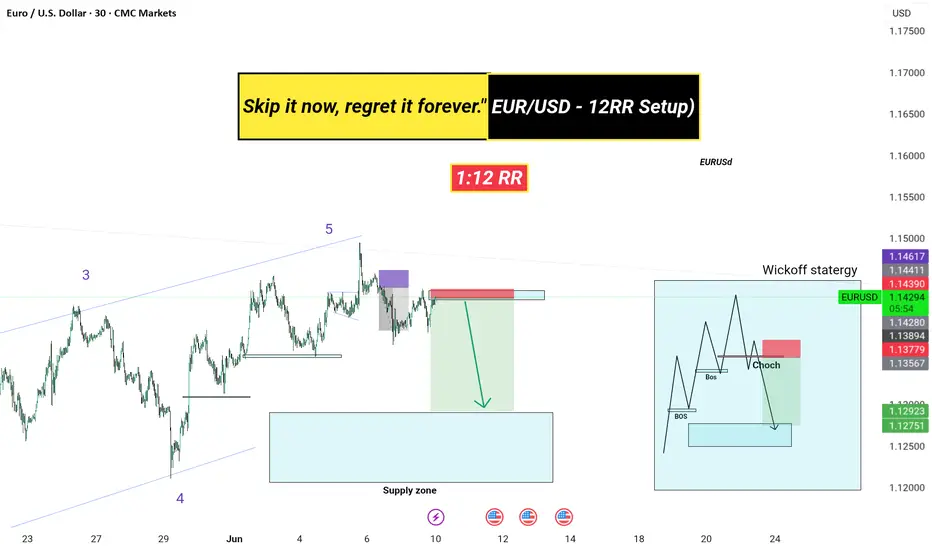
EUR/USD !!! ( 12RR Setup) Once in while opportunity : EUR/USD
Timeframe: 30M
Strategy: Elliott Wave + Wyckoff Structure
Risk-Reward: 1:12
Toolset: Supply Zone, Change of Character (ChoCh), Break of Structure (BoS), Entry Refinement
📈 Analysis Summary:
Price completed Wave 5 of the Elliott Wave structure.
Clear supply zone rejection near previous high – strong confluence.
Break of structure (BoS) confirms bearish bias.
A clean ChoCh (Change of Character) signals the shift from bullish to bearish.
Perfect Wyckoff schematic distribution playing out.
Entry taken from mitigation block with tight SL above zone.
Targeting higher-timeframe demand zone (highlighted in blue box).
💡 Key Zones:
Entry: Red mitigation zone
SL: Above local high
TP: Demand zone zone (RR 1:12)
📅 Watch this level around June 10–14 — expecting a strong impulsive move downward.
Comment ‘🔥’ if you caught this early.
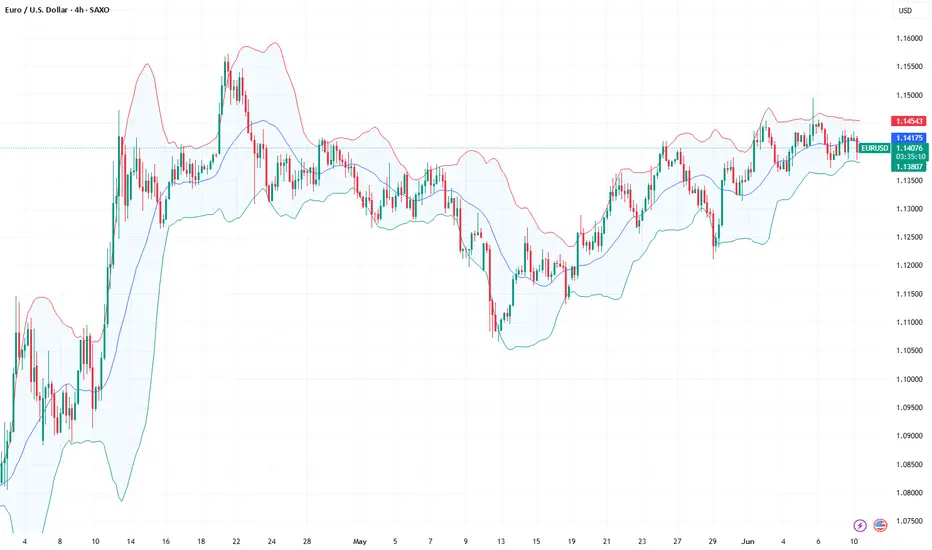
The euro is in high - level oscillation.The euro has rebounded slightly against the US dollar, trading around 1.143 during the European session, recovering some of the losses from last week's decline from around 1.1500. Fundamentally, the US dollar weakened after taking profits from the strong non - farm payrolls data last Friday, while the hawkish remarks by European Central Bank Governing Council member Kazimir provided support for the euro. From the perspective of market structure, the short - term market sentiment is slightly bullish. The key resistance levels are concentrated in the 1.1494 - 1.1500 area. If this platform is broken through and held, it may form a new bullish breakout point.
Humans need to breathe, and perfect trading is like breathing—maintaining flexibility without needing to trade every market swing. The secret to profitable trading lies in implementing simple rules: repeating simple tasks consistently and enforcing them strictly over the long term.
EURUSD: Local Bullish Bias! Long!
My dear friends,
Today we will analyse EURUSD together☺️
The recent price action suggests a shift in mid-term momentum. A break above the current local range around 1.14158 will confirm the new direction upwards with the target being the next key level of 1.14327 and a reconvened placement of a stop-loss beyond the range.
❤️Sending you lots of Love and Hugs❤️
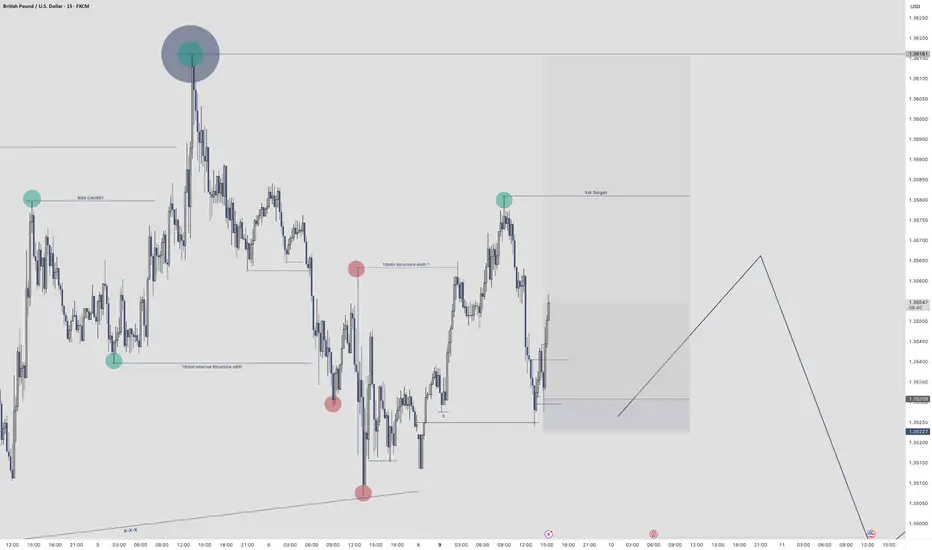
EURUSD - LongTried to upload this a while ago but for some reason TV was acting up
Im currently in a long position.
We had a 15min structure shift to the upside meaning I was looking at the most relevant place to get long.
Took the entry cased on the 1min timeframe
First target is set at 1.35810
Secondary targets I will be shooting for the HTF high

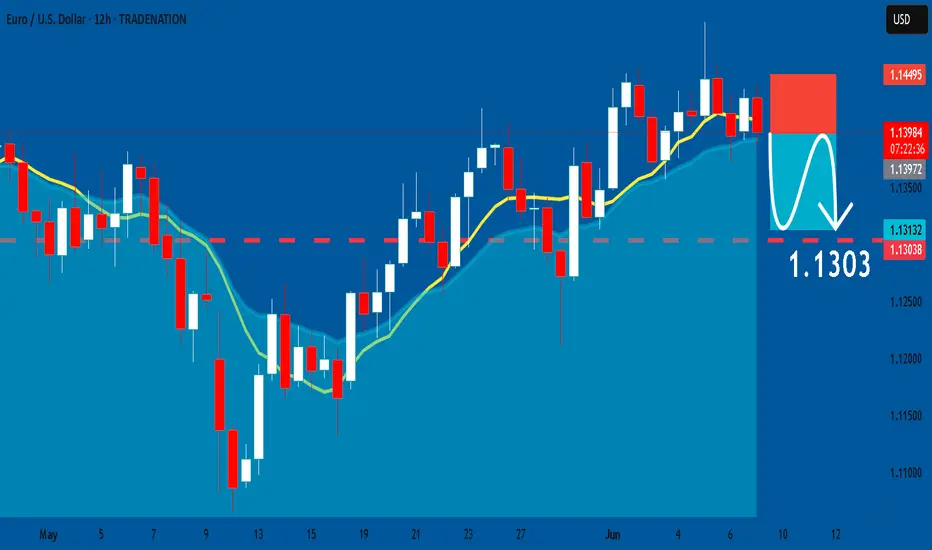
EURUSD: Short Trade Explained
EURUSD
- Classic bearish pattern
- Our team expects retracement
SUGGESTED TRADE:
Swing Trade
Sell EURUSD
Entry - 1.1398
Stop - 1.1449
Take - 1.1303
Our Risk - 1%
Start protection of your profits from lower levels
Disclosure: I am part of Trade Nation's Influencer program and receive a monthly fee for using their TradingView charts in my analysis.
❤️ Please, support our work with like & comment! ❤️
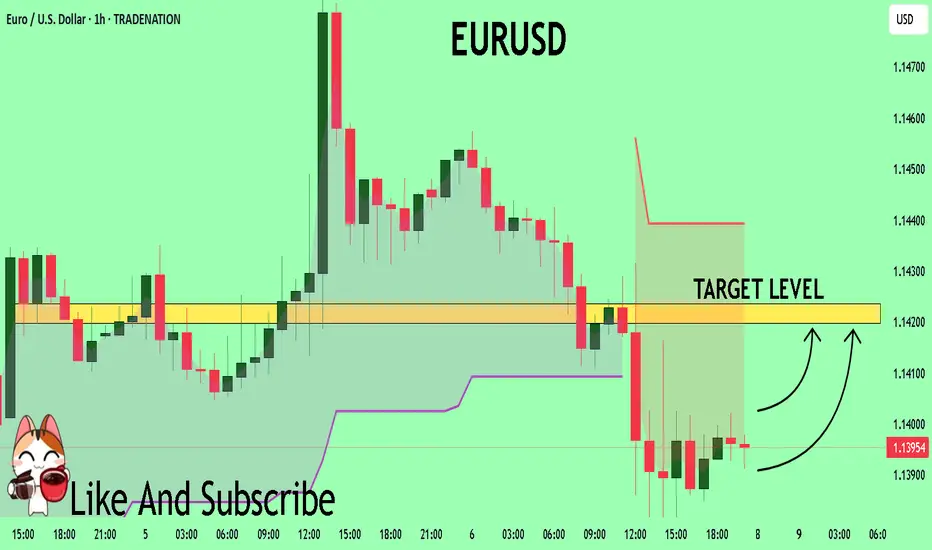
EURUSD Expected Growth! BUY!
My dear followers,
I analysed this chart on EURUSD and concluded the following:
The market is trading on 1.1395 pivot level.
Bias - Bullish
Technical Indicators: Both Super Trend & Pivot HL indicate a highly probable Bullish continuation.
Target - 1.1419
About Used Indicators:
A super-trend indicator is plotted on either above or below the closing price to signal a buy or sell. The indicator changes color, based on whether or not you should be buying. If the super-trend indicator moves below the closing price, the indicator turns green, and it signals an entry point or points to buy.
Disclosure: I am part of Trade Nation's Influencer program and receive a monthly fee for using their TradingView charts in my analysis.
———————————
WISH YOU ALL LUCK
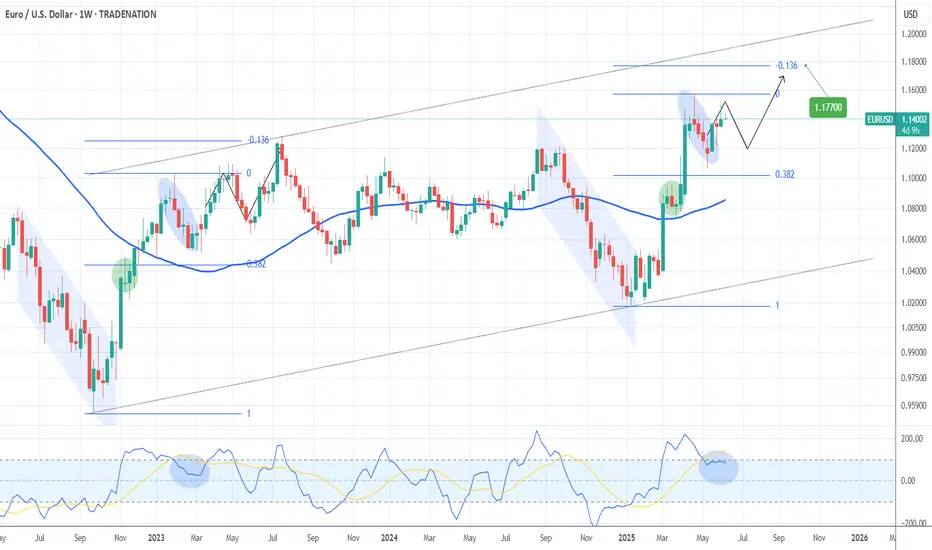
EURUSD Buy the next dip and target 1.17700The EURUSD pair has been trading within a Channel Up pattern and is currently on its 2nd Bullish Leg that hasn't yet been completed.
It does print an identical price action to the 1st Bullish Leg of the pattern, having already made its first pull-back near the 0.382 Fibonacci retracement level and is now rising for the 2nd rejection.
Our plan is to buy the next dip and target 1.17700, which is the -0.136 Fibonacci extension, the level where the 1st Bullish Leg topped.
-------------------------------------------------------------------------------
** Please LIKE 👍, FOLLOW ✅, SHARE 🙌 and COMMENT ✍ if you enjoy this idea! Also share your ideas and charts in the comments section below! This is best way to keep it relevant, support us, keep the content here free and allow the idea to reach as many people as possible. **
-------------------------------------------------------------------------------
Disclosure: I am part of Trade Nation's Influencer program and receive a monthly fee for using their TradingView charts in my analysis.
💸💸💸💸💸💸
👇 👇 👇 👇 👇 👇
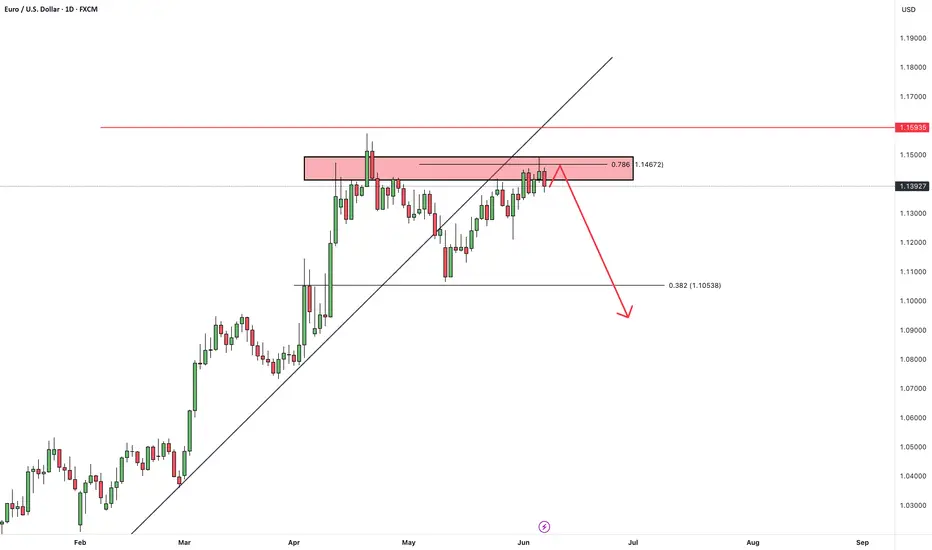
EURUSDHello Traders! 👋
What are your thoughts on EURUSD?
EURUSD remains below a key resistance zone, and at this stage, it does not appear to have enough momentum to break through.
We are watching for potential sell setups around this area.
As long as there is no daily candle close above the resistance, we expect a pullback toward the specified support level.
If a daily candle closes above the resistance zone, the bearish scenario will be invalidated, and the structure may shift.
Don’t forget to like and share your thoughts in the comments! ❤️
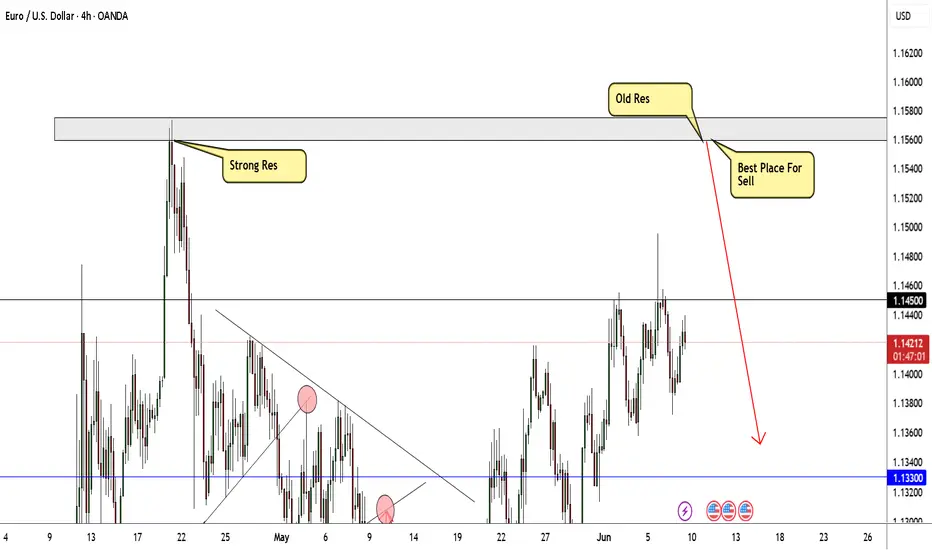
EUR/USD Best Place To Sell To Get 250 Pips , Don`t Miss It !Here is my EUR/USD Analysis and if you check the chart you will see that we have avery strong res area forced the price to go down hard last time , so i will sell this pair from the same res area , it will force the price to go down hard at least 250 pips , waiting the price to touch it and then we can sell it .
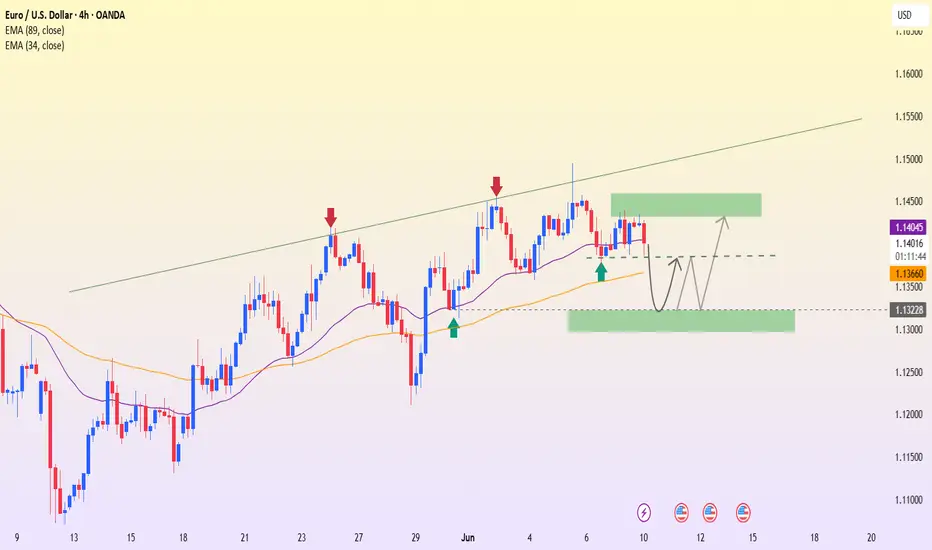
EURUSD – Upper Boundary Holds Firm, Watch for a PullbackEURUSD remains well-contained within its ascending channel, but price has repeatedly been rejected near the upper boundary around the 1.14790 zone. This highlights that profit-taking pressure near the previous high remains significant.
The current bounce from the lower boundary is unconvincing, as the recent highs are not surpassing the previous ones. While EMA34 and EMA89 are still offering support, if price moves toward 1.14790 but fails to break through, a “minor double top” pattern may emerge—raising the risk of a short-term correction.
A notable scenario would be a rejection at 1.14790, followed by a pullback toward the lower channel boundary around 1.13870. A break below this level could temporarily invalidate the short-term uptrend.
At this stage, buyers should remain patient and only look to re-enter near clear support zones. Avoid chasing entries near major resistance areas.

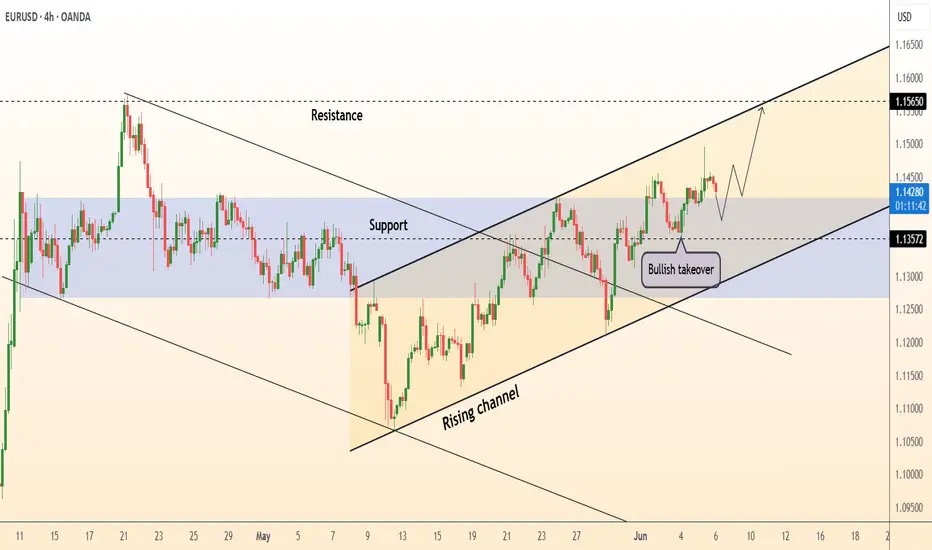
DeGRAM | EURUSD formed a bullish takeover📊 Technical Analysis
● A bullish engulfing on the grey 1.135-1.139 demand band reclaimed the inner trend-median and confirmed the base of the rising 2-month channel.
● The pull-back has just retested the broken wedge top (~1.140) as support; pattern height projects a grind to the channel mid-rail / horizontal cluster at 1.1565.
💡 Fundamental Analysis
● Ahead of the ECB’s expected “one-and-pause” 25 bp cut, EZ core CPI stayed stuck at 2.9 % y/y while soft US job-openings and lower T-bill yields narrowed the 2-yr spread, helping bids return to the euro.
✨ Summary
Long 1.137-1.140; hold above 1.135 seeks 1.156 ➜ 1.160. Invalidate on H4 close < 1.126.
-------------------
Share your opinion in the comments and support the idea with like. Thanks for your support!
Eur, Gbp & DXY Dynamics: We have reached fair valueWith equilibrium being established we are stuck in an internal liquidity range. We do expect the trending targets to be hit although we are seeing a preliminary shift in structure.
If there was anything I missed in this analysis please let me know. Share this with anyone who may be interested 🙏🏾

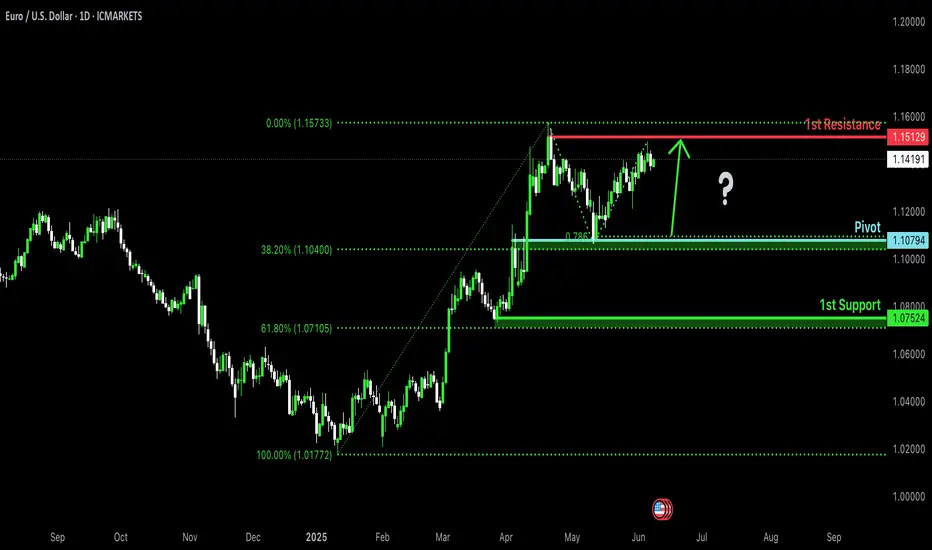
Bullish momentum to extend?The Fiber (EUR/USD) is falling towards the pivot which is a pullback support and could bounce to the 1st resistance which is also a pullback resistance.
Pivot: 1.1079
1st Support: 1.1075
1st Resistance: 1.1512
Risk Warning:
Trading Forex and CFDs carries a high level of risk to your capital and you should only trade with money you can afford to lose. Trading Forex and CFDs may not be suitable for all investors, so please ensure that you fully understand the risks involved and seek independent advice if necessary.
Disclaimer:
The above opinions given constitute general market commentary, and do not constitute the opinion or advice of IC Markets or any form of personal or investment advice.
Any opinions, news, research, analyses, prices, other information, or links to third-party sites contained on this website are provided on an "as-is" basis, are intended only to be informative, is not an advice nor a recommendation, nor research, or a record of our trading prices, or an offer of, or solicitation for a transaction in any financial instrument and thus should not be treated as such. The information provided does not involve any specific investment objectives, financial situation and needs of any specific person who may receive it. Please be aware, that past performance is not a reliable indicator of future performance and/or results. Past Performance or Forward-looking scenarios based upon the reasonable beliefs of the third-party provider are not a guarantee of future performance. Actual results may differ materially from those anticipated in forward-looking or past performance statements. IC Markets makes no representation or warranty and assumes no liability as to the accuracy or completeness of the information provided, nor any loss arising from any investment based on a recommendation, forecast or any information supplied by any third-party.
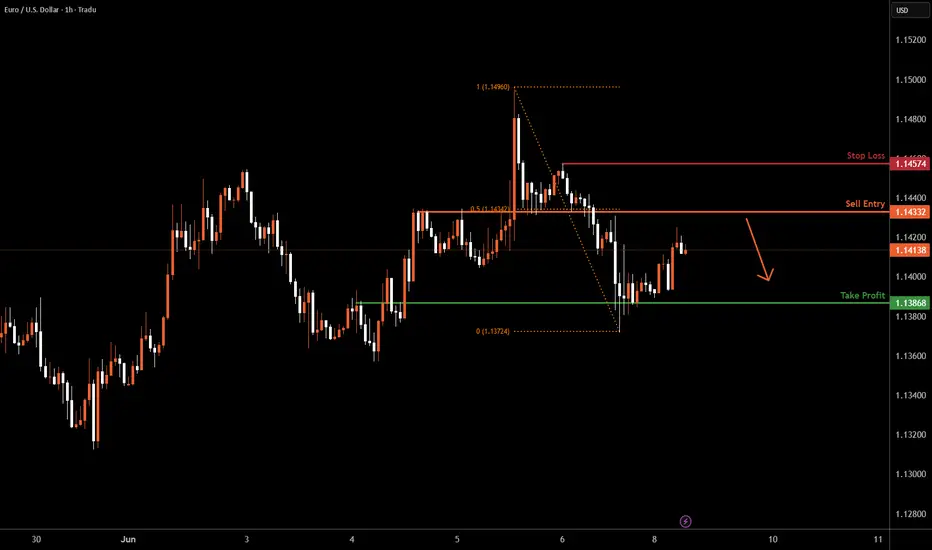
EURUSD H1 I Bearish Reversal Based on the H1 chart analysis, we can see that the price is rising toward our sell entry at 1.1433, which is a pullback resistance aligning with a 50% Fibo retracement.
Our take profit will be at 1.1386, an overlap support level.
The stop loss will be placed at 1.1457, a swing-high resistance level.
High Risk Investment Warning
Trading Forex/CFDs on margin carries a high level of risk and may not be suitable for all investors. Leverage can work against you.
Stratos Markets Limited (tradu.com/uk ):
CFDs are complex instruments and come with a high risk of losing money rapidly due to leverage. 63% of retail investor accounts lose money when trading CFDs with this provider. You should consider whether you understand how CFDs work and whether you can afford to take the high risk of losing your money.
Stratos Europe Ltd (tradu.com/eu ):
CFDs are complex instruments and come with a high risk of losing money rapidly due to leverage. 63% of retail investor accounts lose money when trading CFDs with this provider. You should consider whether you understand how CFDs work and whether you can afford to take the high risk of losing your money.
Stratos Global LLC (tradu.com/en ):
Losses can exceed deposits.
Please be advised that the information presented on TradingView is provided to Tradu (‘Company’, ‘we’) by a third-party provider (‘TFA Global Pte Ltd’). Please be reminded that you are solely responsible for the trading decisions on your account. There is a very high degree of risk involved in trading. Any information and/or content is intended entirely for research, educational and informational purposes only and does not constitute investment or consultation advice or investment strategy. The information is not tailored to the investment needs of any specific person and therefore does not involve a consideration of any of the investment objectives, financial situation or needs of any viewer that may receive it. Kindly also note that past performance is not a reliable indicator of future results. Actual results may differ materially from those anticipated in forward-looking or past performance statements. We assume no liability as to the accuracy or completeness of any of the information and/or content provided herein and the Company cannot be held responsible for any omission, mistake nor for any loss or damage including without limitation to any loss of profit which may arise from reliance on any information supplied by TFA Global Pte Ltd.
The speaker(s) is neither an employee, agent nor representative of Tradu and is therefore acting independently. The opinions given are their own, constitute general market commentary, and do not constitute the opinion or advice of Tradu or any form of personal or investment advice. Tradu neither endorses nor guarantees offerings of third-party speakers, nor is Tradu responsible for the content, veracity or opinions of third-party speakers, presenters or participants.
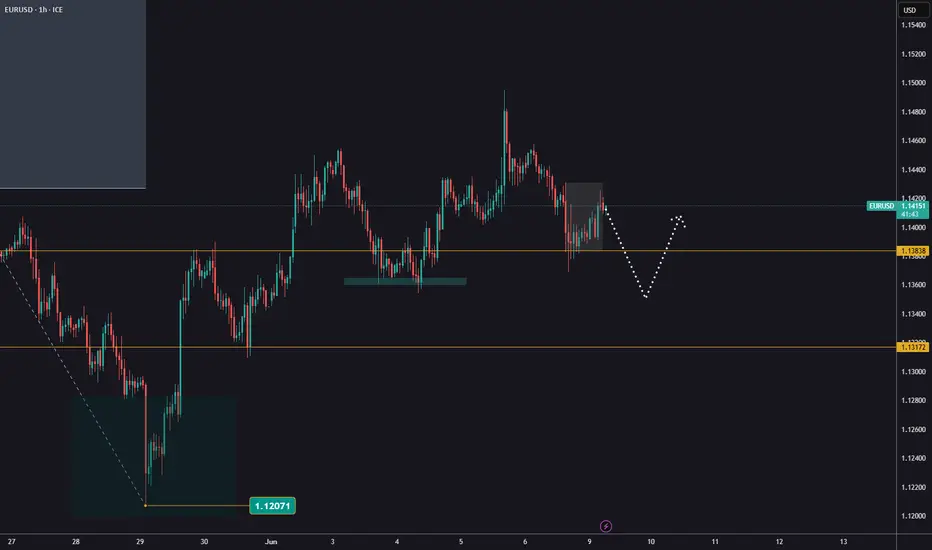
Correction on EURUSDAfter Friday’s news, EURUSD reached 1,1368.
Make a note of the news candle and wait for a breakout.
If the retracement continues, the next key support level is 1,1317.
Important USD-related news is expected this Wednesday.
Watch for potential trend continuation setups and avoid rushing into new trades.
Despite some difficulties, EUR is still in an uptrendThe European Central Bank cut interest rates by 25 basis points as expected and said inflation was close to its medium-term target of 2%. Trump's tariff policies have loosened financial conditions, suggesting further easing is likely.
This dovish stance has put some pressure on the euro. Preliminary eurozone CPI data for May showed that inflationary pressures slowed more than expected, dragging the euro down. Germany’s manufacturing PMI for May was weaker than expected, suggesting further contraction in the manufacturing sector; France’s services PMI was better than expected, but still in contraction territory. Eurozone economic data has been mixed. European Central Bank President Lagarde said the monetary easing cycle was coming to an end, boosting market confidence in the euro over the medium term.
But caution will still be needed about the impact of Trump’s tariff policies on the global economy. While the ECB believes trade tensions have eased, the eurozone is not completely out of the woods. If future economic data remains weak, the euro could face downward pressure.
On the daily chart of OANDA:EURUSD after receiving support from the 0.236% Fibonacci retracement level with horizontal support at 1.12038, the recovery momentum has created a significant increase. Specifically, the increase has tested the levels of 1.14744 and 1.14212, please note that in the previous publication about EUR/USD, these levels are also the nearest resistance at present.
However, in terms of the overall technical picture, EUR/USD is still in a bullish trend with a break above 1.14744 opening the door for a new bullish cycle with a short-term target of 1.15720.
Intraday, the bullish outlook for EUR/USD will be highlighted again by the following price points.
Support: 1.13788 – 1.12422
Resistance: 1.14212 – 1.14744