Nato and EU meetings could lift EUR/USD further Despite believing the euro is currently overvalued, Bank of America prefers it to the US dollar, Swiss franc and Japanese yen.
Bank of America thinks the EUR could be supported leading up to the NATO and EU summits (June 24-27) especially if defense spending is confirmed. German infrastructure spending might also be expected to support the euro.
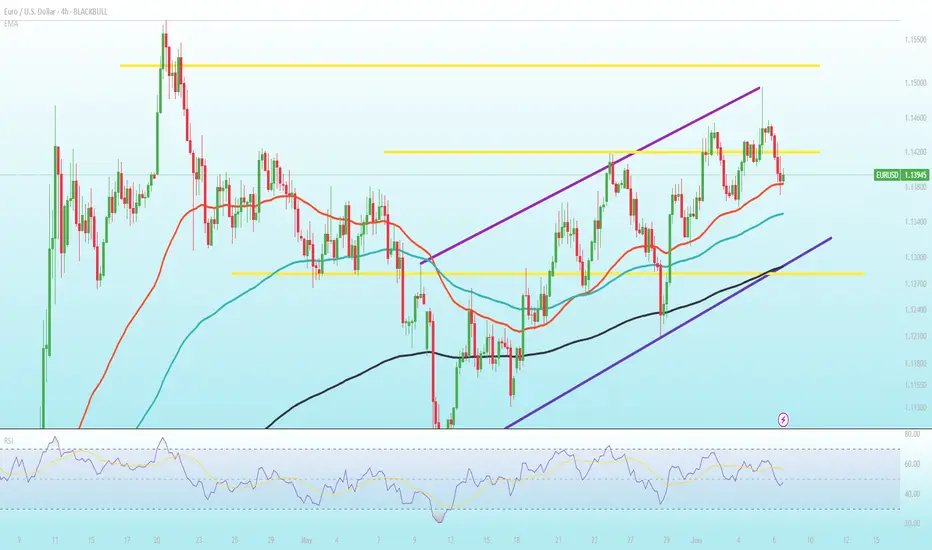
The EUR/USD holds above the 20- and 50-period EMAs at 1.1380–1.1360 and is comfortably above the 200-period EMA. The recent pull-back from 1.14930 has eased momentum slightly.
A close above 1.1420 could target 1.1470, then 1.1520. A sustained break below 1.1280 could neutralise the bullish bias.
Eurusd-3
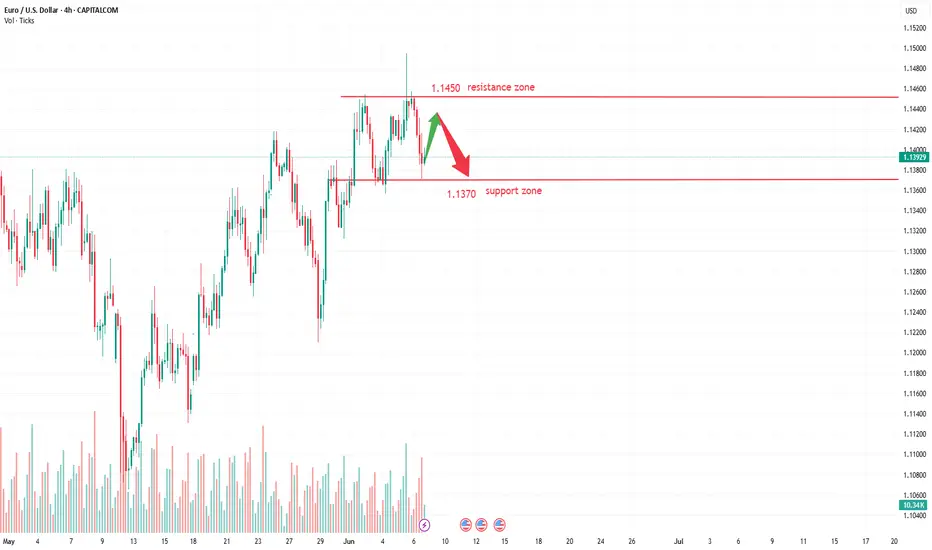
Week of 6/8/25: EU AnalysisPrice has reached the extreme of daily bearish structure and we can see a rejection of the 4h latest push to make another high. We're following 1h internal bearish structure to at least take out the weak low, thus making 1h structure bearish and following that to the 4h extreme swing low.
Major news:
Core CPI - Wednesday

NQ tumbles?Good day traders, I don't know why but I get a bit scared when it comes to analyzing NQ. I always doubt myself with it.
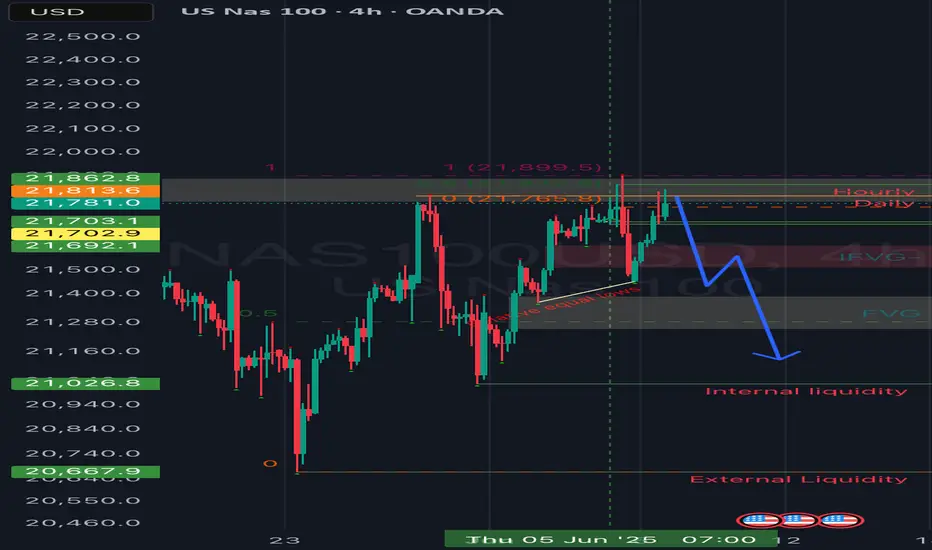
On the weekly TF price is trading inside an order block and for the past two weeks price has visited the order block two times. In the two times that price revisited the order block it failed to close above the midpoint indicating the strength of the order block, going into the new week I am going to use the discount zone of the OB+ as my resistance.
On the daily TF before I say much, THERE IS A GAP, and price did not trade to it since opening high on the 12th May. That gap is my target and I want to see price go and fill that volume imbalance as ICT calls it.
Still on the daily TF...when you read price for past two weeks on NQ, you'll quickly come to a realization that price has been expanding higher since Tuesday 3rd June, but expanding to where?...well liquidity resting above the high of the candle booked on the 29th of May.
Now on the 4 hour TF things are opening up and price is becoming clearer and it goes to show the importance of multi time frame analysis. The lows of Tuesday and Thursday make the relative equal lows that are shown on the chart. The internal liquidity shown below is my short term target or TP1. The red triangle represents that 4H inverse FVG and once price is trading below the inverse any movement inside that inverse should show weakness!
EURUSD: Weekly Overview June 9th 2025Hello Traders,
US CPI news is really important and could change the direction of the markets. But I think the Pair would keep its bullish trend for next week too.
*********************************************************************
The indicated levels are determined based on the most reaction points and the assumption of approximately equal distance between the zones.
Some of these points can also be confirmed by the mathematical intervals of Murray.
You can enter with/without confirmation. IF you want to take confirmation you can use LTF analysis, Spike move confirmation, Trend Strength confirmation and ETC.
SL could be placed below the zone or regarding the LTF swings.
TP is the next zone or the nearest moving S&R, which are median and borders of the drawn channels.
*******************************************************************
Role of different zones:
GREEN: Just long trades allowed on them.
RED: Just Short trades allowed on them.
BLUE: both long and short trades allowed on them.
WHITE: No trades allowed on them! just use them as TP points

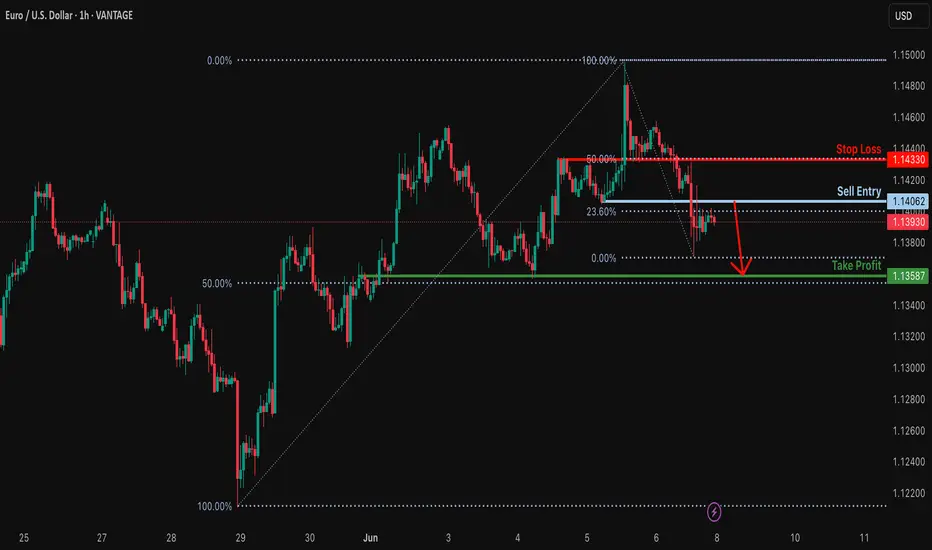
Bearish drop?EUR/USD is rising towards the resistance level which is a pullback resistance that lines up with the 23.6% Fibonacci retracement and could drop from this level to our take profit.
Entry: 1.1406
Why we like it:
There is a pullback resistance level that lines up with the 23.6% Fibonacci retracement.
Stop loss: 1.1433
Why we like it:
There is a pullback resistance level that lines up with the 50% Fibonacci retracement.
Take profit: 1.1358
Why we like it:
There is a pullback support level that aligns with the 50% Fibonacci retracement.
Enjoying your TradingView experience? Review us!
Please be advised that the information presented on TradingView is provided to Vantage (‘Vantage Global Limited’, ‘we’) by a third-party provider (‘Everest Fortune Group’). Please be reminded that you are solely responsible for the trading decisions on your account. There is a very high degree of risk involved in trading. Any information and/or content is intended entirely for research, educational and informational purposes only and does not constitute investment or consultation advice or investment strategy. The information is not tailored to the investment needs of any specific person and therefore does not involve a consideration of any of the investment objectives, financial situation or needs of any viewer that may receive it. Kindly also note that past performance is not a reliable indicator of future results. Actual results may differ materially from those anticipated in forward-looking or past performance statements. We assume no liability as to the accuracy or completeness of any of the information and/or content provided herein and the Company cannot be held responsible for any omission, mistake nor for any loss or damage including without limitation to any loss of profit which may arise from reliance on any information supplied by Everest Fortune Group.
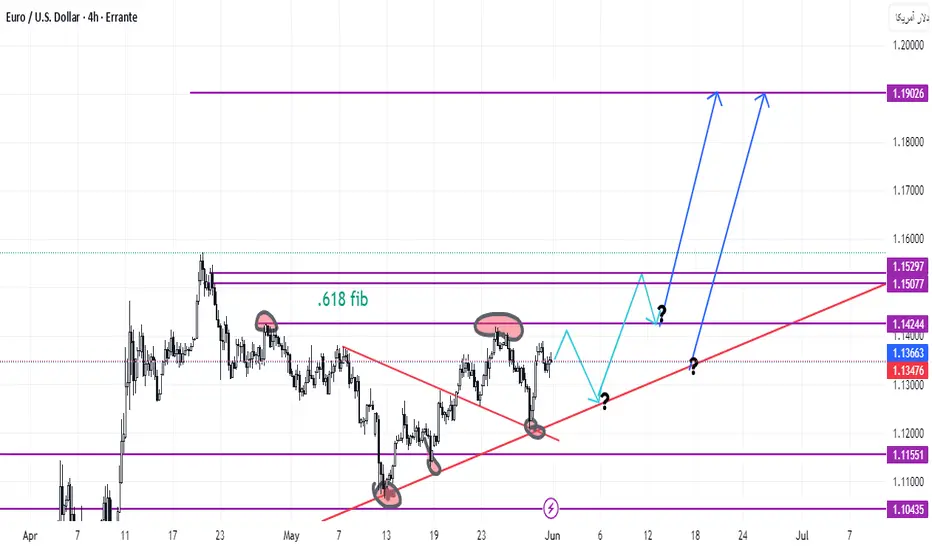
eurusdContinuing the previous analysis
EUR/USD seems to be very loyal to the daily trendline.
I think there is a possibility of reaching the trendline again and with the upcoming news it could break the ceiling and start an uptrend.
Skeptic | This Week's Most Profitable Setups: Gold, Forex & SPX!hey, traders, it’s Skeptic ! 😎 Our last watchlist was straight fire, racking up some sweet profits with tons of setups. This week’s looking just as juicy, so stick with me to catch these killer opportunities! 🚖 Welcome to my Weekly Watchlist, where I lay out the markets I’m trading with active triggers—forex pairs, commodities, and CFD indices. No FOMO, no hype, just pure reasoning to keep your trades sharp. Let’s jump in! 📊
DXY (Dollar Index)
Let’s kick off with DXY, ‘cause getting this right makes analyzing other indices and pairs a breeze. After multiple failed attempts to break support at 98.8 , it’s still ranging. This is a monthly support, so confirmation of a break needs to come on a monthly or at least weekly chart. Personally, I’m betting it’ll bounce from here. A break above 99.36 gives early confirmation of a rise, but the real deal is breaking resistance at 100 —then you can short USD pairs like EUR/USD . If 98.8 gives way, look for longs, but this monthly zone is tough, so expect some chop! 😬
EURX
EURX seems to be in a weak upward channel. A break above 1063 could push us to 1071 . On the flip side, breaking the channel’s midline at 1058 might drag us to the floor or even support at 1049 . So, our EURX game plan is clear.
Watchlist Breakdown
Let’s hit the watchlist, starting with XAU/USD (Gold ).
Triggers here are tricky, but I cloned last week’s downward channel and placed it above—this trick often gives us solid setups. If we bounce off the channel’s floor, a break above resistance at 3340 opens a long. For shorts, I don’t have a trigger yet since the market’s already dumped. If we form a 1-hour range, a break below its floor could trigger a short targeting 3249 or the previous channel’s midline.
Now, XAG/USD (Silver)
—no triggers this week. Our long trigger from last week’s analysis at 33.68 smashed it, spiking 8%! 🎉 That’s a lock even Bitcoin traders would drool over, but in Skeptic Lab :)
Next, EUR/USD.
The long trigger is set at a break above resistance at 1.14555 , which lines up with the DXY support break I mentioned. Heads-up: this trade won’t be easy. Reduce risk ‘cause we’re in for a big fight at this level—wild swings and tight stop losses get hunted fast. Stay sharp! 😤
GBP/USD Update
My GBP/USD long got stopped out, so let’s break it down. I went long after a resistance break, with crazy uptrend momentum and RSI hitting overbought (which I see as a long confirmation). Everything looked dope except my stop loss placement. The prior move was so sharp that my stop had to be wide, tanking my R/R. It hit the box ceiling target but then dumped, nailing my stop. Lesson? Either jump in before the main momentum or let the move play out and skip it. Mid-move entries with big stops? Recipe for pain...
SPX 500
Our SPX 500 long trigger from breaking the box ceiling already fired and seems to have pulled back. My target’s 6128.55 , and my open position has a stop loss below 5952.51. If you missed last week’s trade, a new trigger could be a 1-hour resistance break at 6014.20 . If you’re already long, no need to double up.
Final Note
my max risk per trade is 1%, and I suggest you stick to that or lower. I’m cooking up a Money management guide soon, diving deep into why it’s the key to outpacing 90% of traders and boosting your odds of consistent profits. Stay tuned! 🚨 No FOMO, and have an awesome week!
💬 Let’s Talk!
If this watchlist lit a spark, hit that boost—it means a ton! 😊 Got a pair or setup you want me to tackle? Drop it in the comments. Thanks for rolling with me—keep trading smart! ✌️

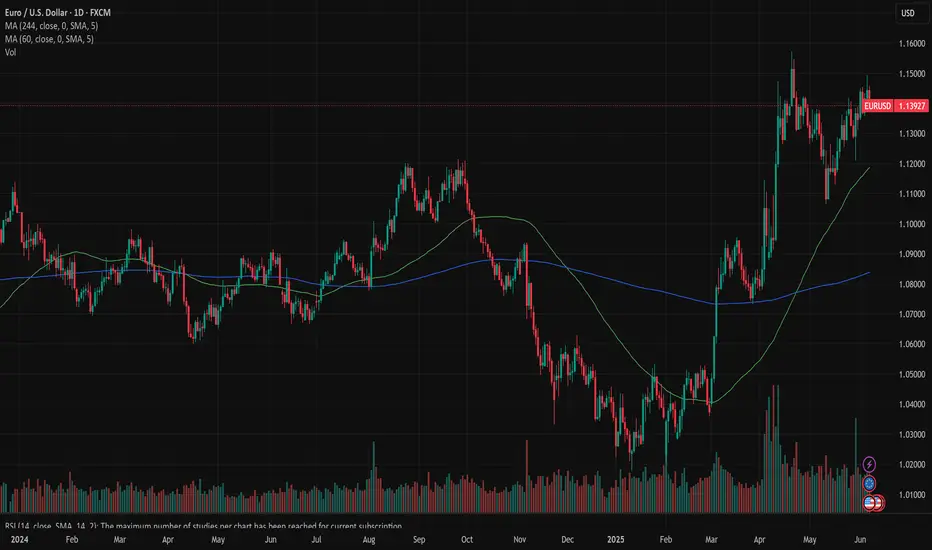
Economic data in the eurozone was mixed.The EUR/USD trended higher in a volatile fashion this week, gaining 0.41% on a weekly basis. It briefly reached a six-week high of 1.1495 on Thursday but retreated to 1.1395 on Friday due to a stronger US dollar. Nevertheless, the euro showed overall robust performance during the week. Analysts were not surprised by the European Central Bank's (ECB) rate cut, but they remained cautious about the impact of Trump's tariff policies on the global economy. Although the ECB believes trade tensions have eased, analysts argue that the eurozone has not fully escaped risks. If future economic data continues to be weak, the euro may face downward pressure.
Humans need to breathe, and perfect trading is like breathing—maintaining flexibility without needing to trade every market swing. The secret to profitable trading lies in implementing simple rules: repeating simple tasks consistently and enforcing them strictly over the long term.
EURUSD - Where to next?I managed to catch a nice 1:21 RR on EU
I am now triggered into a long position taking price back up to the previous highs and potentially beyond.
Price is at a very key area on the HTF and we are at a key area of Supply.
As price sits I'm still expecting it to continue higher, however, if we break the 4HR orderflow to the downside there is a strong possibility price will move lower.
We will keep an eye on this one this week!
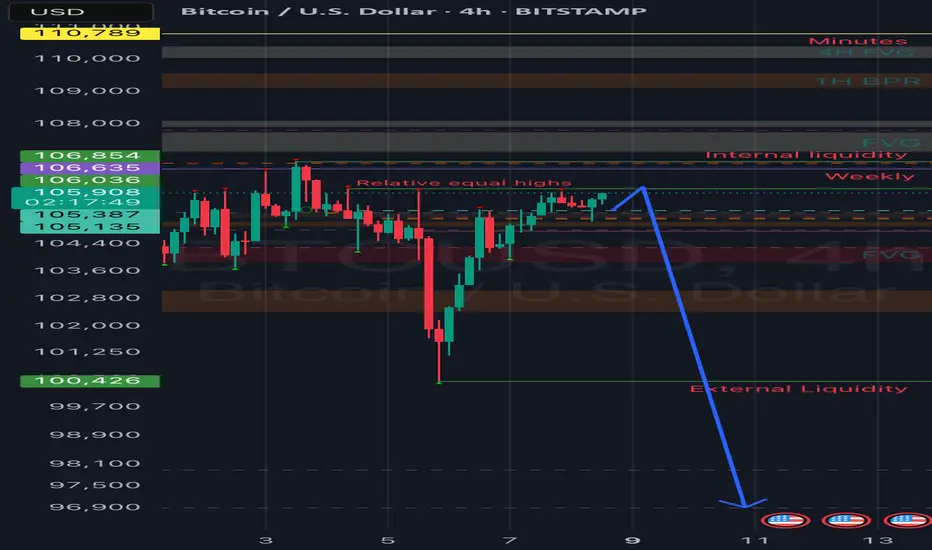
Bitcoin plummets!!Good day traders, I am back with yet another update on BTC/USD. My last update on bitcoin what I was expecting price to do unfortunately did not happen as price was very weak, I had a FVG(SIBI) that I really wanted price to revisit and the two price levels that make up the SIBI are 107752 and 107149.
Now that both our sellside liquidity were taken does that mean price is now gonna look for the buyside liquidity? My honest opinion is I don't think because I said 97k is insight and I believe it can still happen and it will according to my HTF perspective.
On the daily TF we have clear sight of relative highs that we wanna see price take and that might happen today but my short term objective is the high that was booked on Tuesday. That Tuesday's candlestick has a very large wick and from my time learning with ICT's content, wicks contain a lot of price data that can be used either for entries or exits.
4H- Here we had a shift in market structure lower on Thursday but price has been bullish ever since the shift happened. On this respective TF we have equal highs too, and ICT teaches us to always focus our attention on them mainly because price looks for liquidity and imbalances on the 4 hour TF...should we look closely on the left of our screens or chart, there is an order block from the wick I mentioned above. Again what are the rules of an order block?..
FROM TOMORROW PRICE WILL START TO PLUMMET!!
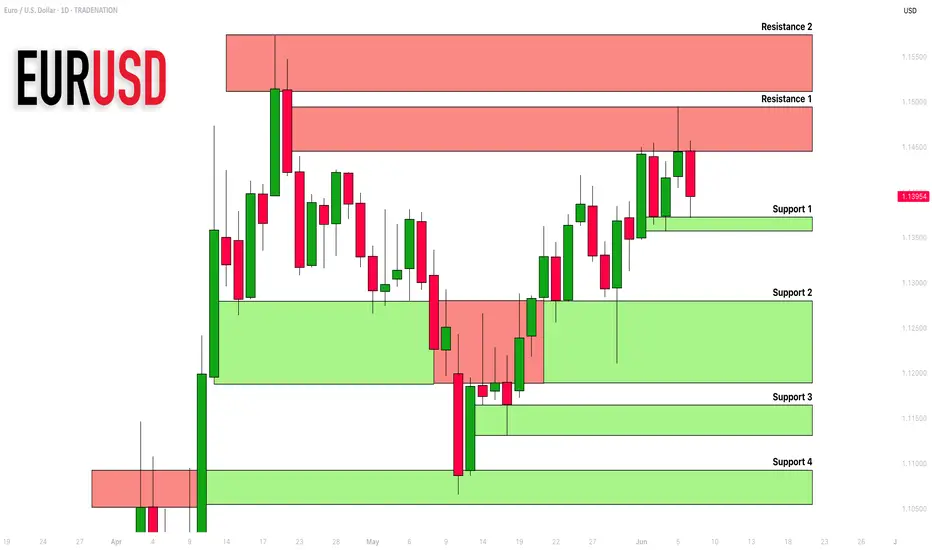
EURUSD: Support & Resistance Analysis For Next Week 🇪🇺🇺🇸
Here is my latest structure analysis
and important supports and resistances for EURUSD
for next week.
Consider these structures for pullback/breakout trading.
❤️Please, support my work with like, thank you!❤️
I am part of Trade Nation's Influencer program and receive a monthly fee for using their TradingView charts in my analysis.
EUR/USD Analysis – Possible Scenarios🔹 Price is currently trading around 1.1421, consolidating between key supply and demand zones.
🔴 Supply Zone (Order Block 1H): 1.14360 – 1.14590
📌 Strong bearish reaction from this resistance area. First scenario: rejection from this OB and a move downward.
🔵 Demand Zone (Order Block 4H): 1.13050 – 1.13430
✅ If price fails to break the resistance, we could see a retracement to this OB. Bullish reaction here may offer long opportunities.
🟢 Fair Value Gap (FVG 1H): 1.11800 – 1.12220
📉 If OB 4H fails to hold, price could drop into this FVG area – a high-liquidity zone for potential reversal.
📊 Possible Scenarios:
1️⃣ Break and hold above OB 1H → price may extend toward next OB zone at 1.15150 – 1.15400
2️⃣ Rejection from OB 1H → pullback to OB 4H → possible long setup if confirmed
3️⃣ Break below OB 4H → deeper move into FVG 1H
‼️ Avoid premature entries – wait for valid confirmations.
🔍 Insight by ProfitaminFX
If this outlook aligns with your bias, or if you see it differently, feel free to share your perspective in the comments. Let’s grow together 📈

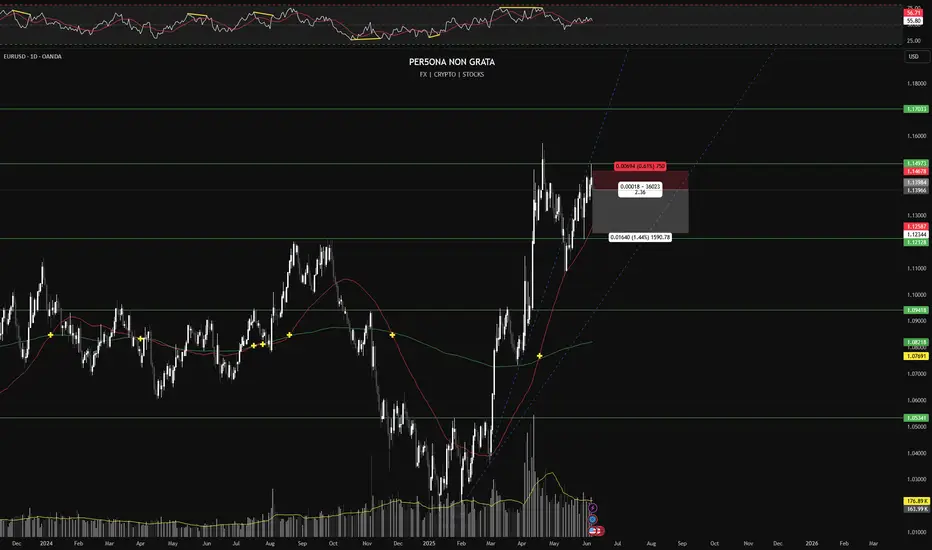
SHORT | EUR/USD | 1DMacro: Dollar strength likely as uncertainty grows from USD economic data; ECB expected to trim dovish tone next week.
Structure: In consolidation after reaching envelope top (~1.1494); forecasting downside to 1.1387–1.1400.
Trigger & Execution:
• Entry: Short on break below 1.1380
• Stop: 1.14678
• Target: 1.12344
• R:R: ~1:2.36
Rationale: Profit-taking above envelope top supports pullback; structural risk limit remains.
EURUSD: heading toward double-top?The jobs data were in the spotlight of the US market during the previous week. The JOLTs job openings in April reached 7,391M, a bit hotter from market forecast of 7,10M. The Non-farm Payrolls in May added 139K new jobs, which was modestly higher from the forecasted 130K. The unemployment rate remained unchanged in May at the level of 4,2%. The average hourly earnings were higher by 0,4% for the month and 3,9% for the year. As for other posted data, the US ISM Manufacturing PMI for May was standing at 48,5, modestly below market estimate of 49,5. The ISM Services in May were standing at 49,9, lower from estimated 52,3.
Previous week on the European market was marked with an eighth rate cut by 25bps, bringing the reference rate to 2%. Potential further rate cuts will continue to be data-driven. The ECB also cut its inflation forecast till the end of this year to 2%, from 2,3% forecasted previously. At the same time, the posted flash inflation rate in the Euro Zone in May is 1,9% on a yearly basis, which was below market estimate of 2%. The core inflation continues to be a bit elevated, standing at the level of 2,3% y/y in May. EuroZone inflation in May was 0% compared to the previous month. The Producers Price Index in the Euro Zone in May was down by -2,2% for the month, and 0,7% on a yearly basis. The balance of trade in Germany in April had a surplus of euro 14B, which was significantly lower from estimated euro 20,2B.
During the previous week the currency pair was moving relatively slowly, within a short range. Fundamentals were shaping the investors sentiment. One one side, the ECB new cut of reference rates, while on the other side were relatively stable jobs data for the US market. The eurusd spent the previous week in a range between 1,1340 and 1,1450. There was a short move toward the 1,1490 on Thursday, but the market was not willing to test the 1,15 level on this occasion. Based on moves, the market is still not ready to move away from 1,14 lines. The RSI continues to move above the level of 50, indicating again that the market is not ready to take the path toward the oversold market side. The MA50 continues to diverge from its MA200 counterpart, without an indication of a potential change of course in the coming period.
The week ahead is bringing US inflation data for May as well as inflation expectations from the University of Michigan survey. In case of some negative movements in this segment, the market reaction might be triggered. In this case it could be expected further weakening of the US Dollar against Euro, and a trigger for testing of the 1,15 level. Highs from April this year at 1,1570 might easily become the market target. However, if May inflation holds at levels expected by the market, which could be the most likely scenario, then some short term straightening of US Dollar might take place. The first stop would certainly be the 1,14 level, while the next one stands at 1,1275. It is interesting to mention higher potential for double top formation in the technical analysis, which eurusd is currently modestly forming. In case that the double top is triggered in the coming week or two, then the next level for eurusd could be 1,12 level, where highs from September 2024 stands. However, this scenario, if it occurs, could be revealed within the next few weeks.
Important news to watch during the week ahead are:
EUR: Industrial Production in April in the EuroZone, final inflation rate in May for Germany
USD: Inflation rate in May, Producers Price Index in May, University of Michigan Consumer Sentiment preliminary for June.
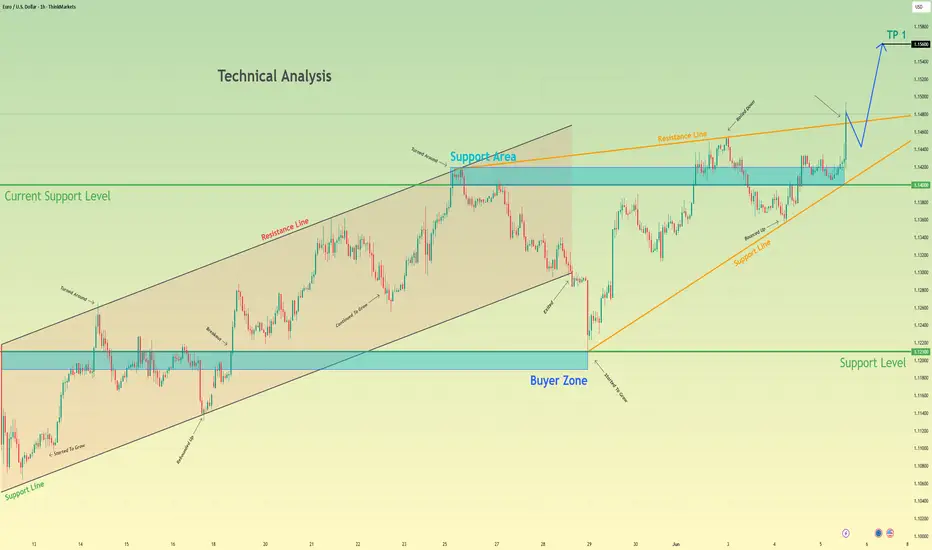
Euro will correct a little and then continue to move up nextHello traders, I want share with you my opinion about Euro. Observing this chart, we can see how the price entered to upward channel, where it at once dropped from the resistance line to the support line and then started to grow. In a short time price rose to the 1.1210 level, broke it, and even rose a little more, but soon turned around and declined to the support line of the channel. Then the Euro made an upward impulse, and then broke the 1.1210 level one more time and continued to grow inside the channel. Later price reached the resistance line of the channel and then corrected, after which, in a short time rose to the support area, breaking the 1.1400 level. But soon the price turned around and dropped to the 1.1210 level, thereby exiting from channel. Next, Euro continued to grow inside the wedge, where it rose to the current support level and soon broke it. After this, the price rose to the resistance line of the wedge and then corrected, after which it made an upward impulse. Price exited from the wedge, and now I think that the Euro can make a correction, after the rise, and then continue to grow next. That's why I set my TP at 1.1560 points. Please share this idea with your friends and click Boost 🚀
Disclaimer: As part of ThinkMarkets’ Influencer Program, I am sponsored to share and publish their charts in my analysis.
EURUSD: Bullish Continuation is Expected! Here is Why:
Our strategy, polished by years of trial and error has helped us identify what seems to be a great trading opportunity and we are here to share it with you as the time is ripe for us to buy EURUSD.
Disclosure: I am part of Trade Nation's Influencer program and receive a monthly fee for using their TradingView charts in my analysis.
❤️ Please, support our work with like & comment! ❤️
