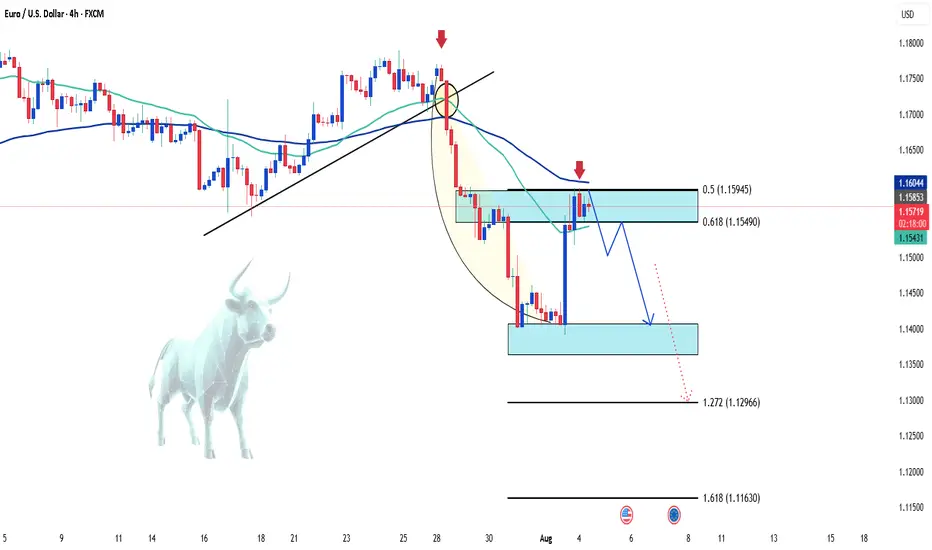
EURUSD - Major resistance ahead with the fair value gaps!The EUR/USD pair remains firmly within a prevailing downtrend, characterized by a consistent pattern of lower highs and lower lows. This bearish momentum has resulted in the formation of several significant Fair Value Gaps (FVGs) on the 4-hour chart, which now act as potential resistance zones on any pullbacks. These FVGs not only coincide with important technical structures, but also align with key Fibonacci retracement levels, adding confluence to their strength. In the analysis below, we’ll walk through these zones and discuss the most probable scenarios based on the current price action.
First resistance zone
The first major resistance lies within the 4-hour FVG in the 1.1600 to 1.1650 region. This zone coincides with the golden pocket, which is formed between the 0.618 and 0.65 Fibonacci retracement levels. This overlap strengthens the likelihood of price reacting bearishly here, should the market manage to retrace upwards into this area. Given the strong downward momentum, this level may be enough to trigger a continuation to the downside, making it a critical area to monitor for rejection signals.
Second resistance zone
The second key resistance is found in the upper 4-hour FVG, ranging from 1.1690 to 1.1750. This zone aligns closely with the 0.786 Fibonacci retracement level and marks a former support zone that has now been broken, indicating a potential structure break. Price returning to this level would be retesting the underside of broken market structure, which often acts as a powerful resistance area. Given this, a deeper pullback into this region may serve as a trap for late buyers and potentially offer a high-probability short setup.
Bullish bounce area
On the bullish side, the most relevant support is currently found within the 1-hour FVG that was formed last Friday, during the release of the U.S. unemployment rate data. This zone is positioned below current price levels and is likely to act as a strong short-term demand area. It is reasonable to anticipate a bullish reaction from this zone if the market retraces downward, making it a favorable area to seek long opportunities for a potential move into the higher resistance levels described above.
Final thoughts
While the broader trend remains bearish, short-term bullish bounces are likely within defined fair value gaps. Traders should keep a close eye on the 1-hour FVG for possible long entries, while watching the 4-hour FVGs, particularly those aligning with key Fibonacci levels, for signs of bearish continuation. If resistance holds firm, the EUR/USD could resume its downtrend, but any structural breaks or sustained closes above these levels would challenge that view. As always, price action around these zones should guide the final decision-making.
-------------------------
Disclosure: I am part of Trade Nation's Influencer program and receive a monthly fee for using their TradingView charts in my analysis.
Thanks for your support. If you enjoyed this analysis, make sure to follow me so you don't miss the next one. And if you found it helpful, feel free to drop a like 👍 and leave a comment 💬, I’d love to hear your thoughts!
Eurusd-3

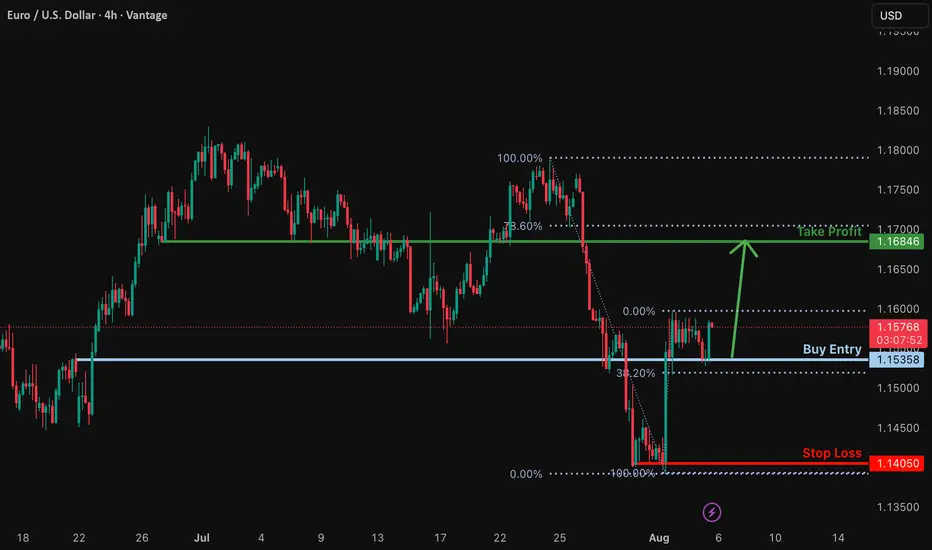
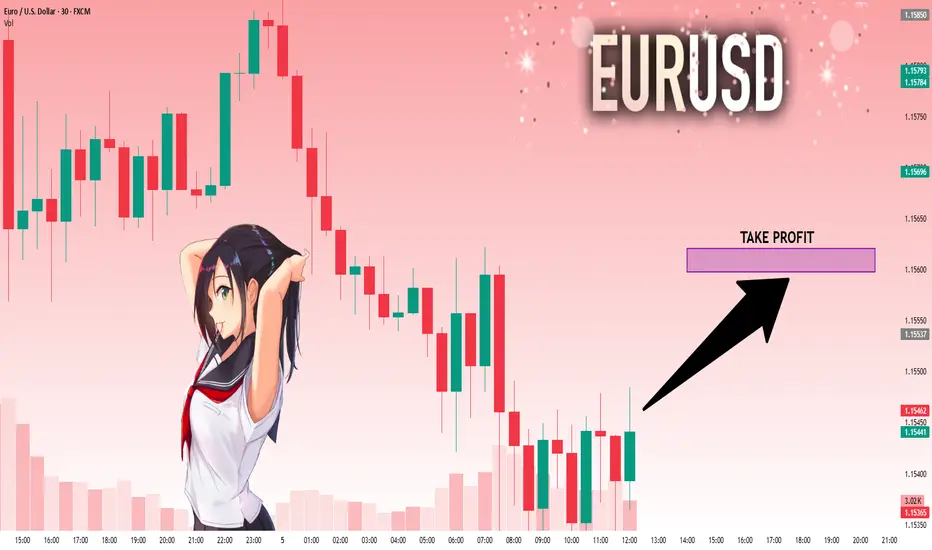
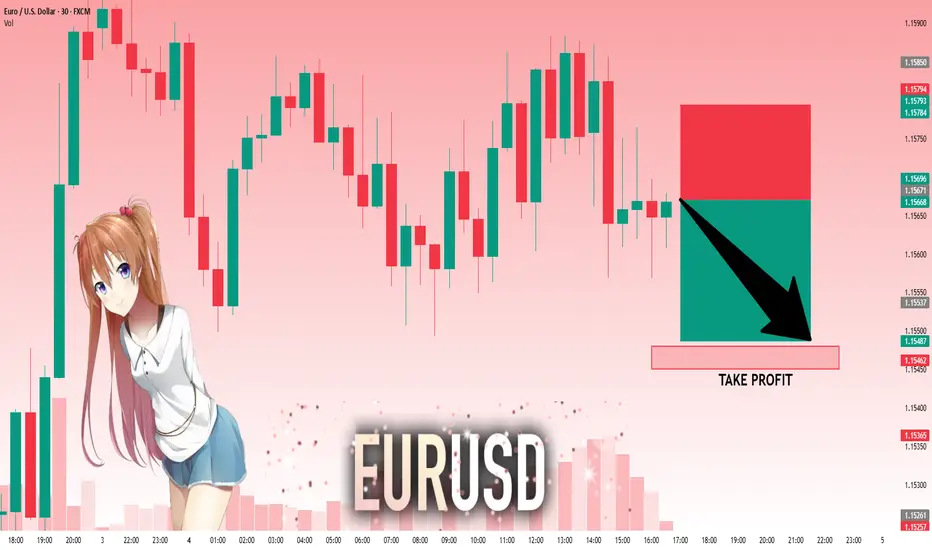
Bullish rise?EUR/USD has bounced off the support level, which is a pullback support that is slightly above the 38.2% Fibonacci retracement, and could rise from this level to our take profit.
Entry: 1.1535
Why we like it:
There is a pullback support that is slightly above the 38.2% Fibonacci retracement.
Stop loss: 1.1405
Why we like it:
There is a swing low support.
Take profit: 1.1684
Why we like it:
There is a pullback resistance that is slightly below the 78.6% Fibonacci retracement.
Enjoying your TradingView experience? Review us!
Please be advised that the information presented on TradingView is provided to Vantage (‘Vantage Global Limited’, ‘we’) by a third-party provider (‘Everest Fortune Group’). Please be reminded that you are solely responsible for the trading decisions on your account. There is a very high degree of risk involved in trading. Any information and/or content is intended entirely for research, educational and informational purposes only and does not constitute investment or consultation advice or investment strategy. The information is not tailored to the investment needs of any specific person and therefore does not involve a consideration of any of the investment objectives, financial situation or needs of any viewer that may receive it. Kindly also note that past performance is not a reliable indicator of future results. Actual results may differ materially from those anticipated in forward-looking or past performance statements. We assume no liability as to the accuracy or completeness of any of the information and/or content provided herein and the Company cannot be held responsible for any omission, mistake nor for any loss or damage including without limitation to any loss of profit which may arise from reliance on any information supplied by Everest Fortune Group.
6E : Long levelThe level has been activated, so you can buy it. I have slightly edited it since last time. It is best to scalp or pip it; I cannot promise any significant movement. Be careful when trading on news or at market close/open.

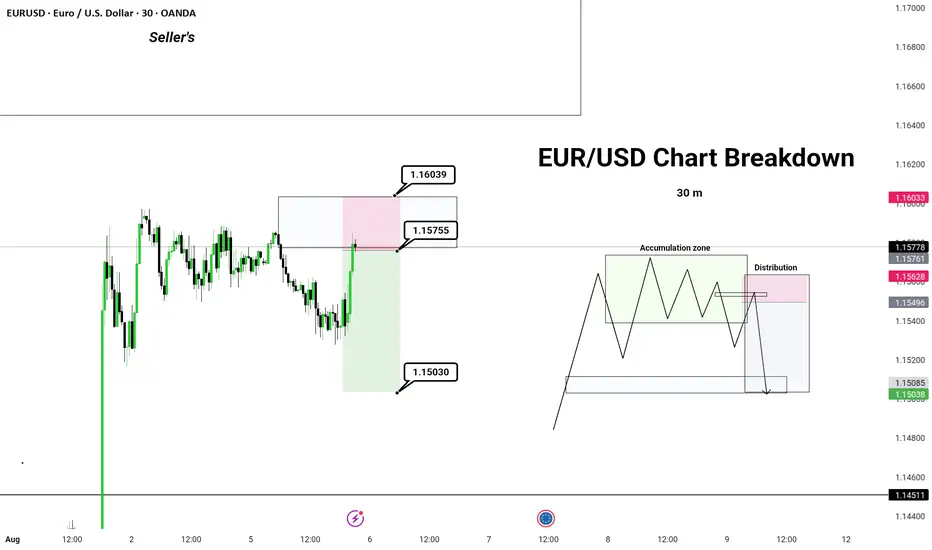
EUR/USD Chart Breakdown – Explained Like You're 5!📉 Big money doesn't move randomly – it follows patterns. In this short, I break down a real EUR/USD trade setup like a pro trader would explain it to a curious kid.
✅ Watch how institutional players trap retail traders
✅ Learn the psychology behind accumulation & distribution
✅ Find out why the market may drop toward 1.15030
✅ Explained in the simplest, most relatable way!
If you're tired of complicated chart talk — this one’s for YOU.
📍EUR/USD Forex Setup | Day 9 | Smart Money Concept | Price Action
🔔 Follow for daily breakdowns and market psychology
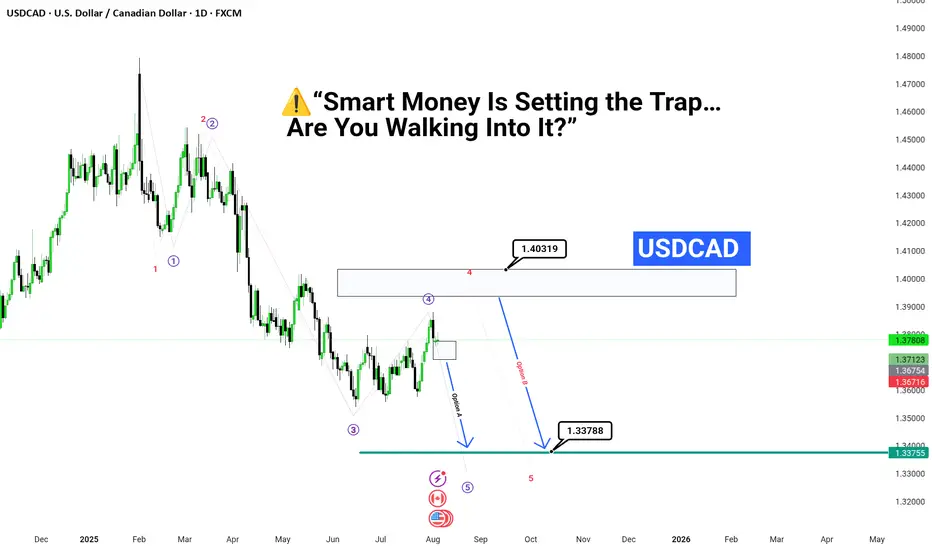
Smart Money Is Setting the Trap… Are You Walking Into It?”“💥USDCAD About to Explode — Final Wave Is Loading.
📉 If You Miss This Entry, You’ll Chase the Exit.
🧠 Wave 5 ≠ Just Another Move
It’s the final shot before the reversal storm.
✅ All signs point to liquidity being hunted
📍Stay sharp. 1.403 may be the bull trap of the year.
🎯 Make no mistake — the market is not random,
it’s engineered to fake you out before the real drop.
---
EURUSD What Next? BUY!
My dear subscribers,
EURUSD looks like it will make a good move, and here are the details:
The market is trading on 1.1551 pivot level.
Bias - Bullish
My Stop Loss - 1.1540
Technical Indicators: Both Super Trend & Pivot HL indicate a highly probable Bullish continuation.
Target - 1.1569
About Used Indicators:
The average true range (ATR) plays an important role in 'Supertrend' as the indicator uses ATR to calculate its value. The ATR indicator signals the degree of price volatility.
Disclosure: I am part of Trade Nation's Influencer program and receive a monthly fee for using their TradingView charts in my analysis.
———————————
WISH YOU ALL LUCK

EURUSD: Strong Bullish Sentiment! Long!
My dear friends,
Today we will analyse EURUSD together☺️
The in-trend continuation seems likely as the current long-term trend appears to be strong, and price is holding above a key level of 1.15455 So a bullish continuation seems plausible, targeting the next high. We should enter on confirmation, and place a stop-loss beyond the recent swing level.
❤️Sending you lots of Love and Hugs❤️
BTC - Short Setup at 0.702 Fibonacci & Fair Value GapMarket Context
Bitcoin recently rejected from a major resistance area and has since been retracing downward, finding temporary support inside a bullish Fair Value Gap. The market is currently in a corrective phase, with buyers attempting to defend lower levels while sellers look for optimal positions to reload shorts. This environment shows a classic tug-of-war between these two forces as price moves between supply and demand zones.
Consolidation and Current Phase
Although the prior consolidation has been broken, the current price action can still be described as corrective, with intraday structure forming lower highs. The bullish Fair Value Gap beneath price has been respected so far, creating a temporary base. However, the path remains complex, as the market has unfilled imbalances both above and below.
Bearish Retest Scenario
One key scenario involves a retracement toward the bearish Fair Value Gap near 117K, which also aligns with the 0.702 Fibonacci retracement level. This confluence makes it a high-probability area for sellers to step in again. A rejection from that zone would likely resume the downtrend, with the next logical target being the deeper unfilled bullish Fair Value Gap around 110K. This zone acts as a magnet for price due to the inefficiency left behind during the last rally.
Bullish Defense Scenario
For bulls to regain control, the current Fair Value Gap at 114K must hold, followed by a strong move that invalidates the lower-high structure. Such a move would need to break above the 117K bearish FVG with conviction. Only then could momentum shift back to the upside, opening the door for another challenge of the higher resistance zones.
Final Words
Patience and precision are key when dealing with setups like this. Let the market come to your level — and react with intent.
If you found this breakdown helpful, a like is much appreciated! Let me know in the comments what you think or if you’re watching the same zones.

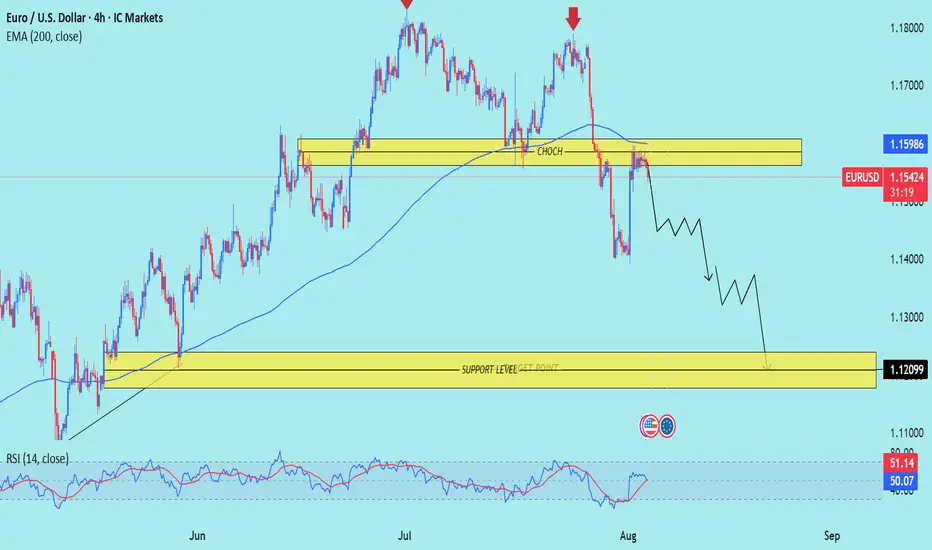
EUR/USD) Bearish Trend Read The captionSMC Trading point update
Technical analysis EUR/USD on the 4-hour timeframe, highlighting a structure shift, supply zone rejection, and a move toward a lower support target.
---
Technical Breakdown:
1. Market Structure:
A clear Change of Character (CHOCH) occurred after the price broke below the recent higher low structure — signaling a bearish trend reversal.
Price made a lower high after retesting the supply zone (yellow), confirming bearish momentum.
2. Supply & Demand Zones:
Supply Zone (Resistance): Around 1.1598 – previously a demand zone, now acting as a rejection zone.
Target Support Zone: 1.12099 – marked as a key level for potential bounce or consolidation.
3. EMA (200):
The price is trading below the 200 EMA, reinforcing the bearish bias.
The EMA is also curving downward — aligning with the direction of the trend.
4. Projected Price Path:
The chart outlines a bearish stair-step move with lower highs and lower lows.
Targeting a full move toward the support zone at 1.12099.
5. RSI (14):
Currently hovering around 50, showing neutral momentum.
No divergence, but RSI is below its moving average (bearish crossover) and can support further downside.
---
Trade Idea Summary:
Bias: Bearish
Confirmation: Price broke below structure → CHOCH confirmed → Rejection from supply zone
Entry Area: Around 1.1550–1.1580 (ideally after a lower high forms)
Target Zone:
TP1: 1.1400
TP2: 1.12099 (major support zone)
Invalidation: Price closes and holds above 1.1600 (invalidates bearish bias)
---
Key Insights:
This is a Smart Money Concept (SMC)-based setup focusing on structure breaks, supply rejections, and order flow.
Ideal for swing traders aiming to capture the next major leg down.
Please support boost 🚀 this analysis)
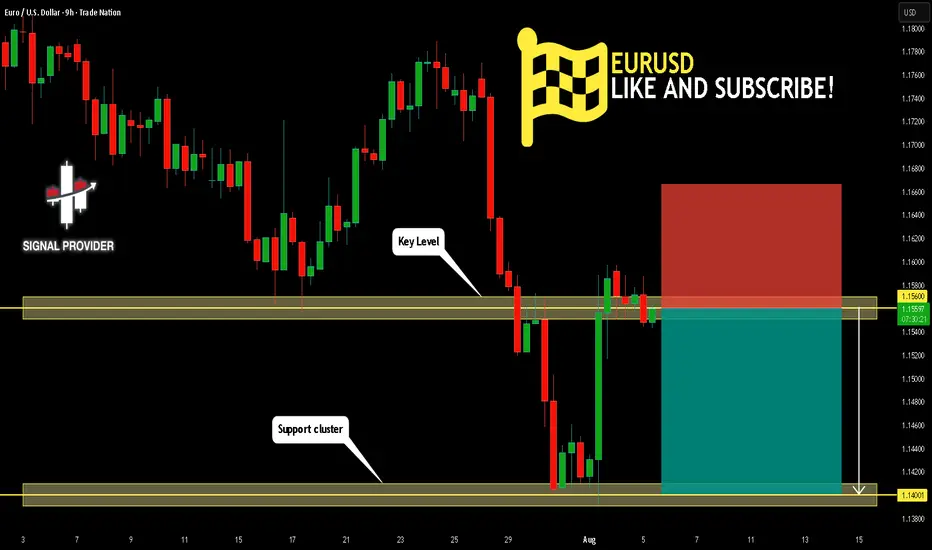
EURUSD Will Move Lower! Sell!
Please, check our technical outlook for EURUSD.
Time Frame: 9h
Current Trend: Bearish
Sentiment: Overbought (based on 7-period RSI)
Forecast: Bearish
The market is approaching a significant resistance area 1.156.
Due to the fact that we see a positive bearish reaction from the underlined area, I strongly believe that sellers will manage to push the price all the way down to 1.140 level.
P.S
The term oversold refers to a condition where an asset has traded lower in price and has the potential for a price bounce.
Overbought refers to market scenarios where the instrument is traded considerably higher than its fair value. Overvaluation is caused by market sentiments when there is positive news.
Disclosure: I am part of Trade Nation's Influencer program and receive a monthly fee for using their TradingView charts in my analysis.
Like and subscribe and comment my ideas if you enjoy them!
Fundamental Market Analysis for August 5, 2025 EURUSDEvent to pay attention to today:
17:00 EET. USD - ISM Services PMI
EUR/USD continues to fall for the second day in a row, trading around 1.1560 during Tuesday's Asian session. The pair is devaluing amid the strengthening of the US dollar (USD) due to caution among traders caused by recent events in global trade and changes in expectations regarding monetary policy.
Market sentiment is becoming cautious due to growing concerns about the independence of the Federal Reserve (Fed). On Monday, Fed board member Adriana Kugler unexpectedly resigned. This event gave US President Donald Trump the opportunity to influence the central bank earlier than expected.
However, the US dollar may face difficulties amid growing chances of an interest rate cut by the US Federal Reserve (Fed) in September after weak labor market data reinforced concerns about the US economic outlook. Markets estimate the probability of a Federal Reserve rate cut next month at 91.6%.
By comparison, the European Central Bank (ECB) is expected to keep rates unchanged, as annual inflation in the eurozone remained at 2.0% in July, slightly above the forecast of 1.9%. Meanwhile, traders are cautious amid the introduction of 15% US tariffs on goods imported from the European Union (EU).
Trade recommendation: BUY 1.1580, SL 1.1500, TP 1.1685

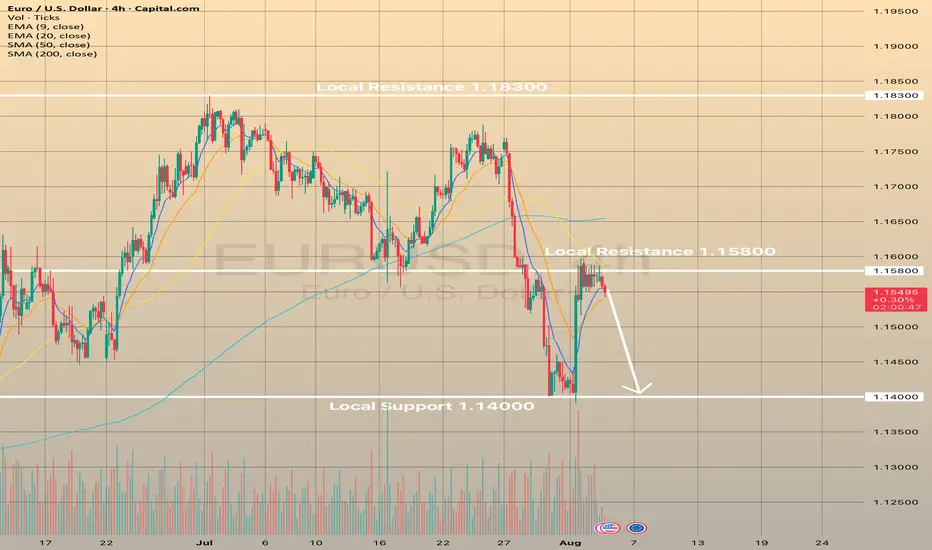
EURUSD fails to develop short-term bullish. Here is whyEURUSD fails to develop short-term bullish. Here is why
On August 1 the market received NFP report data. Numbers were so low that EURUSD has rocketed on 1.22% right immediately after publishing. The probability of a September reduction in interest rates is now estimated at approximately 94%, according to CME Fedwatch, up from 63% last week. Market analysts anticipate at least two quarter-point cuts by the end of the year. The odds increased following the release of disappointing non-farm payrolls data on August 1, which caused a decline in stock markets and led to Trump's reaction, firing the head of the Bureau of Labor Statistics and promising to replace her within a short timeframe.
Still, the pair has failed to develop on August 1 bullish momentum and is currently pulling back from the local resistance of 1.15800. If the price fails to hold the EMA20 on 4-h timeframe, then the decline towards 1.14000 is expected.
EURUSD – DAILY FORECAST Q3 | W32 | D5 | Y25📊 EURUSD – DAILY FORECAST
Q3 | W32 | D5 | Y25
Daily Forecast 🔍📅
Here’s a short diagnosis of the current chart setup 🧠📈
Higher time frame order blocks have been identified — these are our patient points of interest 🎯🧭.
It’s crucial to wait for a confirmed break of structure 🧱✅ before forming a directional bias.
This keeps us disciplined and aligned with what price action is truly telling us.
📈 Risk Management Protocols
🔑 Core principles:
Max 1% risk per trade
Only execute at pre-identified levels
Use alerts, not emotion
Stick to your RR plan — minimum 1:2
🧠 You’re not paid for how many trades you take, you’re paid for how well you manage risk.
🧠 Weekly FRGNT Insight
"Trade what the market gives, not what your ego wants."
Stay mechanical. Stay focused. Let the probabilities work.
FX:EURUSD
CHART UPDATE !!!!!

EURUSD – Bearish pullback in play ? EURUSD has broken the ascending trendline and dropped below the EMA confluence, confirming a bearish structure. The current rebound is testing the 0.5–0.618 Fibonacci zone, but weak buying pressure and rejection candles suggest it’s likely just a technical pullback.
If momentum holds, the pair may resume its downtrend toward 1.1400 and potentially 1.1296. The bears remain in control unless strong fundamentals shift the balance.
EUR/USD - Bearish Outlook (05.08.2025)The EUR/USD Pair on the H4 timeframe presents a Potential Selling Opportunity due to a recent Formation of a Bearish Flag Pattern. This suggests a shift in momentum towards the downside in the coming Days.
Possible Short Trade:
Entry: Consider Entering A Short Position around Trendline Of The Pattern.
Target Levels:
1st Support – 1.1400
2nd Support – 1.1300
🎁 Please hit the like button and
🎁 Leave a comment to support for My Post !
Your likes and comments are incredibly motivating and will encourage me to share more analysis with you.
Best Regards, KABHI_TA_TRADING
Thank you.
Disclosure: I am part of Trade Nation's Influencer program and receive a monthly fee for using their TradingView charts in my analysis.
Bearish drop off pullback resistance?The price has rejected off the pivot, which has been identified as a pullback resistance that lines up with the 50% Fibonacci retracement and could drop to the 1st support.
Pivot: 1.1584
1st Support: 1.1406
1st Resistance: 1.1715
Risk Warning:
Trading Forex and CFDs carries a high level of risk to your capital and you should only trade with money you can afford to lose. Trading Forex and CFDs may not be suitable for all investors, so please ensure that you fully understand the risks involved and seek independent advice if necessary.
Disclaimer:
The above opinions given constitute general market commentary, and do not constitute the opinion or advice of IC Markets or any form of personal or investment advice.
Any opinions, news, research, analyses, prices, other information, or links to third-party sites contained on this website are provided on an "as-is" basis, are intended only to be informative, is not an advice nor a recommendation, nor research, or a record of our trading prices, or an offer of, or solicitation for a transaction in any financial instrument and thus should not be treated as such. The information provided does not involve any specific investment objectives, financial situation and needs of any specific person who may receive it. Please be aware, that past performance is not a reliable indicator of future performance and/or results. Past Performance or Forward-looking scenarios based upon the reasonable beliefs of the third-party provider are not a guarantee of future performance. Actual results may differ materially from those anticipated in forward-looking or past performance statements. IC Markets makes no representation or warranty and assumes no liability as to the accuracy or completeness of the information provided, nor any loss arising from any investment based on a recommendation, forecast or any information supplied by any third-party.

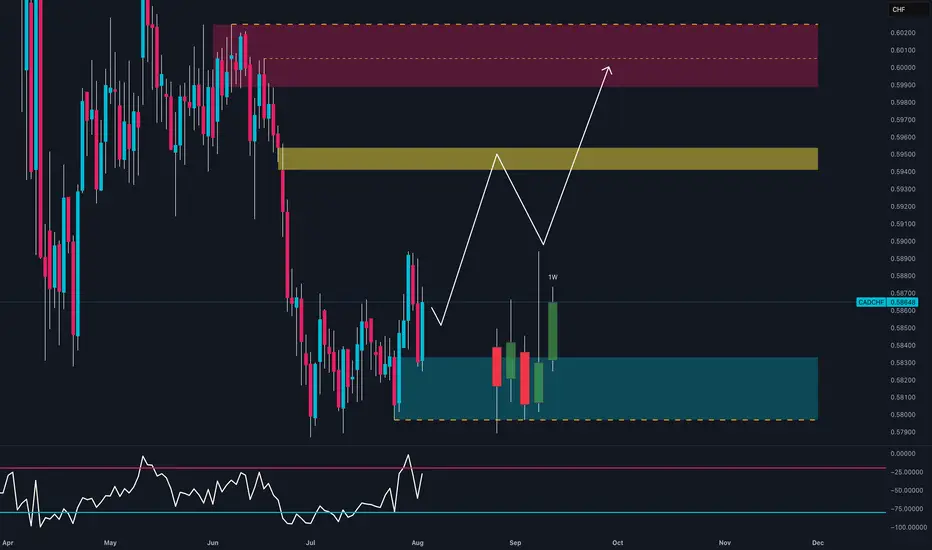
Everyone’s Short on CAD… But This Is Why I’m Going Long📊 CAD/CHF – August 4th, 2025 | Tactical Long Bias
🔹 Technical Outlook
The daily chart shows:
Strong bullish reaction within a weekly demand zone (0.5800–0.5830), confirmed by multiple lower wicks → growing buying pressure.
Weekly RSI bouncing out of oversold → potential mid-term reversal signal.
Structure may be shifting with a first target at 0.5950 (intermediate zone) and second target at 0.6000–0.6030 (major supply).
Recent bullish engulfing broke out of inside candle sequence → active technical trigger.
🧠 Commitment of Traders (COT) – July 29
Non-Commercials:
CAD: Aggressive increase in shorts (+3,888) and reduction in longs (-2,222) → heavily bearish speculative positioning.
CHF: Increase in longs (+936) and decrease in shorts (-1,095) → net bullish sentiment on CHF.
📌 However, CAD’s overstretched short positioning may lead to technical short-covering, especially if CHF starts to lose momentum.
📈 Seasonality – August
CHF: Range-bound or weak in August across all timeframes (20y, 15y, 10y).
CAD: Mild seasonal strength in August, especially on the 2y and 5y outlook.
➡️ Seasonal bias supports a tactical long on CAD/CHF during the first half of August.
✅ Trading Outlook
📌 Tactical Bias: LONG
🎯 First Target: 0.5950 → mid-level reaction zone.
🛑 Invalidation: below 0.5800 (demand breakdown).
🧠 Confluences: demand zone + RSI reversal + extreme COT positioning + seasonal support.
EURUSD: Target Is Down! Short!
My dear friends,
Today we will analyse EURUSD together☺️
The recent price action suggests a shift in mid-term momentum. A break below the current local range around 1.15671 will confirm the new direction downwards with the target being the next key level of 1.15480.and a reconvened placement of a stop-loss beyond the range.
❤️Sending you lots of Love and Hugs❤️
EURUSD: Bearish Continuation
Remember that we can not, and should not impose our will on the market but rather listen to its whims and make profit by following it. And thus shall be done today on the EURUSD pair which is likely to be pushed down by the bears so we will sell!
Disclosure: I am part of Trade Nation's Influencer program and receive a monthly fee for using their TradingView charts in my analysis.
❤️ Please, support our work with like & comment! ❤️

US dollar gets hit by weird disappointing NFP numbersLast Friday the US delivered not its best NFP reading. US dollar bears jumped into action. Let's dig in!
MARKETSCOM:DOLLARINDEX
TVC:DXY
FX_IDC:EURUSD
FX_IDC:USDJPY
FX_IDC:USDCAD
Let us know what you think in the comments below.
Thank you.
75.2% of retail investor accounts lose money when trading CFDs with this provider. You should consider whether you understand how CFDs work and whether you can afford to take the high risk of losing your money. Past performance is not necessarily indicative of future results. The value of investments may fall as well as rise and the investor may not get back the amount initially invested. This content is not intended for nor applicable to residents of the UK. Cryptocurrency CFDs and spread bets are restricted in the UK for all retail clients.

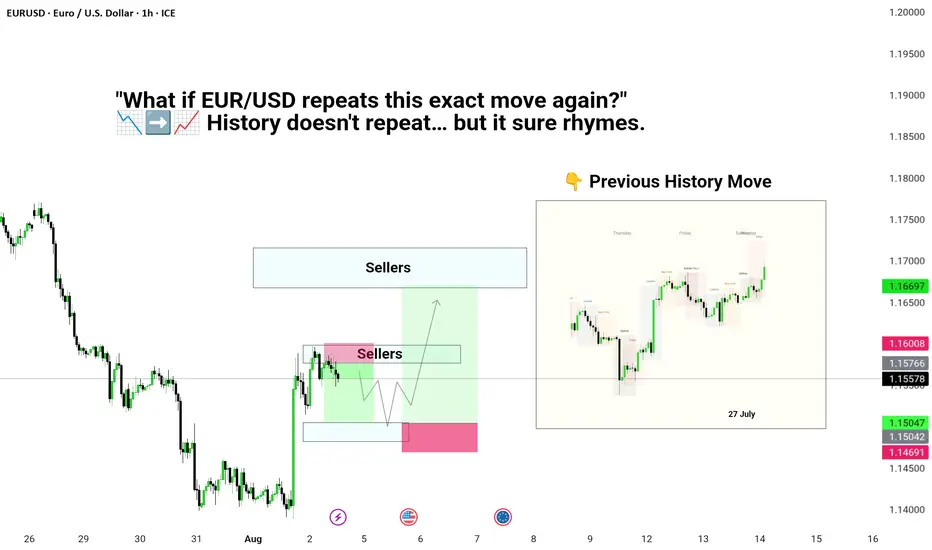
"What if EUR/USD repeats this exact move again?"“Mark this zone before it explodes 🚀📍
Drop 🔥 if you’re watching EUR/USD this week!”
"EUR/USD preparing for a potential bullish reversal 🐂! Watch for that W pattern formation and entry near 1.15600 with targets towards the 1.16600 resistance zone! Just like history repeated itself last week! 📈🔥
👉 #SmartMoney #ForexAnalysis #EURUSD"
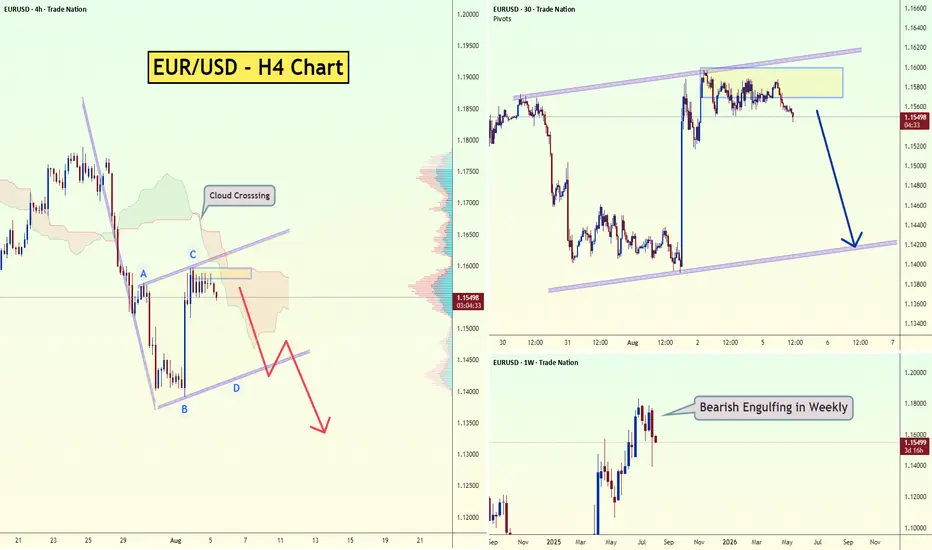
EURUSD – Retest in Play After NFP Reversal?EURUSD started last week with a heavy bearish tone, dropping 200 pips on Monday alone — which is quite a move for such a typically stable pair.
After a brief consolidation around the neckline support of the recent double top, sellers came back in, pushing the pair down to 1.1400 by Friday — a level I highlighted in my previous analysis.
But then came NFP...
The weak jobs data triggered a sharp bullish reversal, and the euro took off like a rocket.
By the weekly close, the pair had rallied all the way back to the neckline zone, now acting as potential resistance.
________________________________________
🔍 Technical Outlook:
This area around 1.1550–1.1590 could now serve as a retest of the broken structure.
• 🔽 A rejection here, followed by a break back below 1.1500, would confirm the bearish scenario and open the door for a move toward 1.1200, the next major support.
• 📌 On the flip side, a sustained move above the neckline would invalidate the double top — and put bulls back in control.
________________________________________
Conclusion:
Watching for sell signals around the neckline makes technical sense — but confirmation is key.
The reaction early this week will likely set the tone for the next major swing.
Disclosure: I am part of TradeNation's Influencer program and receive a monthly fee for using their TradingView charts in my analyses and educational articles.

EURUSD: tariffs impact?The previous week was a very intensive one when it comes to US macro data. Certainly, the most important weekly event was the FOMC meeting, where the Fed left interest rates unchanged at current levels. As per information by Fed Chair Powell, the economy is in a solid condition. Growth is at a moderate pace, with some decrease due to decrease in consumer spending. Although inflation remains relatively near to the targeted level of 2%, still, there are some indications of its modest pick-up, as a reflection of implemented tariffs. The Fed will continue further to balance interest rates based on “the incoming data, the evolving outlook and the balance of risks”. The full effects of implemented tariffs is to be seen in the future period, but there are Fed expectations that these effects might be a one-time effect on inflation. Fed Chair Powell did not provide a clear answer regarding the potential cut of interest rates in September.
On the other hand, the bulk of important macro data was released during the previous week, providing some insight to investors that the economy is starting to see the effects of tariffs, but also increasing their expectations that the rate cut might occur in September. The week started with JOLTs Job Openings data for June, which reached 7.437M and were lower from expected 7,55M. The GDP Growth Rate estimate for Q2 is 3% for the quarter, which was better from forecasted 2,4%. The PCE Price Index in June reached 0,3% for the month and 2,6% for the year. At the same time, the core PCE was also standing at 0,3% in June. Personal Income increased by 0,3% in June, while Personal Spending also reached 0,3% in the same period. Huge weekly surprises were the Non-farm payrolls which were increased by 73K in July, well below market estimate of 110K. The unemployment rate modestly increased to the level of 4,2% in July from 4,1% posted previously. Friday brought the University of Michigan Consumer Sentiment final for July at the level of 61,7 which was fully in line with market expectations. The five years inflation expectations were further decreased to the level of 3,4% from previous 4%.
Data posted for the Euro Zone include the GDP Growth rate estimate for Q2 of 0,1% for the quarter and 1,4% on a yearly basis. Both figures were higher from estimated 0% q/q and 1,2% y/y. The GDP Growth Rate in Germany in Q2 was standing in the negative territory of -0,1% for the quarter and +0,4% on a yearly basis. The inflation rate in Germany preliminary for July was standing at 0,3% for the month and 2% y/y. The inflation rate flash in July in the Euro Zone was 2%, just a bit higher from market estimate of 1,9%. The core inflation reached 2,3%.
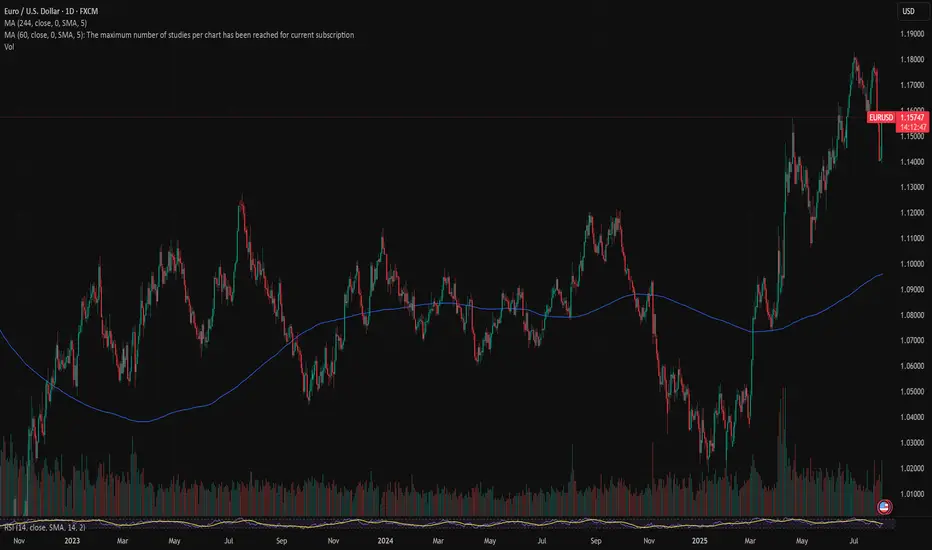
The week full of important macro data guaranteed higher volatility in the value of the U.S. Dollar. During the first half of the week, markets favored the USD, which reached the highest value against the euro at 1,14. However, Friday trading session and the release of surprisingly weak NFP data, brought the value of currency pair back toward the 1,1586 level. The RSI modestly touched the level of 31 and swiftly turned back toward the 48. Clear oversold market side has not been reached on this occasion. The MA 50 slowed down its divergence from MA200, but with a still large distance between the two lines, the cross is not in the store for some time.
Markets will use the week ahead to digest all the data posted during the previous week. For the US there are no currently important data scheduled for a release, in which sense, market moves could be much calmer. During the previous week, the support line at 1,14 has been tested, however, the 1,16 resistance is pending clear testing. In this sense, it is possible that the market will start the week ahead with a move toward the 1,16 level, heading toward 1,650 eventually 1,1680. At this moment on charts there is a lower probability for 1,17 levels. A move toward the down side is also probable, where 1,15 is currently marked on charts.
Important news to watch during the week ahead are:
EUR: Retail Sales in June in the Euro Zone, Balance of Trade in June in Germany, Industrial Production in June in Germany,
USD: ISM Services PMI in July.