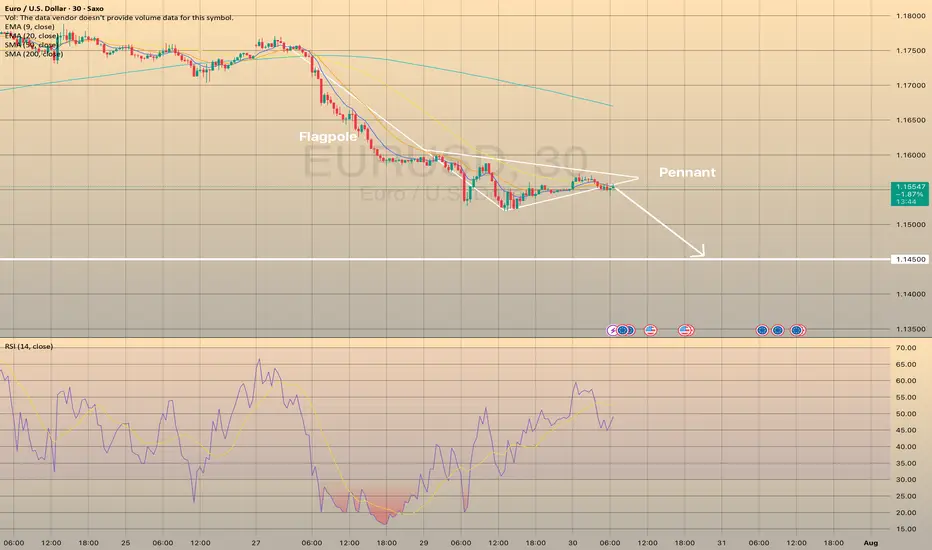
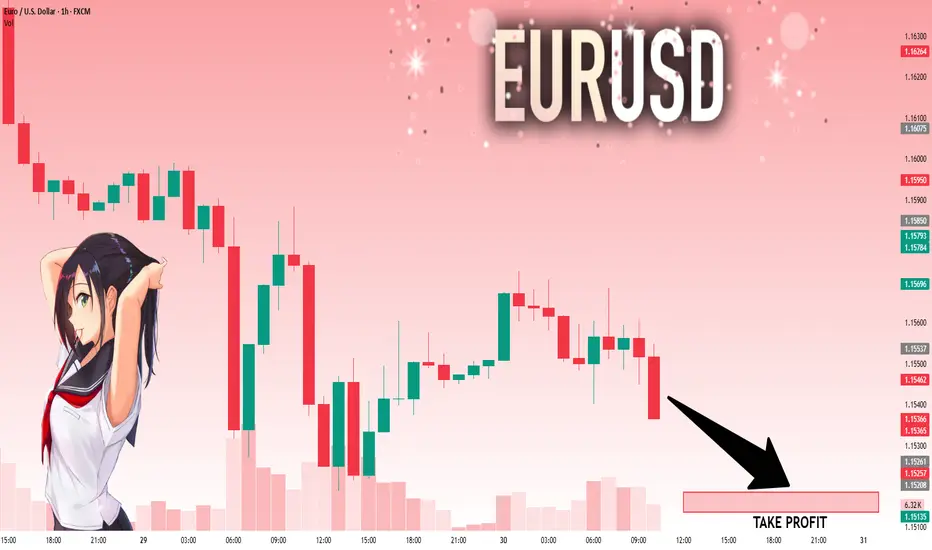
EURUSD FORMED BEARISH PENNANT. THE PRICE IS READY TO DROP.EURUSD FORMED BEARISH PENNANT. THE PRICE IS READY TO DROP.
EURUSD has been trading sideways within the last day, showing lower highs and higher lows. Eventually, the price has formed the pennant chart pattern.
What is a pennant?
A pennant chart pattern is a short-term continuation pattern in technical analysis, resembling a small symmetrical triangle, formed after a strong price movement (flagpole). It consists of converging trendlines, indicating a brief consolidation before the trend resumes. Bullish pennants form after an uptrend, bearish pennants after a downtrend.
The price is expected to decline towards 1.14500 support level
Eurusd-3
The Fed aftermath. US dollar bulls enjoy the moment.The US dollar bulls went in hard after during and after the Fed's press conference. Can the momentum stay? Let's dig in.
MARKETSCOM:DOLLARINDEX
TVC:DXY
Let us know what you think in the comments below.
Thank you.
75.2% of retail investor accounts lose money when trading CFDs with this provider. You should consider whether you understand how CFDs work and whether you can afford to take the high risk of losing your money. Past performance is not necessarily indicative of future results. The value of investments may fall as well as rise and the investor may not get back the amount initially invested. This content is not intended for nor applicable to residents of the UK. Cryptocurrency CFDs and spread bets are restricted in the UK for all retail clients.

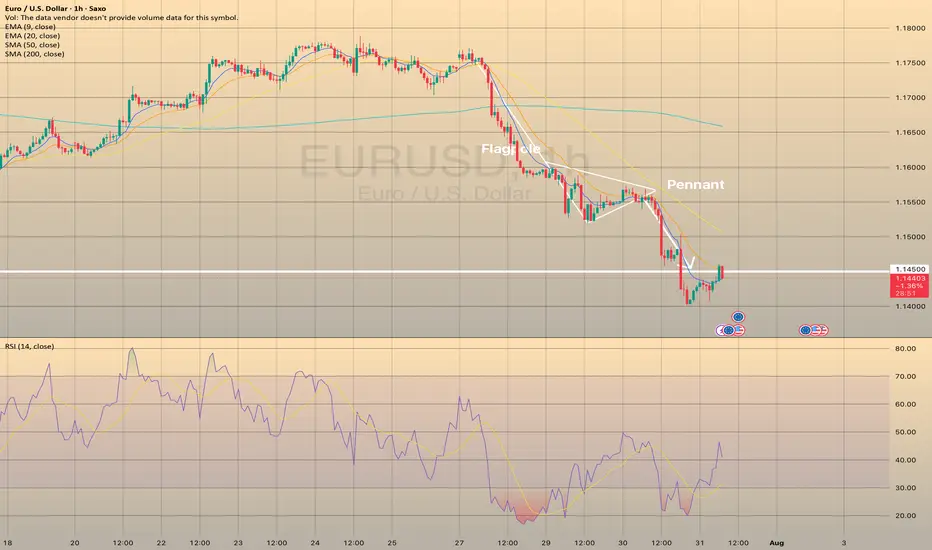
EURUSD REACHED THE TARGET.EURUSD REACHED THE TARGET.
EURUSD has reached the 1.14500 level and even broke it down. Currently the price consolidates slightly below this level. If the price forms a false breakout of 1.14500 level, this will mean the end of short-term decline in the pair. Stay cautious.
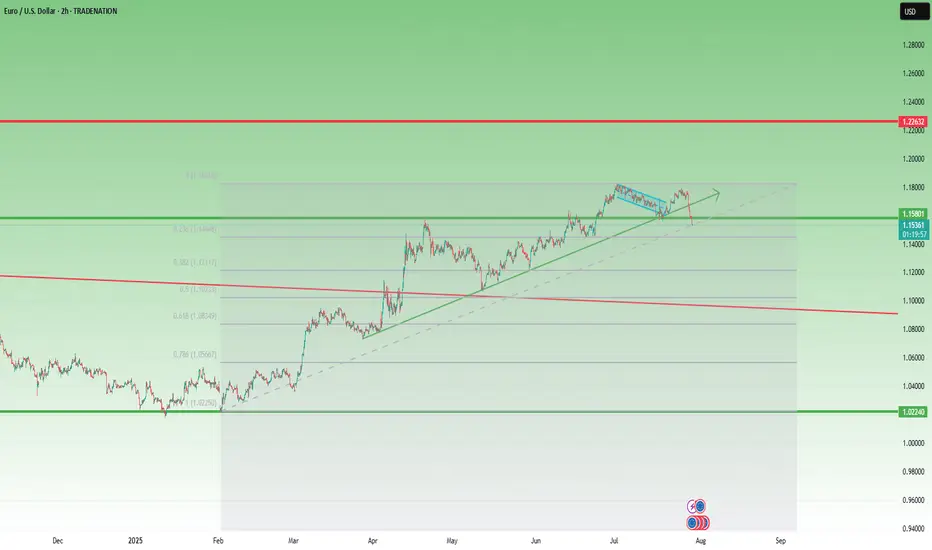
Closed Longs, Now Selling Rallies on EURUSD ReversalAs mentioned in my previous posts, I’m been bullish on EURUSD in the medium term, targeting 1.20 and even beyond.
But no pair—especially not EURUSD, which tends to move more steadily and rationally—goes up in a straight line.
________________________________________
🔹 Last week, the pair stalled just below 1.18, and I decided to close my long trade with a +150 pip gain. That proved to be a wise call, as price dropped hard shortly after.
________________________________________
📉 What’s happening now?
• EURUSD has broken below the rising trendline
• More importantly, it’s broken below the neckline of a double top pattern
• Now trading around 1.1535
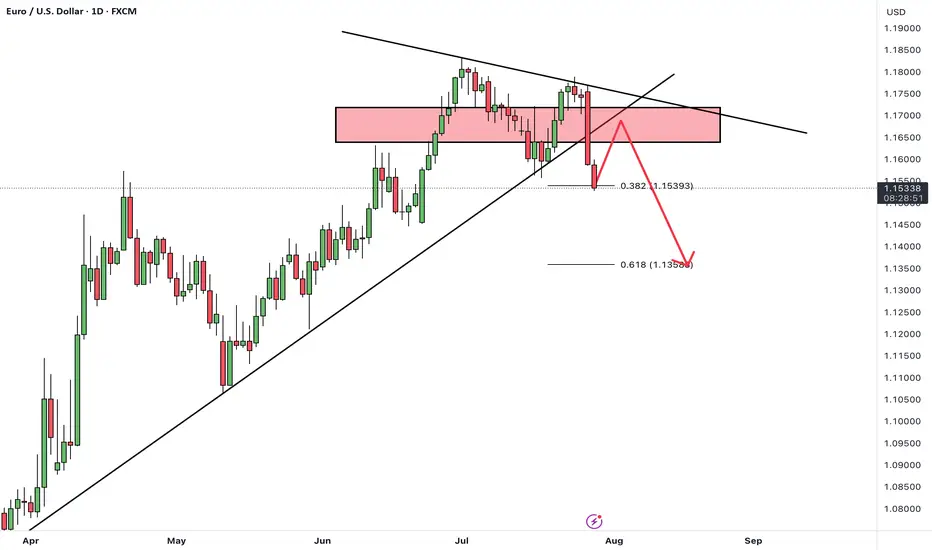
This opens the door for a deeper correction, and I expect we could see a test of the 1.1150–1.1100 zone by the end of summer.
________________________________________
📌 Trading Plan:
• I’m now in sell-the-rally mode
• Ideal short entry: around 1.1650, where we also get a favorable 1:3+ risk-reward
• Watch also for interim support around 1.1400
________________________________________
Conclusion:
The bigger picture remains bullish— but this correction looks healthy and isn’t done yet.
Selling rallies makes more sense now, until the structure tells us otherwise.
Disclosure: I am part of TradeNation's Influencer program and receive a monthly fee for using their TradingView charts in my analyses and educational articles.
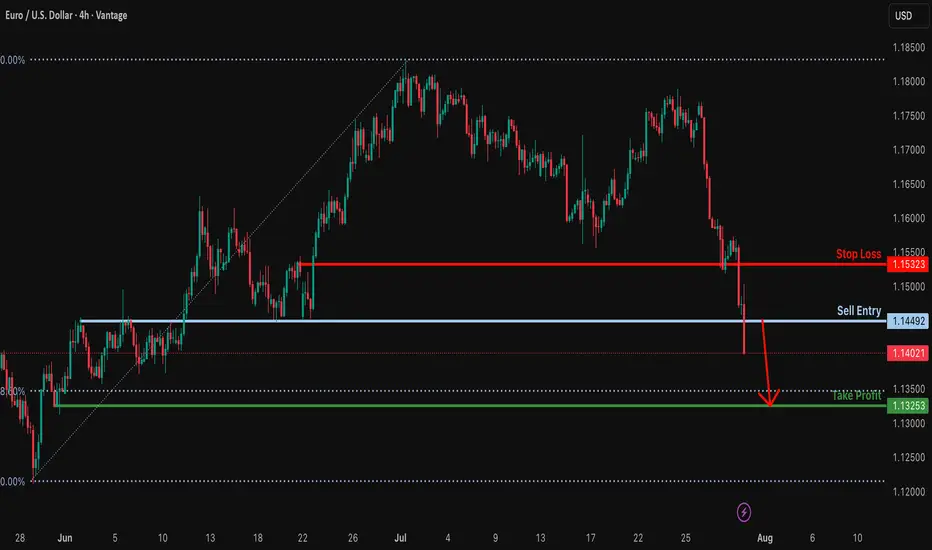
EURUSD H4 | Bearish reversal off overlap resistanceThe Fiber (EUR/USD) is rising towards the sell entry, which is an overlap resistance and could drop lower.
Sell entry is at 1.1452, which is an overlap resistance.
Stop loss is at 1.1536, which is a pullback resistance that lines up with the 38.2% Fibonacci retracement.
Take profit is at 1.1323, which is a pullback support that is slightly below the 78.6% Fibonacci retracement.
High Risk Investment Warning
Trading Forex/CFDs on margin carries a high level of risk and may not be suitable for all investors. Leverage can work against you.
Stratos Markets Limited (tradu.com ):
CFDs are complex instruments and come with a high risk of losing money rapidly due to leverage. 65% of retail investor accounts lose money when trading CFDs with this provider. You should consider whether you understand how CFDs work and whether you can afford to take the high risk of losing your money.
Stratos Europe Ltd (tradu.com ):
CFDs are complex instruments and come with a high risk of losing money rapidly due to leverage. 66% of retail investor accounts lose money when trading CFDs with this provider. You should consider whether you understand how CFDs work and whether you can afford to take the high risk of losing your money.
Stratos Global LLC (tradu.com ):
Losses can exceed deposits.
Please be advised that the information presented on TradingView is provided to Tradu (‘Company’, ‘we’) by a third-party provider (‘TFA Global Pte Ltd’). Please be reminded that you are solely responsible for the trading decisions on your account. There is a very high degree of risk involved in trading. Any information and/or content is intended entirely for research, educational and informational purposes only and does not constitute investment or consultation advice or investment strategy. The information is not tailored to the investment needs of any specific person and therefore does not involve a consideration of any of the investment objectives, financial situation or needs of any viewer that may receive it. Kindly also note that past performance is not a reliable indicator of future results. Actual results may differ materially from those anticipated in forward-looking or past performance statements. We assume no liability as to the accuracy or completeness of any of the information and/or content provided herein and the Company cannot be held responsible for any omission, mistake nor for any loss or damage including without limitation to any loss of profit which may arise from reliance on any information supplied by TFA Global Pte Ltd.
The speaker(s) is neither an employee, agent nor representative of Tradu and is therefore acting independently. The opinions given are their own, constitute general market commentary, and do not constitute the opinion or advice of Tradu or any form of personal or investment advice. Tradu neither endorses nor guarantees offerings of third-party speakers, nor is Tradu responsible for the content, veracity or opinions of third-party speakers, presenters or participants.

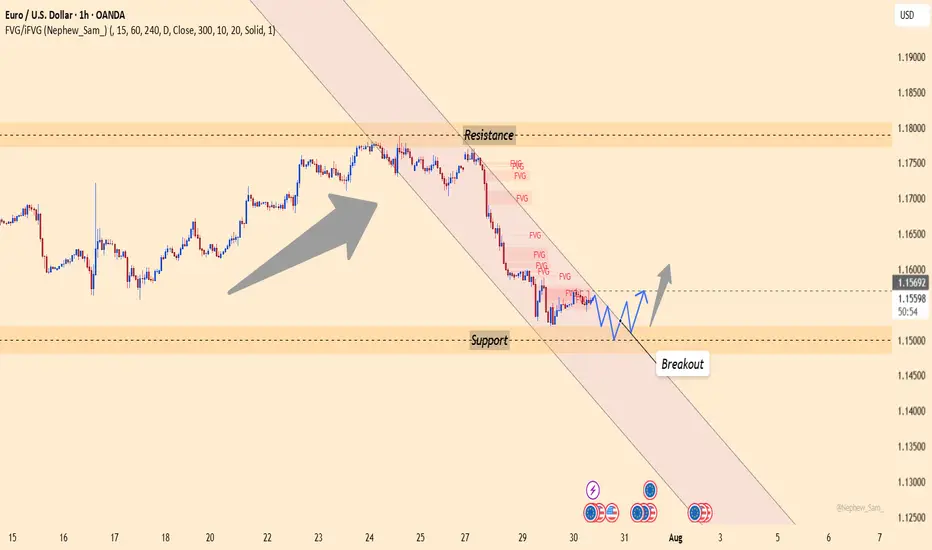
EURUSD – German GDP boosts EUR, but USD still holds the reins Germany’s recently released GDP data exceeded expectations, acting as a catalyst for EURUSD to rebound after a steep decline. However, this upward move remains fragile, as the USD continues to dominate the market—especially with several key U.S. economic reports set to be released later this week.
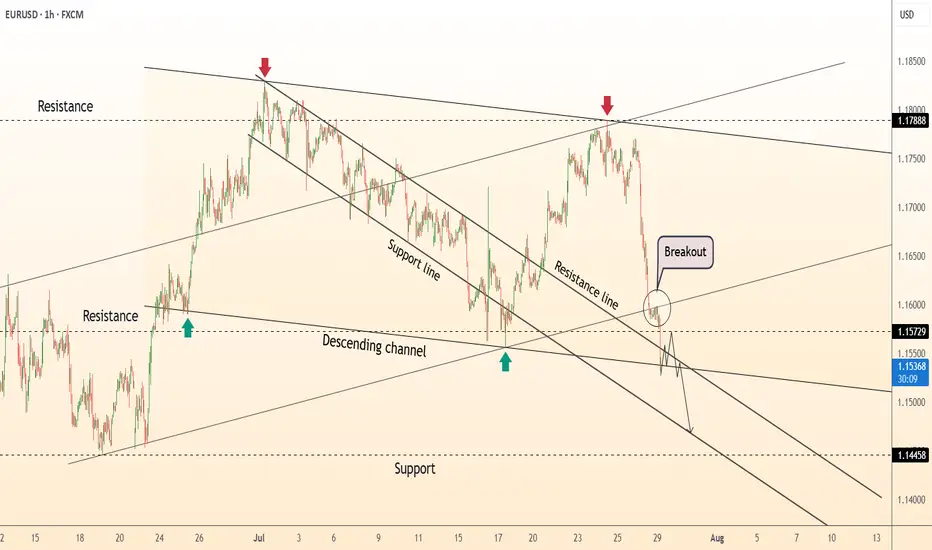
On the chart, EURUSD has just bounced from the 1.15000 support zone, which has historically served as a strong floor. If the price holds above this level and breaks the downtrend line, the short-term target could move toward the 1.15700 resistance zone.
Still, the path ahead won’t be easy. The market is closely watching upcoming U.S. data, such as the jobs report and the Core PCE index—the Fed’s preferred inflation gauge. If these figures come in strong, the USD could regain strength and put pressure back on EURUSD.
EUR/USD: A Fragile Rebound Within a Broader Bearish TrapEUR/USD has managed to stage a slight recovery after plunging through the key 1.1680 support — a level that had held firm for two weeks. The pair is now hovering just above 1.1500, but the bounce appears shallow and unconvincing. Volume remains low, momentum indicators offer little confirmation, and the broader structure still points to a prevailing downtrend.
On the H2 chart, price has rebounded from the 1.1505 area — a minor support formed during July's short-term consolidation. Yet, the EMA slope remains strongly negative, and RSI is struggling below the neutral 50 mark after exiting oversold territory. The structure continues to display classic lower highs and lower lows, with the 1.1585–1.1600 zone emerging as a potential resistance area for bears to re-enter.
From a macro perspective, the U.S. dollar remains supported by expectations that the Fed will maintain a hawkish stance, fueled by solid GDP, durable goods, and PCE data. In contrast, the Eurozone struggles with signs of stagnation, with both services and manufacturing PMIs deteriorating — most notably in Germany. This policy divergence continues to favor the greenback.
Unless bulls manage to decisively reclaim the 1.1600 zone with strong follow-through buying, any rebound risks being nothing more than a dead cat bounce. The downside target remains near 1.1460 – 1.1440 in the near term.
EUR/USD Latest Update TodayHello everyone, what do you think about FX:EURUSD ?
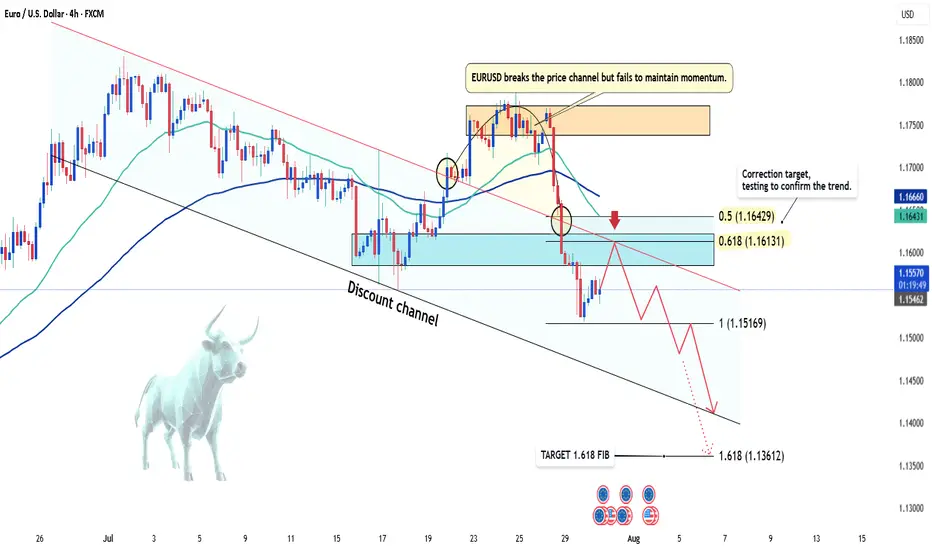
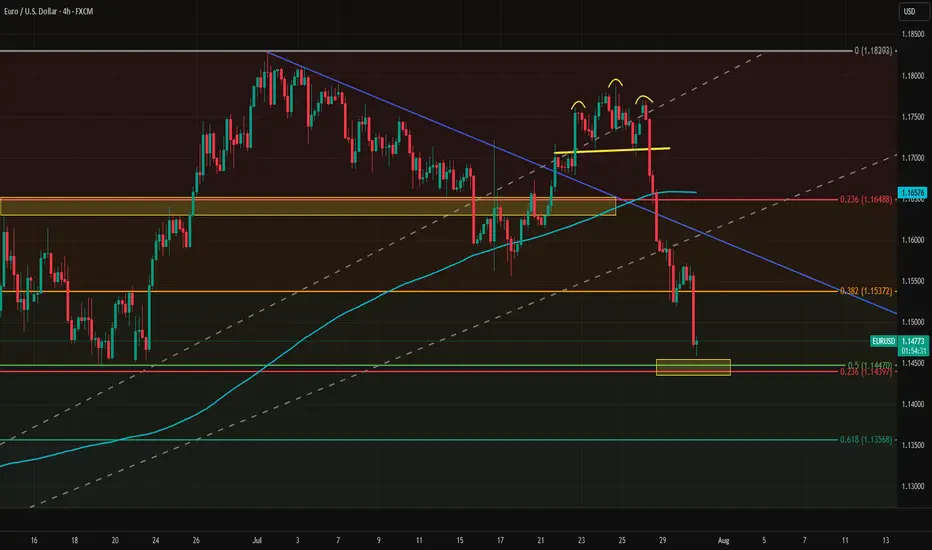
EUR/USD previously broke the downward price channel, but failed to maintain the momentum, leading to a strong correction phase. Currently, the price is trading around 1.156 and testing key Fibonacci levels, with the 0.5 - 0.618 levels marked as potential reversal zones, as highlighted in the analysis.
With the current market sentiment, the strong recovery of the USD has been the main factor driving the EUR/USD movement in recent days. Positive economic data from the US has strengthened the US dollar, decreasing the appeal of gold and safe-haven assets like the EUR. Furthermore, expectations surrounding Fed policy decisions continue to add pressure on EUR/USD, with investors bracing for the possibility of the Fed maintaining high interest rates for a longer period.
For traders, it's clear that the bearish trend is in favor, as indicated by the EMA reversal. The Fibonacci levels 0.5 (1.164) and 0.618 (1.161) will be crucial zones, where reaction signals could open opportunities for SELL positions. The next target will be at Fib 1 and Fib 1.618.
That's my perspective and share, but what do you think about the current trend of EUR/USD? Leave your comments below this post!
Bearish drop?EUR/USD has broken out of the support level, which is an overlap support. A potential pullback to the sell entry followed by a reversal could lead the price to drop from this level to our take-profit.
Entry: 1.1449
Why we like it:
There is an overlap resitance level.
Stop loss: 1.1532
Why we like it:
There is a pullback resitance level.
Take profit: 1.1325
Why we like it:
There is a swing low support that is slghtly below the 78.6% Fibonacci retracement.
Enjoying your TradingView experience? Review us!
Please be advised that the information presented on TradingView is provided to Vantage (‘Vantage Global Limited’, ‘we’) by a third-party provider (‘Everest Fortune Group’). Please be reminded that you are solely responsible for the trading decisions on your account. There is a very high degree of risk involved in trading. Any information and/or content is intended entirely for research, educational and informational purposes only and does not constitute investment or consultation advice or investment strategy. The information is not tailored to the investment needs of any specific person and therefore does not involve a consideration of any of the investment objectives, financial situation or needs of any viewer that may receive it. Kindly also note that past performance is not a reliable indicator of future results. Actual results may differ materially from those anticipated in forward-looking or past performance statements. We assume no liability as to the accuracy or completeness of any of the information and/or content provided herein and the Company cannot be held responsible for any omission, mistake nor for any loss or damage including without limitation to any loss of profit which may arise from reliance on any information supplied by Everest Fortune Group.
EURUSD | Faces Continued Downside, Reversal Above 1.1745EURUSD | Faces Continued Downside Risk; Reversal Only Confirmed Above 1.1747
The price initiated a bearish trend from the resistance level at 1.1747 and continues to decline. As long as it remains below the pivot level at 1.1685, further downside pressure is expected, with potential targets at 1.1632 and 1.1559. A confirmed break below this zone would reinforce the more bearish momentum.
However, if the price reverses and moves back above the pivot line, it may first reach 1.1747 before resuming the downward trend again.
The bullish trend confirmation will start above 1.1747.
Key Levels:
• Pivot line: 1.1685
• Resistance: 1.1747, 1.1894.
• Support: 1.1632, 1.15993, 1.1559.

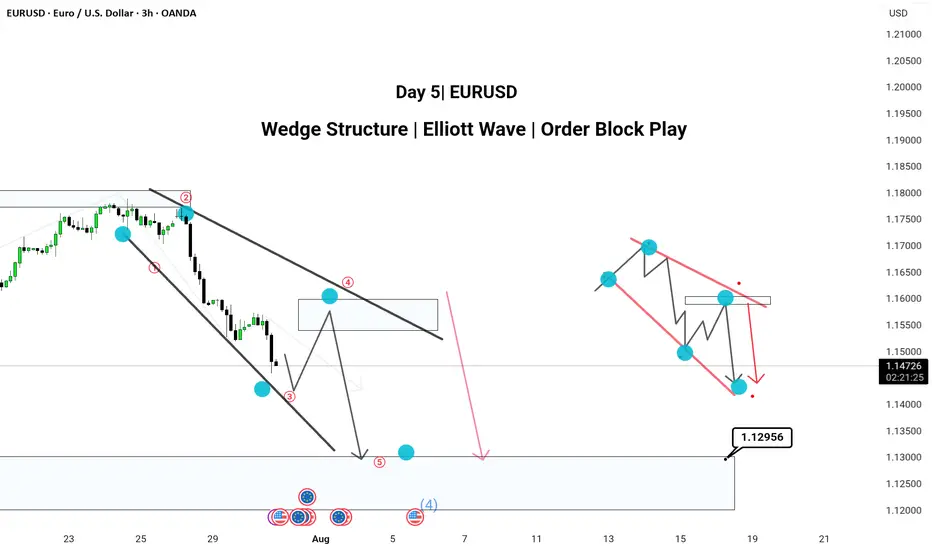
Pattern: Wedge Structure | Elliott Wave | Order Block PlayHere’s a powerful and professional description you can use when publishing this chart on TradingView:
---
🔻 Day 4 | EUR/USD Analysis 🔻
Chart Type: 3H Timeframe
---
📌 Chart Breakdown:
EUR/USD is respecting a textbook XABCD wedge pattern with clean Elliott Wave structure forming inside.
We’ve marked 5 key waves (1–5) completing within a falling wedge, aligning with a 50–60% retracement (Golden Zone) between point A and D.
🧠 Most traders miss the Golden Zone, but it’s often the clearest sign of upcoming trend continuation. Here, that continuation is bearish.
---
✅ 3H Confluence Factors:
Wedge forming within a larger downtrend
Multiple Break of Structures (BOS) confirming bearish momentum
Price targeting 1.12956 zone (mapped order block)
Elliott Wave fractals confirmed within structure
Hidden supply zone respected at Wave 4
---
📉 Expecting:
Retracement to supply → drop toward demand zone near 1.12956
---
📎 Strategy Insight:
SMC + Elliott Wave + Multi-timeframe path tool mapping gives us high confluence to expect continuation into the demand area.
💬 Comment below your views —
Do you also trade Wedges with Elliott Wave confirmation?
#EURUSD #WedgePattern #ElliottWave #SmartMoneyConcepts #OrderBlock #TechnicalAnalysis #TradingView #ForexIndia
---
EURUSD Tests Key Support Ahead of FOMCFollowing the strong U.S. GDP data, EURUSD dropped to the 1.1450 support level. This area is significant, as it marks the convergence of the 23.6% retracement from the January–July move and the 50% retracement from the May–July move.
While the FOMC decision will ultimately shape the direction, from a technical perspective, a long position may offer a favorable risk/reward setup at current levels. A stop just below the key support would help manage downside risk.
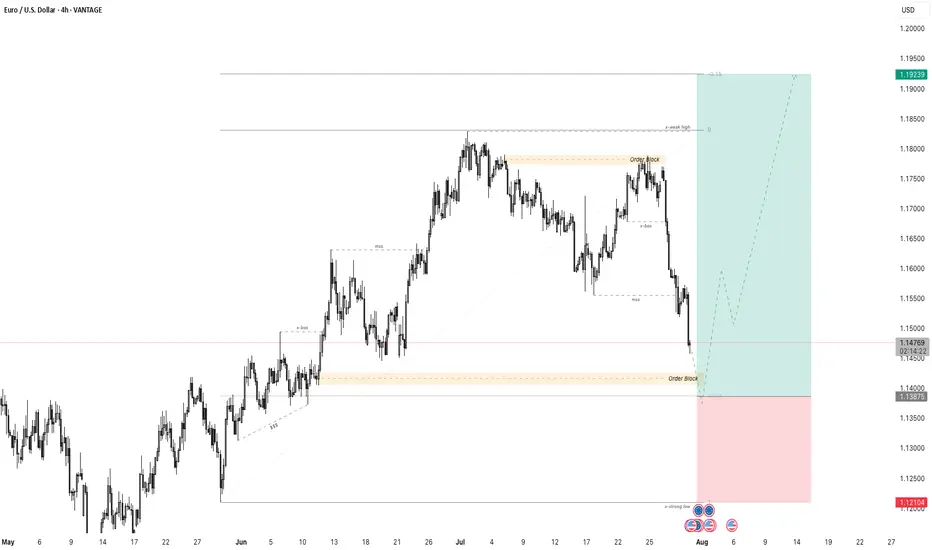
EURUSD - 4-Hour Chart with Order Block Reversal StrategyThe EUR/USD 4-hour chart shows a significant bearish retracement approaching a well-defined order block zone, which represents a potential strong support area where major buyers may step in.
Price has experienced a clear downtrend following a break of structure (BOS) from the recent high near 1.18000 into the order block area around 1.13900 - 1.14150. This order block acts as a demand zone where smart money is anticipated to accumulate buy orders, making it a critical level to watch for potential market reversal.
The trading plan anticipates price will test this order block support and generate bullish reversal signals such as price rejection candlesticks or increased buying volume. Confirmation at this zone sets up a potential long trade aiming for a significant retracement to the previous weak high near 1.19200, targeting a strong risk-to-reward opportunity.
Risk management is vital, placing stop losses just below the lower boundary of the order block to protect against false breakouts or further downside continuation.
This plan combines market structure analysis, smart money concepts of order blocks, and technical confirmation to capture a high-probability reversal trade. Traders should patiently wait for clear reversal signals before entry and monitor price action closely within the order block for optimal trade timing.
EUR-USD Free Signal! Buy!
Hello,Traders!
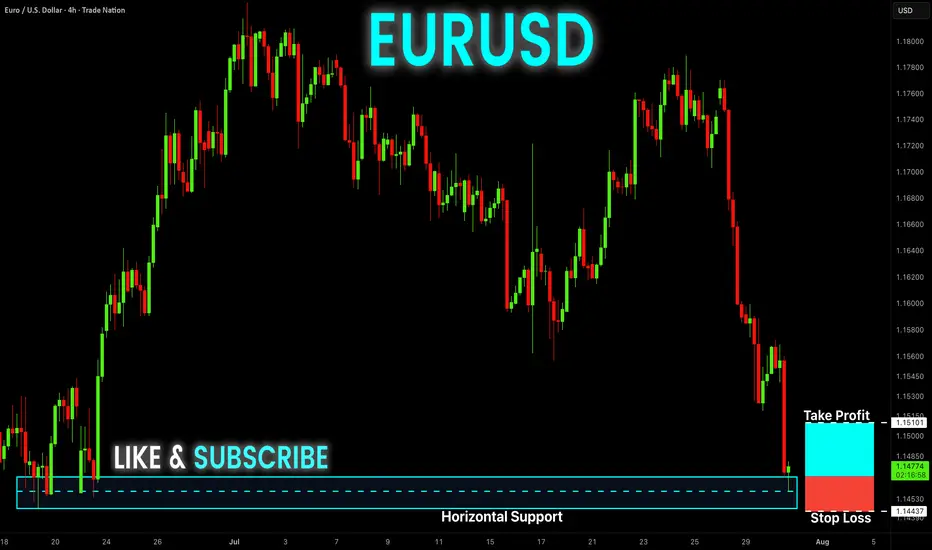
EUR-USD keeps falling and
The pair is locally oversold so
As the pair is retesting the
Horizontal support level
Of 1.1468 we can enter a
Long trade with Take Profit
Of 1.1510 and Stop Loss
Of 1.1443
Buy!
Comment and subscribe to help us grow!
Check out other forecasts below too!
Disclosure: I am part of Trade Nation's Influencer program and receive a monthly fee for using their TradingView charts in my analysis.
Ursulization = Bureaucracy > Democracy (a.k.a. The Glasgow Kiss)🤝💥 Ursulization – Bureaucracy Replaces Democracy (a.k.a. The Glasgow Kiss) 🇺🇸🇪🇺
📍Background:
The media spun it as a "15% tariff agreement"…
But in reality, this wasn’t diplomacy — it was a disguised capitulation.
And the stage? None other than Scotland, ancestral ground of Donald J. Trump.
So when Ursula von der Leyen came seeking a gentle diplomatic handshake…
What she received instead was the infamous Glasgow Kiss — sudden, sharp, and unmissable.
💥 What’s a Glasgow Kiss?
A British slang term for a violent headbutt to the face —
No grace. No warning. Just raw force.
💬 The Real Story:
Ursula von der Leyen — unelected, unaccountable —
signed off on $1.4 trillion in U.S.-bound capital flows:
💸 $750B to buy American energy
🛠 $600B in U.S. infrastructure, defense & industry
All to sidestep 50% tariffs the Trump team had ready to roll.
But here's the kicker:
She wasn’t acting on behalf of European citizens.
She was speaking for the bureaucracy, not the people.
🔥 Welcome to Ursulization:
Where democracy is sidelined by unelected power.
Where negotiations happen in silence.
Where scandals like PfizerGate get buried while the euro breaks down.
📉 EUR/USD just lost key support at 1.14776 —
The chart shows t he cost of surrender.
💉 PfizerGate Reminder:
Ursula already faced heat for secretive vaccine contracts with Pfizer.
Now, she’s handing over Europe’s industrial backbone —
To Trump. In Scotland. With no public mandate.
📌 Conclusion:
Trump didn’t compromise — he collided.
Europe didn’t resist — it surrendered.
This wasn’t diplomacy.
It was a Glasgow Kiss — a collision between legitimacy and bureaucratic power.
👑 One elected by the people (Trump). One not elected at all (Woke agenda style Ursula).
💰 One walks away with trillions (Trump). The other, with silence (Ursula 'Von der Pfizinen never electenen'').
One Love,
The FXPROFESSOR 💙
ps. Till we can bring Democracy and Europe back.
Disclosure: I am happy to be part of the Trade Nation's Influencer program and receive a monthly fee for using their TradingView charts in my analysis. Awesome broker, where the trader really comes first! 🌟🤝📈

EURUSD DOWN SIDE The dollar index (DXY00) on Tuesday rose by +0.22% and posted a 5-week high. The dollar has carryover support from Monday following the EU-US trade deal that is seen as favoring the US. Also, expectations for the Fed to keep interest rates unchanged at the end of Wednesday's 2-day FOMC meeting are supportive of the dollar. The dollar extended its gains after the US Jun advance goods trade deficit unexpectedly shrank, a supportive factor for Q2 GDP, and after July consumer confidence rose more than expected.

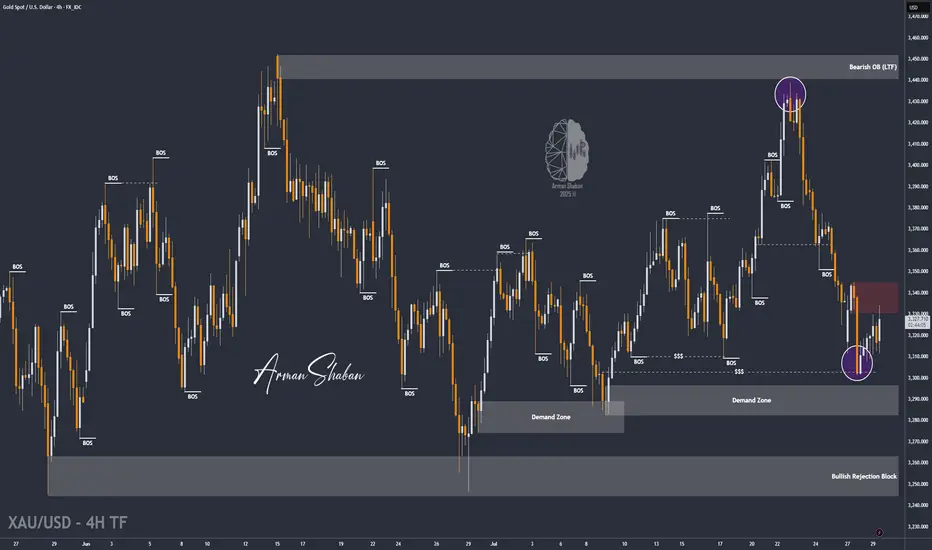
XAU/USD | Gold Below $3345 – Key Demand Awaits at $3282–$3296!By analyzing the gold chart on the 4-hour timeframe, we can see that after dropping to the $3301 area, strong demand came in, helping the price stabilize above $3300 and rally up to over $3334. Currently, gold is trading around $3331. If the price fails to break and hold above $3345 within the next 8 hours, we may see a price correction soon. A key demand zone lies between $3282–$3296, where a strong bullish reaction could occur if price revisits this area. Important supply levels to watch are $3366, $3382, $3393, and $3404.
Please support me with your likes and comments to motivate me to share more analysis with you and share your opinion about the possible trend of this chart with me !
Best Regards , Arman Shaban
EURUSDHello Traders! 👋
What are your thoughts on EURUSD?
EUR/USD kicked off the week with a sharp drop of nearly 200 pips, driven by renewed concerns over U.S. tariff policies. This strong bearish momentum signals intensified selling pressure across the board.
The pair is now approaching a support zone, which has previously triggered bullish reactions.
However, given the current strong bearish sentiment, there is a real risk this support may not hold.
Our bias remains bearish overall.
If the pair finds temporary support at this level, a short-term corrective bounce is possible.
But ultimately, we expect a continuation of the downtrend toward lower support levels after the correction completes.
Can this support zone stop the bleeding, or is more downside coming? Let us know your thoughts! 👇
Don’t forget to like and share your thoughts in the comments! ❤️
DeGRAM | EURUSD reached the lower boundary of the channel📊 Technical Analysis
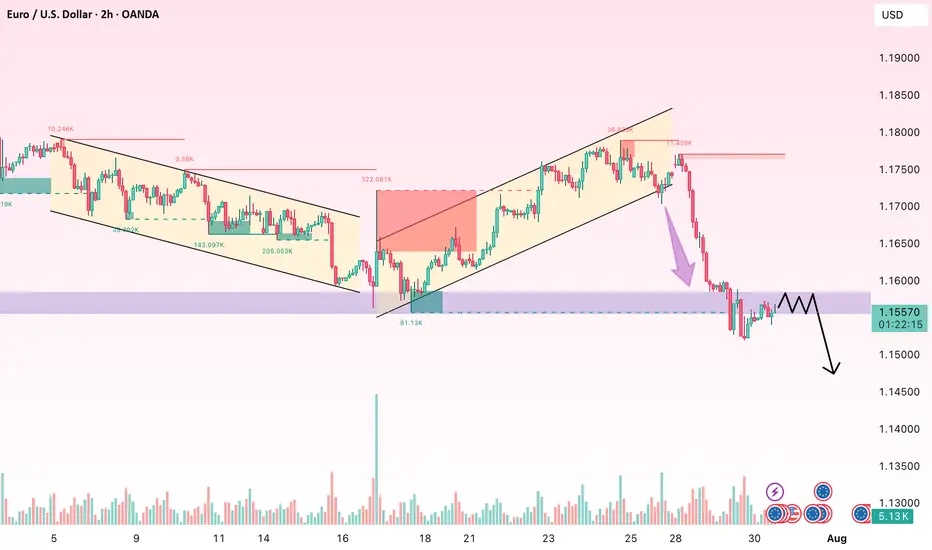
● Price sliced through the channel mid-support and the inner trend-fan, closing below 1.1573; the break was retested (grey circle) and rejected, confirming a bear continuation from the sequence of lower-highs.
● The move unlocks the descending channel’s lower rail near 1.1450, while interim demand sits at the May pivot / 0.618 swing 1.1520.
💡 Fundamental Analysis
● EZ data underwhelmed (German Ifo, EZ consumer-confidence) just as Fed officials warned rates may stay “restrictive for longer,” widening the short-rate gap and refreshing USD bids.
✨ Summary
Short 1.1590-1.1615; hold below 1.1573 targets 1.1520 ➜ 1.1450. Bias void on an H1 close above 1.1660.
-------------------
Share your opinion in the comments and support the idea with a like. Thanks for your support!
Getting short on EUR/USD!The dollar has looked set for a reversal and coming into the week it didn't hang around at all. I had a bit of a short bias on EUR/USD and was looking for confirmation signal which pretty much came at market open.
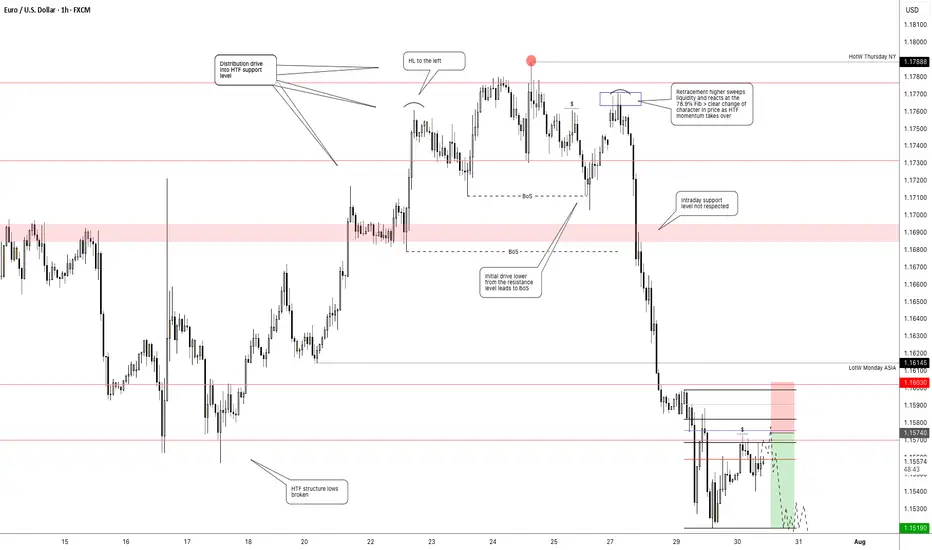
Price pushed higher back into the key level taking out a short term high, but was unable to follow through to form a new higher high. Heading into Monday London session, momentum immediately took hold with a clear bearish change of character and price didn't look back > breaking structure and key levels with minimal effort.
I was waiting for a pull back to get short early which didn't occur. But no need to chase price, waiting and patience is part of the game.
Price has now broken another key support level and is set to retest it as resistance. This will be my entry point (see screenshot) > using the 70.5%-78.6% fib retracement level and my stop above Tuesdays high. Keep it simple.
tradingview.sweetlogin.com/proxy-s3
EURUSD Breaks Trendline: Bearish Momentum in PlayHello guys!
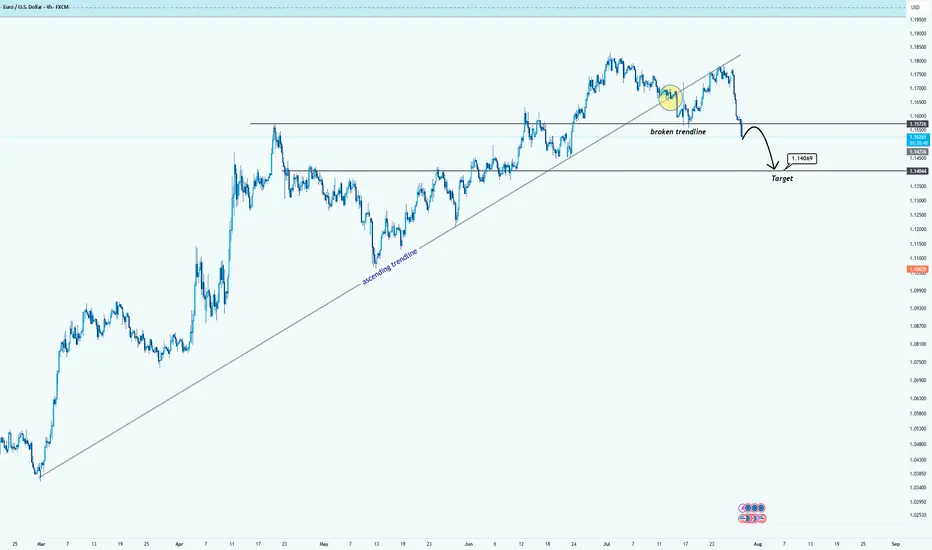
After months of climbing steadily along the ascending trendline, EURUSD has finally broken below support. The trendline breach, followed by a tight consolidation (yellow circle), hinted at a loss of bullish strength, and now the breakdown is in full motion.
Broken ascending trendline
Clear rejection after retest
Bearish continuation underway
Target area: 1.1400–1.1440 zone
If sellers maintain control, the price could descend toward the next major demand area.
EURUSD: Target Is Down! Short!
My dear friends,
Today we will analyse EURUSD together☺️
The price is near a wide key level
and the pair is approaching a significant decision level of 1.15428 Therefore, a strong bearish reaction here could determine the next move down.We will watch for a confirmation candle, and then target the next key level of 115186..Recommend Stop-loss is beyond the current level.
❤️Sending you lots of Love and Hugs❤️
Fundamental Market Analysis for July 30, 2025 EURUSDEvents to watch today:
30.07 15:30 EET. USD - Gross Domestic Product
30.07 21:30 EET. USD - FOMC Rate Decision
EURUSD:
Exclusive for our readers – a 202% bonus on deposits of $202 or more! Give the promo code PROFIT202 to customer support and start trading with TRIPLED capital.
EUR/USD remains under pressure amid stronger demand for the US Dollar ahead of the Federal Reserve decision (July 30, 2025). Market sentiment reflects the perception that the recent US–EU trade arrangements are relatively more favorable for the US economy, reinforcing expectations for stronger corporate earnings and a more supportive external balance in the coming months. Capital flows are skewed toward dollar-denominated assets, also because investors prefer to wait out key central‑bank communications in “quality” instruments.
A further driver is the divergence in macro momentum: the US economy shows greater resilience in consumption and labor markets, while the euro area faces constrained growth and a cautious ECB tone. With little reason for ECB tightening and with lingering risks for European industry and exports after tariff headlines, the euro’s fundamental support looks softer. Persisting uncertainty around the inflation path in the euro area adds to the preference for the USD.
Given these factors, the near‑term fundamental tilt remains to the downside for EURUSD. Risks to this view include unexpectedly dovish Fed communication, a pullback in US Treasury yields, and/or positive euro‑area data surprises that could improve growth expectations and support the euro.
Trading recommendation: SELL 1.15650, SL 1.16000, TP 1.15150
