EURUSD Set To Grow! BUY!
My dear followers,
This is my opinion on the EURUSD next move:
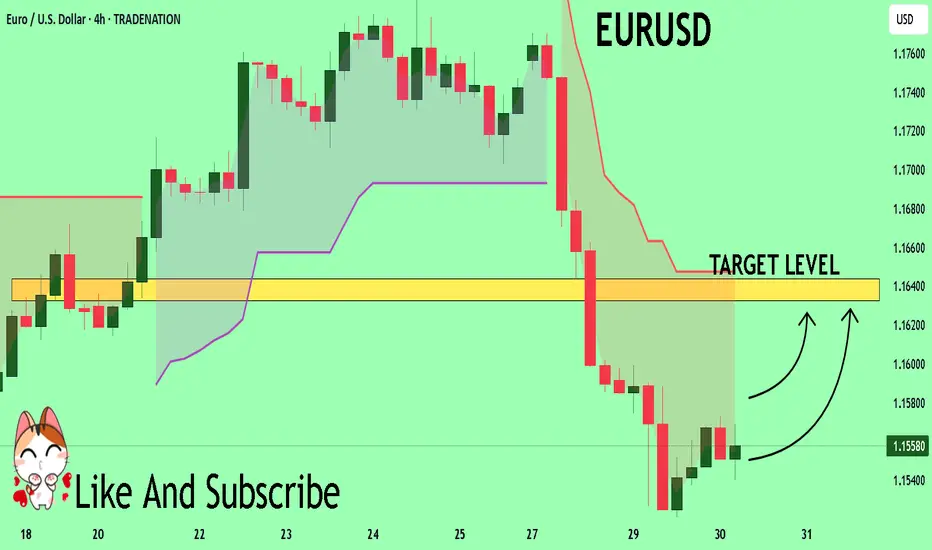
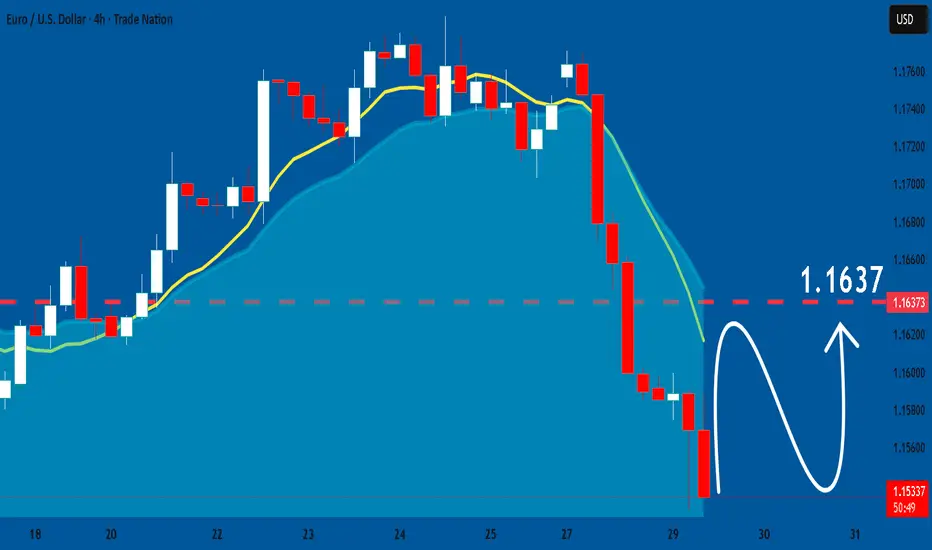
The asset is approaching an important pivot point 1.1557
Bias - Bullish
Technical Indicators: Supper Trend generates a clear long signal while Pivot Point HL is currently determining the overall Bullish trend of the market.
Goal - 1.1632
About Used Indicators:
For more efficient signals, super-trend is used in combination with other indicators like Pivot Points.
Disclosure: I am part of Trade Nation's Influencer program and receive a monthly fee for using their TradingView charts in my analysis.
———————————
WISH YOU ALL LUCK
Eurusd-3
BTC - Bulls vs Bears: who will win?Market Context
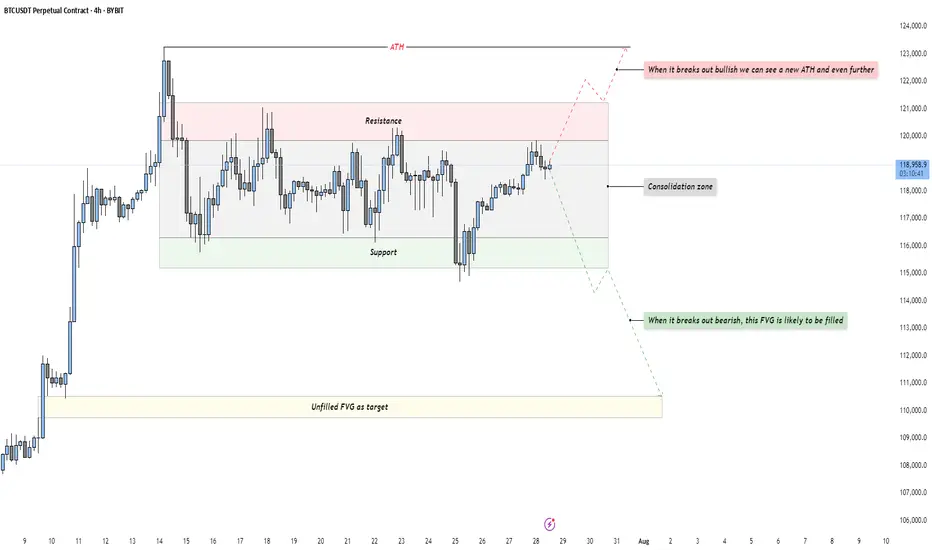
Bitcoin is trading in a tight consolidation just below its all-time high after a strong impulsive rally. This phase represents a balance of power between buyers and sellers, with neither side able to take control yet. Such a pause in momentum at this key level often builds pressure for a breakout move as liquidity pools accumulate above and below the range.
Consolidation Phase
The current range is clearly defined by a resistance area at the top and a support area at the bottom. Price has been oscillating within these boundaries without any sustained breakout attempts. This range-bound behavior is an essential part of the market cycle, as it allows larger players to build or distribute positions. The longer price stays in this box, the more significant the breakout that follows tends to be.
Bullish Breakout Scenario
If price breaks out decisively above resistance, it would indicate buyers have absorbed all the supply at these levels. Such a breakout opens the path to a new all-time high and could potentially extend far beyond as trapped shorts are forced to cover. For traders, a retest of the breakout level on lower timeframes could provide a low-risk entry point for continuation to the upside.
Bearish Breakout Scenario
On the flip side, if support fails, the market will likely gravitate toward the unfilled Fair Value Gap left behind during the previous rally. This inefficiency becomes a natural draw for price, offering a logical downside target for a corrective move. A clean break below the range followed by a retest from underneath could present shorting opportunities for those aiming to capture that move into the FVG.
Final Words
Patience and precision are key when dealing with setups like this. Let the market come to your level — and react with intent.
If you found this breakdown helpful, a like is much appreciated! Let me know in the comments what you think or if you’re watching the same zones.
DXY Rebound Pulls EURUSD Below 1.16Following the DXY’s significant rebound off a 17-year trendline, the EURUSD has broken below a trendline that connected all consecutive lows of 2025. This opens the door to further bearish risks, with key support levels now in sight.
If the pair closes cleanly below 1.15, 1.1440 and 1.1380, downside extensions could reach 1.12 and 1.11, respectively.
On the upside, a close back above the 2025 trendline and the 1.18 mark could reinstate bullish momentum, potentially lifting the pair toward the 2021 highs between 1.20 and 1.23.
Written by Razan Hilal, CMT
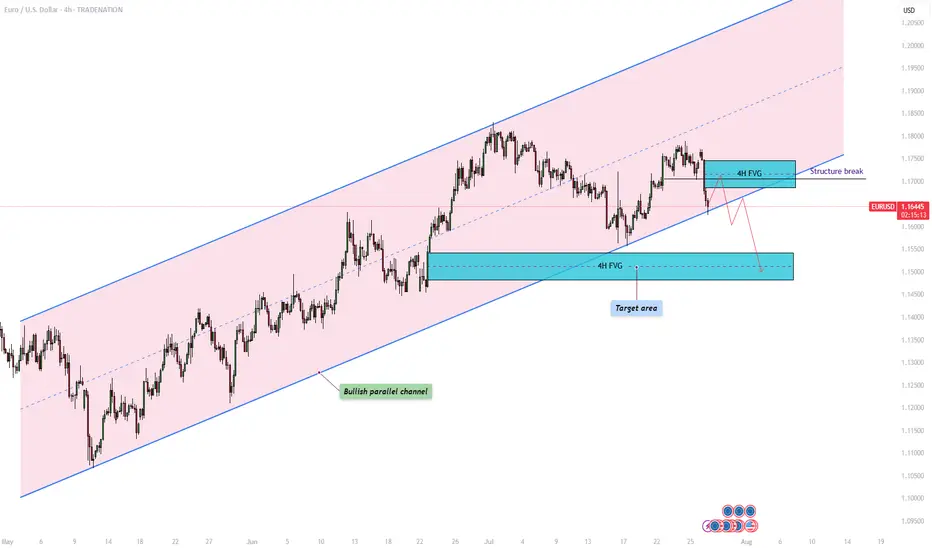
EURUSD – Will the bullish parallel channel hold?The EUR/USD currency pair is currently trading within a clearly defined bullish parallel channel, as shown on the 4-hour chart. This channel has provided consistent directional structure over recent weeks, with price respecting both its upper resistance and lower support boundaries. At present, the pair is approaching the lower end of this channel, raising the critical question: will it bounce off support and continue the bullish trajectory, or will it decisively break down, opening the door to lower price targets?
Bullish parallel channel
On the 4-hour timeframe, the EUR/USD has been consistently moving within a bullish parallel channel, characterized by higher highs and higher lows. This price structure suggests sustained upward momentum, with the top of the channel acting as dynamic resistance and the bottom as reliable support. Today, price action is testing the lower boundary of the channel once again. A successful hold at this level could confirm continued bullish structure and open the door for a potential rebound.
Bullish scenario
In the bullish scenario, the EUR/USD holds its ground at the support region around 1.164, where the lower boundary of the channel intersects with price. For upward continuation, it must overcome the short-term resistance posed by the 4-hour Fair Value Gap (FVG) between 1.169 and 1.174. A reclaim and close above this zone could signal a shift in short-term momentum and lead to a move back toward the upper boundary of the channel. However, the path upward is not without resistance , price must navigate through potential supply zones and maintain higher lows to preserve the bullish structure.
Bearish scenario
On the other hand, a break and close below the channel support could indicate a change in market sentiment and invalidate the bullish pattern. In this bearish case, we would expect a structure break confirmation followed by a possible retest of the broken trendline and the 4-hour FVG. If this retest fails to reclaim the trendline, bearish continuation becomes more likely. The next significant area of interest lies around the 1.150 level, where a bullish 4-hour FVG exists. This zone could act as a potential short-term support and serve as a target for the downside move before any meaningful bounce occurs.
Final thoughts
The EUR/USD pair is currently at a technical crossroads. Traders should watch closely for price behavior around the lower channel boundary to determine whether bullish momentum will resume or whether a bearish breakout will set the tone for deeper retracement. Confirmation, either through a bounce or a breakdown with a retest, will be key in validating the next directional move.
-------------------------
Disclosure: I am part of Trade Nation's Influencer program and receive a monthly fee for using their TradingView charts in my analysis.
Thanks for your support. If you enjoyed this analysis, make sure to follow me so you don't miss the next one. And if you found it helpful, feel free to drop a like 👍 and leave a comment 💬, I’d love to hear your thoughts!
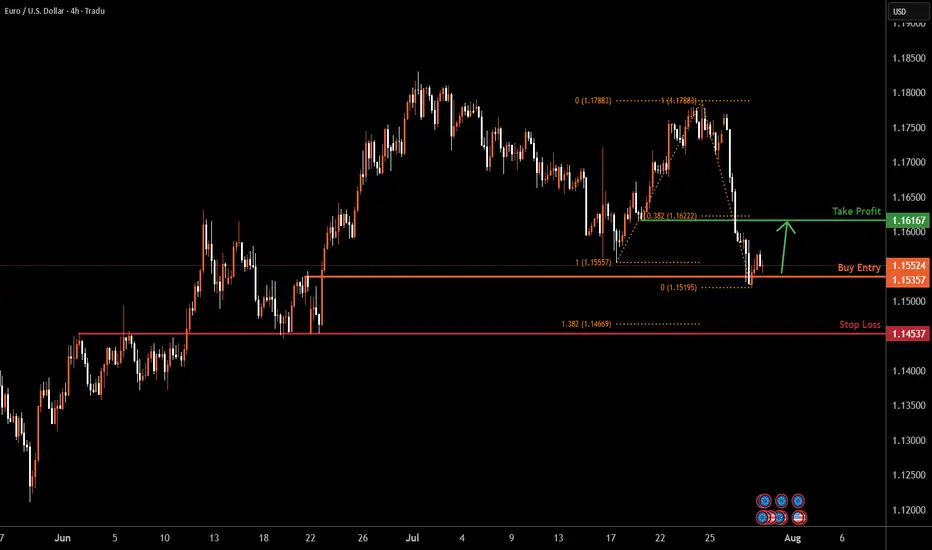
EURUSD | H4 Bullish bounce offBased on the H4 chart analysis, the price is reacting off the support level, which is a pullback support, and could rise higher.
Buy entry is at 1.1535, which is a pullback support.
Stop loss is at 1.1453, which is an overlap support that is underneath the 138.2% Fibonacci extension.
Take profit is at 1.1616, which is a pullback resistance that aligns with the 38.2% Fibonacci retracement.
High Risk Investment Warning
Trading Forex/CFDs on margin carries a high level of risk and may not be suitable for all investors. Leverage can work against you.
Stratos Markets Limited (tradu.com ):
CFDs are complex instruments and come with a high risk of losing money rapidly due to leverage. 65% of retail investor accounts lose money when trading CFDs with this provider. You should consider whether you understand how CFDs work and whether you can afford to take the high risk of losing your money.
Stratos Europe Ltd (tradu.com ):
CFDs are complex instruments and come with a high risk of losing money rapidly due to leverage. 66% of retail investor accounts lose money when trading CFDs with this provider. You should consider whether you understand how CFDs work and whether you can afford to take the high risk of losing your money.
Stratos Global LLC (tradu.com ):
Losses can exceed deposits.
Please be advised that the information presented on TradingView is provided to Tradu (‘Company’, ‘we’) by a third-party provider (‘TFA Global Pte Ltd’). Please be reminded that you are solely responsible for the trading decisions on your account. There is a very high degree of risk involved in trading. Any information and/or content is intended entirely for research, educational and informational purposes only and does not constitute investment or consultation advice or investment strategy. The information is not tailored to the investment needs of any specific person and therefore does not involve a consideration of any of the investment objectives, financial situation or needs of any viewer that may receive it. Kindly also note that past performance is not a reliable indicator of future results. Actual results may differ materially from those anticipated in forward-looking or past performance statements. We assume no liability as to the accuracy or completeness of any of the information and/or content provided herein and the Company cannot be held responsible for any omission, mistake nor for any loss or damage including without limitation to any loss of profit which may arise from reliance on any information supplied by TFA Global Pte Ltd.
The speaker(s) is neither an employee, agent nor representative of Tradu and is therefore acting independently. The opinions given are their own, constitute general market commentary, and do not constitute the opinion or advice of Tradu or any form of personal or investment advice. Tradu neither endorses nor guarantees offerings of third-party speakers, nor is Tradu responsible for the content, veracity or opinions of third-party speakers, presenters or participants.
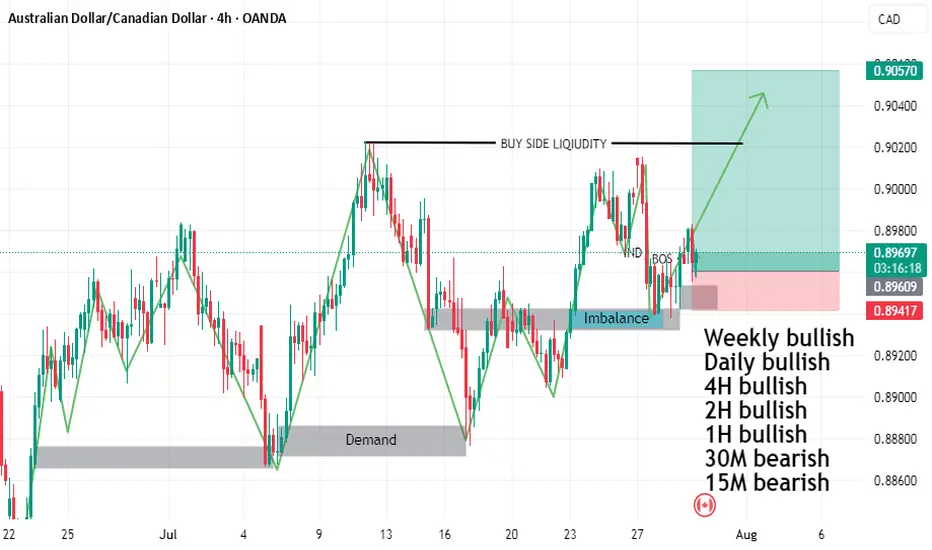
AUDCAD BUY SETUPTHE PRICE FORMED HEAD AND SHOULDER
and do rejection from mitigation order block and imbalance
and we have liquidity on time frame daily buy side liquidity
and time frame weekly double top
so I will buy with you
DON'T forget to follow me so that get more refresh analysis
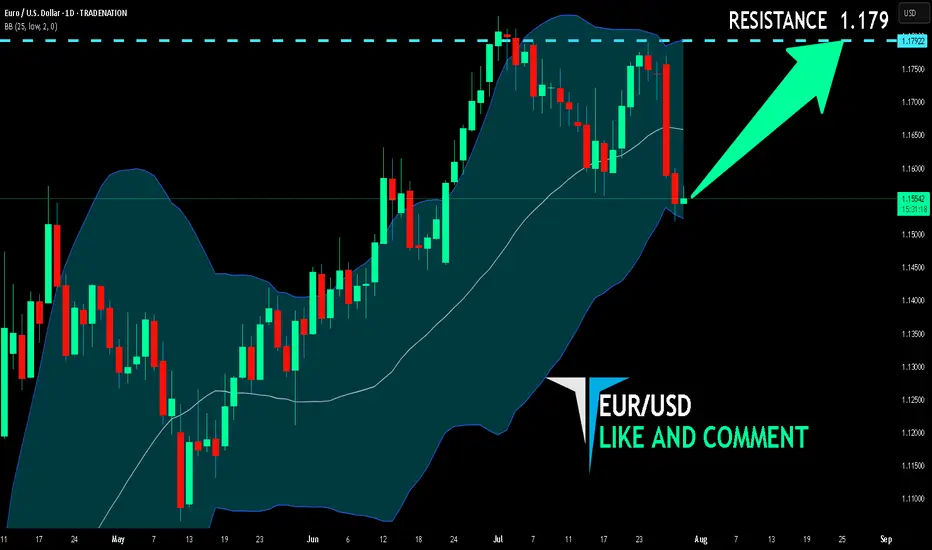
EUR/USD BULLISH BIAS RIGHT NOW| LONG
Hello, Friends!
EUR/USD pair is in the uptrend because previous week’s candle is green, while the price is obviously falling on the 1D timeframe. And after the retest of the support line below I believe we will see a move up towards the target above at 1.179 because the pair is oversold due to its proximity to the lower BB band and a bullish correction is likely.
Disclosure: I am part of Trade Nation's Influencer program and receive a monthly fee for using their TradingView charts in my analysis.
✅LIKE AND COMMENT MY IDEAS✅
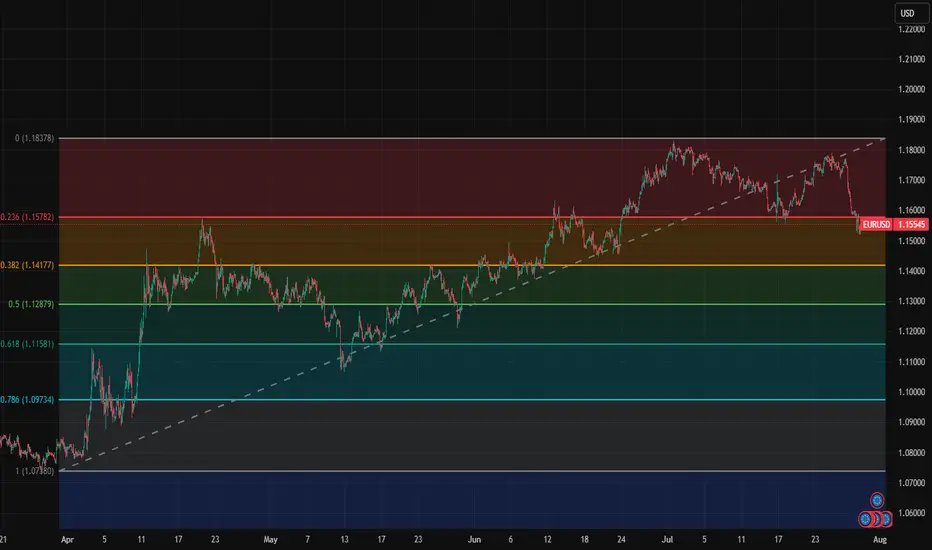
EurUsd short term key levelsThese are short term key levels for intra day and swing trading on 1h chart.
1.0718
1.0973
1.1158
1.1288
1.1418
1.1578
1.1838
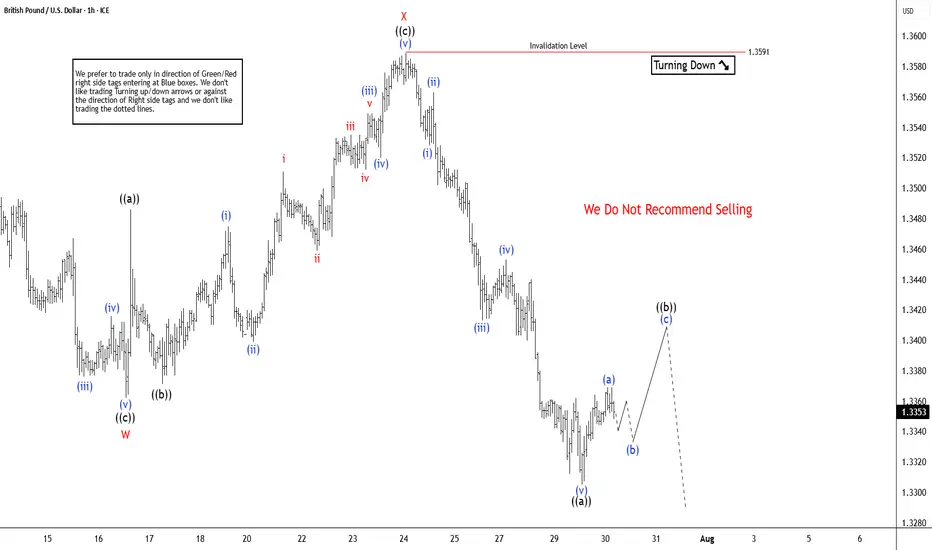
GBPUSD Elliott Wave Insight Bounce Should Fail Into Support ZoneThe GBPUSD is trading in higher high sequence from 9.22.2022 low in weekly. The bounce is corrective Elliott Wave sequence & expect further upside. It favors pullback in proposed 7 swings from 7.01.2025 high & extend into 1.3162 – 1.2898 area, while below 7.23.2025 high. It should find buyers into extreme area for next leg higher in daily or at least 3 swings bounce. In 4-hour, it started correcting lower from 7.01.2025 high. It ended W at 1.3362 low of 7.16.2025 & X at 1.3589 high of 7.23.2025 each in 3 swings. Below X high, it favors downside in Y in 3 swings as it broke below 7.16.2025 low, expecting into extreme area. Within W, it ended ((a)) at 1.3523 low, ((b)) at 1.3620 high & ((c)) at 1.3362 low. Above there, it placed ((a)) at 1.3486 high, ((b)) at 1.3371 low & ((c)) as X connector at 1.3589 high. The double correction unfolds in 3-3-3 structure, which will complete, when current bounce fails below 7.23.2025 high to new low into extreme area. It ended ((a)) of Y into 0.618 – 0.764 Fibonacci extension area of W & expect 3 or 7 swings bounce in ((b)).
Below X high, it placed ((a)) of Y at 1.3305 low & favors bounce in ((b)) in 3 or 7 swings against 7.23.2025 high. Within ((a)), it ended (i) at 1.3528 low, (ii) at 1.3563 high, (iii) at 1.3413 low, (iv) at 1.3543 high & (v) at 1.3305 low. Above there, it favors bounce in (a) of ((b)) and expect small upside before it should pullback in (b). The next pullback in (b) should stay above 1.3305 low choppy price action before continue upside in (c). Ideally, ((b)) can bounce between 1.3413 – 1.3481 area as 0.382 – 0.618 Fibonacci retracement of ((a)) before continuing lower. Wave ((b)) bounce expect to fail below 1.3591 high before extending lower in ((c)) into 1.3162 – 1.2898 to finish double correction. Because of higher high in daily since September-2022 low, it should find buyers in extreme area to resume higher. It expects sideways to higher until FOMC event followed by selloff, while bounce fail below 7.23.2025 high. We like to buy the pullback into extreme area for next leg higher or at least 3 swings reaction.
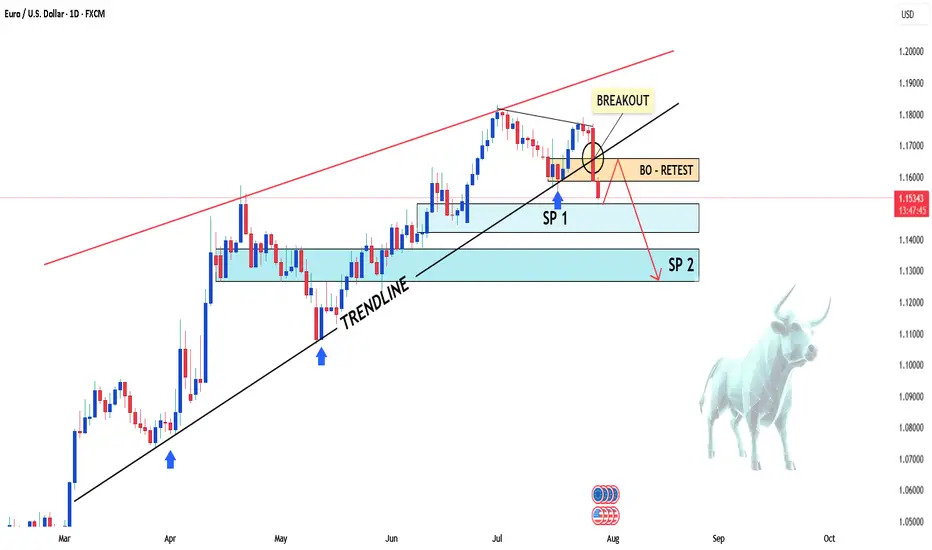
EUR/USD Slips Again – Just a Pullback or More to Come?Hey everyone! Great to have you back for another market chat today.
As of writing, EUR/USD remains under significant bearish pressure, currently trading near 1.154 — marking a rather gloomy start to the new trading week. The euro is clearly struggling to attract buying interest as traders reassess the ECB’s stance and digest the newly announced EU–US trade agreement. Meanwhile, the U.S. dollar is gaining momentum, flipping the trend unexpectedly.
From a technical perspective, EUR/USD is showing clear weakness. The pair has broken below both its rising wedge and previous uptrend line, with candles closing firmly lower — a strong sign that the bears are in control.
In my personal view, I expect EUR/USD to continue sliding toward the next two support zones, although a minor pullback could occur first as part of a typical correction.
But what do you think? Is this just a dip… or the start of something bigger for EUR/USD? Let me know your take in the comments!
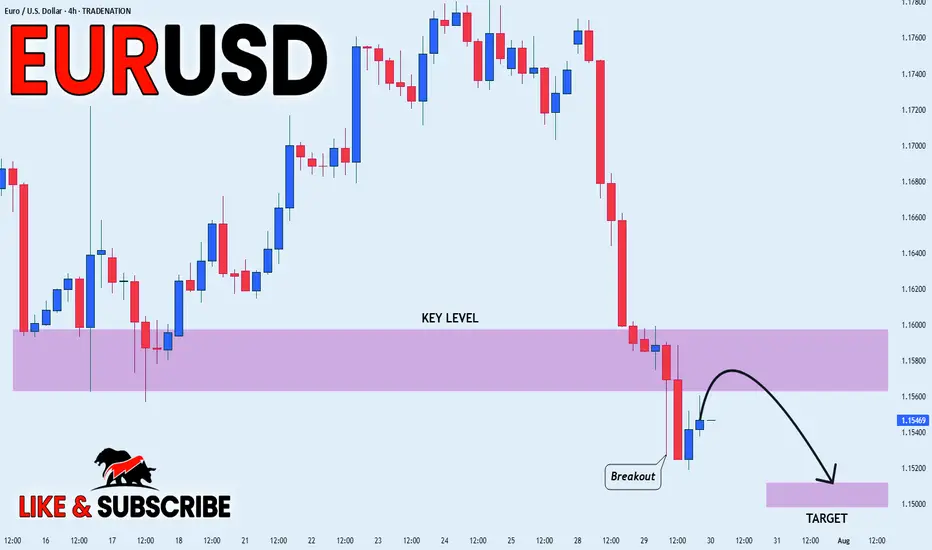
The euro extends sharp losses following the US-EU tariff deal
The euro weakened sharply against the dollar amid views that the US-EU tariff deal favors the US. European leaders voiced mixed reactions. Germany’s Chancellor Merz welcomed the agreement as a safeguard against economic damage, while Hungary’s PM Orbán criticized it as a one-sided win for the US. Meanwhile, the IMF raised its eurozone growth forecast from 0.8% to 1.0% in its July outlook, citing the lower-than-expected tariff levels as supportive of the region’s economy.
EURUSD broke below the ascending trendline and briefly tested the support at 1.1520. EMA21 has death-crossed EMA78, indicating the potential extension of bearish momentum.
If EURUSD fails to hold above the support at 1.1520, the price could decline further toward 1.1450. Conversely, if EURUSD breaches above the resistance at 1.1590, the price may gain upward momentum toward 1.1640.

Bullish reversal off pullback support?The Fiber (EUR/USD) has bounced off the pivot, which is a pullback support, and could rise to the 1st resistance, which is a pullback resistance.
Pivot: 1.1537
1st Support: 1.1456
1st Resistance: 1.1659
Risk Warning:
Trading Forex and CFDs carries a high level of risk to your capital and you should only trade with money you can afford to lose. Trading Forex and CFDs may not be suitable for all investors, so please ensure that you fully understand the risks involved and seek independent advice if necessary.
Disclaimer:
The above opinions given constitute general market commentary, and do not constitute the opinion or advice of IC Markets or any form of personal or investment advice.
Any opinions, news, research, analyses, prices, other information, or links to third-party sites contained on this website are provided on an "as-is" basis, are intended only to be informative, is not an advice nor a recommendation, nor research, or a record of our trading prices, or an offer of, or solicitation for a transaction in any financial instrument and thus should not be treated as such. The information provided does not involve any specific investment objectives, financial situation and needs of any specific person who may receive it. Please be aware, that past performance is not a reliable indicator of future performance and/or results. Past Performance or Forward-looking scenarios based upon the reasonable beliefs of the third-party provider are not a guarantee of future performance. Actual results may differ materially from those anticipated in forward-looking or past performance statements. IC Markets makes no representation or warranty and assumes no liability as to the accuracy or completeness of the information provided, nor any loss arising from any investment based on a recommendation, forecast or any information supplied by any third-party.

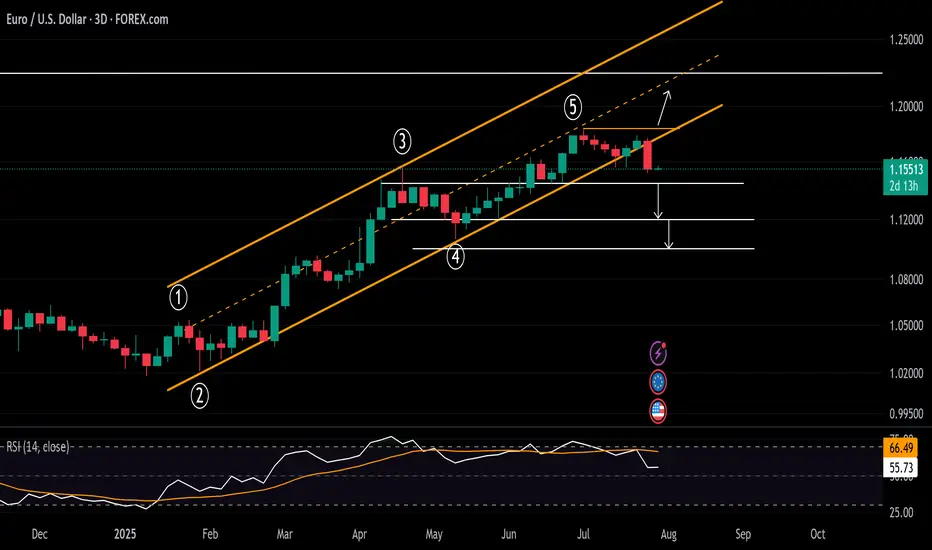
EUR/USD: The Last Bear Standing...As indicated on my previous EUR/USD idea ( that's still currently open ), I remain short EUR/USD given the technical aspect of things are still valid.
Divergences are still in play along with a rising broadening pattern and the fact that we're trading at the yearly R3 level ( which is rare ).
I suspect we will have some volatility with the ECB press conference tomorrow, so that should get things moving hopefully in the bearish direction. If we begin trading aggressively above 1.1800+, that will invalidate the short idea overall.
If we roll over, I'm still looking for 1.13000 - 1.12000 as the target range for Q3 going into Q4.
We'll see how this all develops.
As always, Good Luck & Trade Safe!

EUR_USD BEARISH BREAKOUT|SHORT|
✅EUR_USD broke the key
Structure level of 1.1580
While trading in an local downtrend
Which makes me bearish
And I think that after the retest of
The broken level is complete
A bearish continuation will follow
SHORT🔥
✅Like and subscribe to never miss a new idea!✅
Disclosure: I am part of Trade Nation's Influencer program and receive a monthly fee for using their TradingView charts in my analysis.
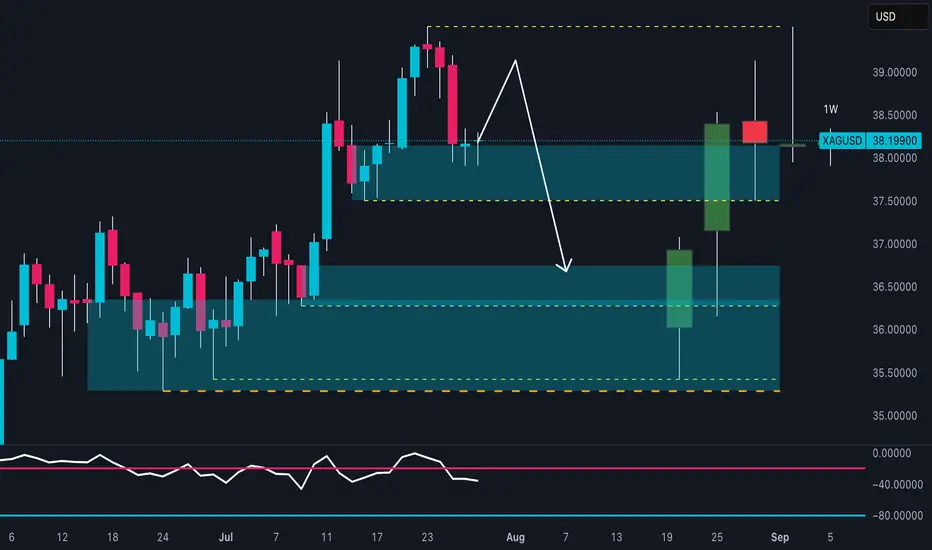
SILVER Is About to Collapse? Watch This Critical Supply Zone!Price recently tapped a high near 39.20 before sharply rejecting from the 38.80–39.20 supply zone, confirming strong selling pressure. The current structure shows:
- Supply zone tested and rejected
- Likely return to the previous demand zone (36.50–36.00)
- RSI is turning down, confirming loss of momentum
A pullback toward 38.30–38.50, followed by a bearish continuation toward the 36.50 area, which acts as a key structural and institutional support.
🗓️ Seasonality
Historically, July is bullish for silver:
Last 5Y average: +0.89%
Last 2Y average: +2.18%
However, August–September are bearish months:
August: mildly positive, but weak
September: consistently negative across all time frames (-0.86% to -1.10%)
This increases the probability of a downward move starting in early August, in line with current price action rejection.
🪙 Commitment of Traders (COT) – July 22
Non-Commercials (speculators):
Longs: +656
Shorts: -516
Commercials (hedging):
Longs: +1,337
Shorts: +916
➡️ Commercials are increasing both long and short exposure, while non-commercials remain net long — a sign of moderate optimism.
However, long positioning is slowing down compared to previous weeks. A potential exhaustion in bullish momentum is forming.
📉 Sentiment
52% short vs 48% long
Volume: more lots on the short side (492 vs 454)
Sentiment remains neutral to slightly contrarian bullish, but not extreme. This may allow for a fake breakout before a deeper move down.
🧩 Operational Summary
Main bias: Bearish short to mid-term (starting August), supported by:
- Technical rejection at supply
- Negative seasonal tendencies ahead
- RSI showing momentum loss
- COT showing stabilization, not accumulation
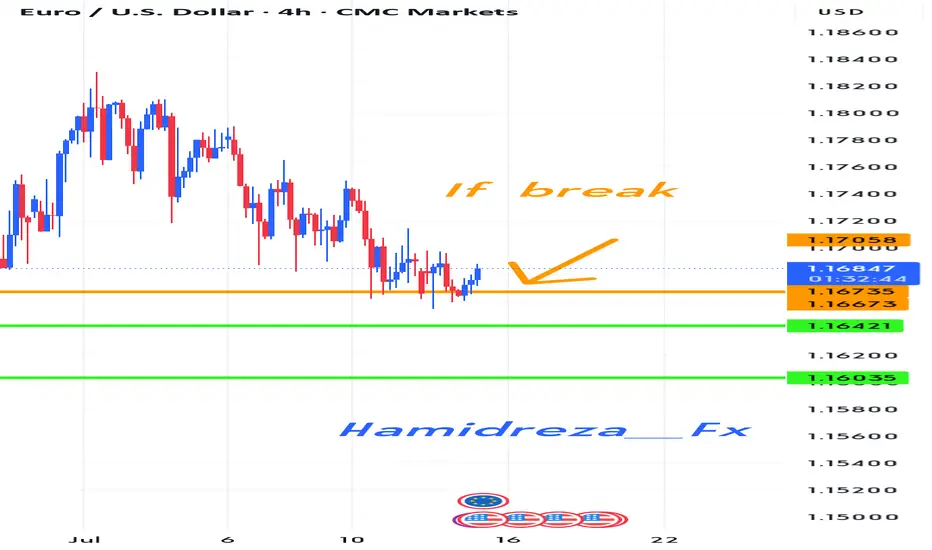
Is the EURUSD in a downtrend?
Hi my dears
It seems that the Eurusd has started a downward and corrective trend, however, the orange line condition must be met in order to enter a good trade with certainty.
I would be happy to hear your opinion.

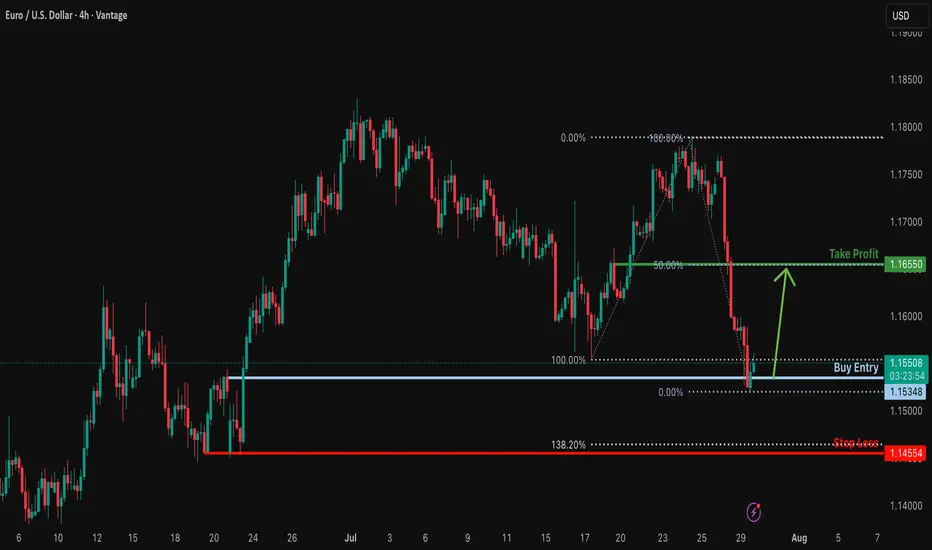
Bullish reversal?EUR/USD has bounced off the support level, which serves as a pullback support and could rise from this level to our take-profit target.
Entry: 1.1534
Why we like it:
There is a pullback support.
Stop loss: 1.1455
Why we like it:
There is a multi-swing low support.
Take profit: 1.1655
Why we like it:
There is a pullback resistance that aligns with the 50% Fibonacci retracement.
Enjoying your TradingView experience? Review us!
TradingView (tradingview.sweetlogin.com)
Please be advised that the information presented on TradingView is provided to Vantage (‘Vantage Global Limited’, ‘we’) by a third-party provider (‘Everest Fortune Group’). Please be reminded that you are solely responsible for the trading decisions on your account. There is a very high degree of risk involved in trading. Any information and/or content is intended entirely for research, educational and informational purposes only and does not constitute investment or consultation advice or investment strategy. The information is not tailored to the investment needs of any specific person and therefore does not involve a consideration of any of the investment objectives, financial situation or needs of any viewer that may receive it. Kindly also note that past performance is not a reliable indicator of future results. Actual results may differ materially from those anticipated in forward-looking or past performance statements. We assume no liability as to the accuracy or completeness of any of the information and/or content provided herein and the Company cannot be held responsible for any omission, mistake nor for any loss or damage including without limitation to any loss of profit which may arise from reliance on any information supplied by Everest Fortune Group.
Could something similar happen to the EURUSD?
Hi everyone
We are in a state of downward suffering
This state of suffering seems to continue
Of course, there is a condition that if the condition is met, we will probably see the first and second goals.
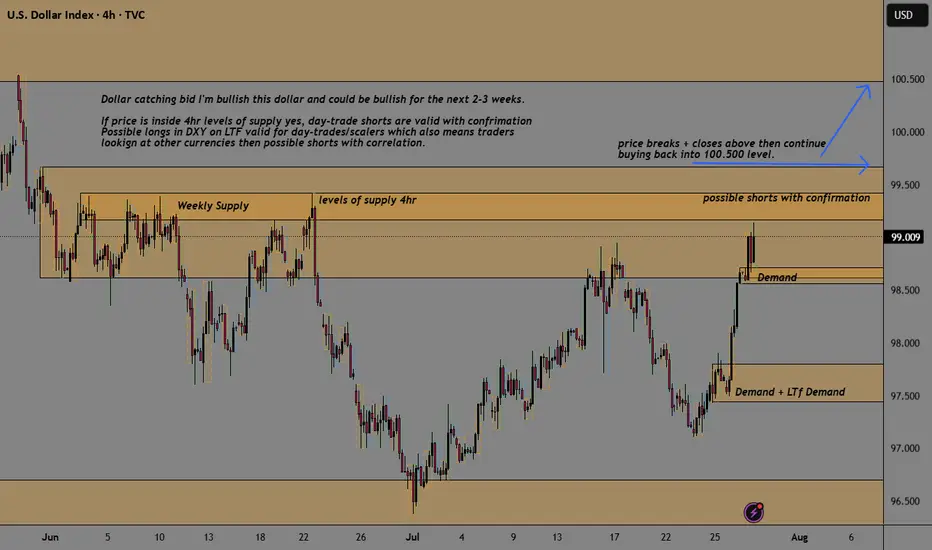
DXY Buyers Catching BidSee chart for analysis but even with price sitting inside levels of supply, we could easily see stronger Fundamentals coming out to drive this dollar back up into 100.5 areas of monthly supply. Short-term I remain bullish with long term views to the downside.
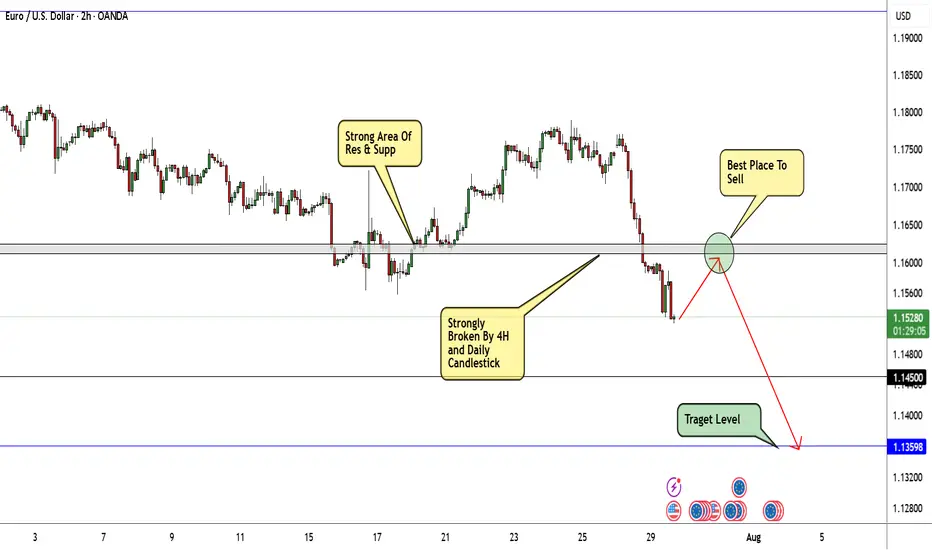
EUR/USD Will Continue Melting Be Sure To Be Part Of That!Here is my thought of EURUSD chart today. I think that this pair can go down further more specially after breaking this strong area of support and old resistance. as shown on the chart we can wait for the price to come back again and retest this area once and then this will be the best place to enter a sell trade. I am targeting around 250n pips in this trade. as I said I will wait for a retest and a good bearish price action and from there I will enter a sell trade.
EURUSD: Bullish Continuation is Expected! Here is Why:
Remember that we can not, and should not impose our will on the market but rather listen to its whims and make profit by following it. And thus shall be done today on the EURUSD pair which is likely to be pushed up by the bulls so we will buy!
Disclosure: I am part of Trade Nation's Influencer program and receive a monthly fee for using their TradingView charts in my analysis.
❤️ Please, support our work with like & comment! ❤️
EURUSD: Will Go Up! Long!
My dear friends,
Today we will analyse EURUSD together☺️
The price is near a wide key level
and the pair is approaching a significant decision level of 1.15675 Therefore, a strong bullish reaction here could determine the next move up.We will watch for a confirmation candle, and then target the next key level of 1.16318.Recommend Stop-loss is beyond the current level.
❤️Sending you lots of Love and Hugs❤️
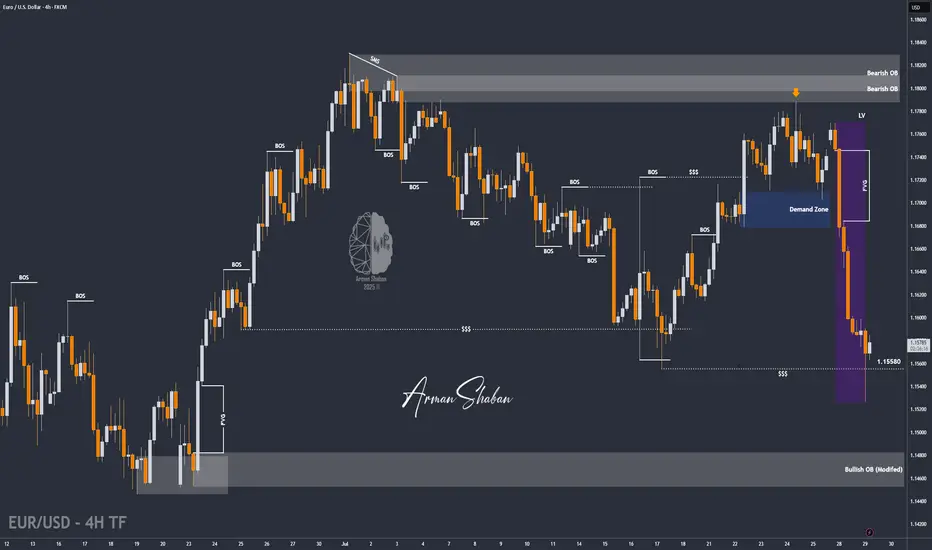
EUR/USD | Sweeps Liquidity and Rebounds – Eyes on 1.16700!By analyzing the EURUSD chart on the 4-hour timeframe, we can see that after our previous analysis, the price continued its decline and eventually swept the liquidity below 1.15580. Following that, strong demand kicked in, and the pair is currently trading around 1.15810. If the price can hold above this level, we can expect further bullish movement. The next potential targets are 1.1600, 1.16280, 1.16430, and 1.16700.
Please support me with your likes and comments to motivate me to share more analysis with you and share your opinion about the possible trend of this chart with me !
Best Regards , Arman Shaban