Corn at the Cliff Edge: Bearish Breakdown or Smart Money Trap?📉 1. Price Action & Technical Context (Weekly Chart – ZC1!)
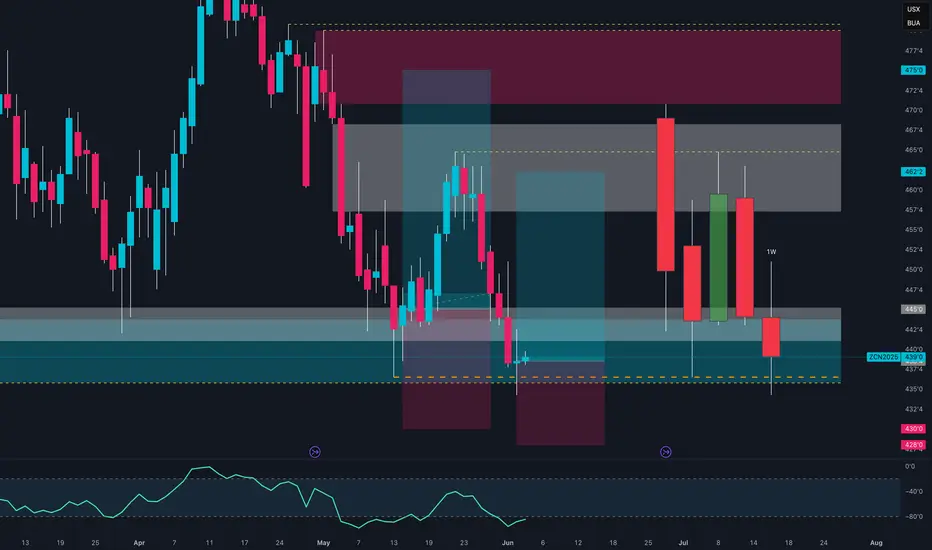
Price is currently sitting around 439'0, after rejecting the 462'2 supply zone (gray block) and confirming rejection from the macro supply area between 472'6–480'0 (red block).
The last four weekly candles show a failed recovery attempt (three green candles trapped between two strong red ones), culminating in a bearish breakout below the intermediate demand zone (445'0–442'0).
Now, price is back inside the key demand zone between 439'0–433'4, an area with heavy volume and previous significant lows.
🔍 Technical takeaway: Bearish breakout confirmed. Price is testing the last major weekly support before opening the door toward the yearly lows (~420'0).
📊 2. Commitment of Traders (COT Report – May 27, 2025)
Non-Commercials (Speculators):
Long: 324,377 (▼ -17,952)
Short: 344,710 (▼ -9,171)
Net Position: -20,333 → Bearish, but the unwinding of both sides suggests profit-taking.
Commercials (Institutions):
Long: 766,211 (▲ +12,588)
Short: 713,647 (▼ -962)
Net Position: +52,564 → Increasing → Institutional accumulation.
🔎 Key observation: Commercials are increasing their net longs, while speculators are reducing exposure. This diverges from price action and may signal institutional accumulation under 440.
📉 3. Net Positioning vs Price (COT Chart)
The chart shows a clear decline in speculative longs since March, with a new low this week.
Meanwhile, commercials are gradually increasing their long exposure, positioning themselves against the current bearish trend.
💡 Combined view: While price keeps dropping, the "smart money" is accumulating → possible bottom forming, though not yet confirmed technically.
🌾 4. Seasonality
June Performance:
20-Year Avg: -4.25%
15-Year Avg: +12.31%
5-Year Avg: +1.15%
2-Year Avg: +28.61%
📈 Seasonal Conclusion: The seasonal bias has turned strongly bullish in the last 2–5 years. June–July is often a rally period for Corn following the late-May bottoms — likely tied to U.S. planting season dynamics.
Eurusd-4
EUR/USD Reversal Imminent? 5 Powerful ReasonsEUR/USD – Tactical Bearish Outlook Ahead of Key Reversal
EUR/USD is approaching a critical inflection point where multiple technical and fundamental signals are aligning to suggest a potential short-term reversal.
📉 1. Price Action & Technical Structure (1W / 1D)
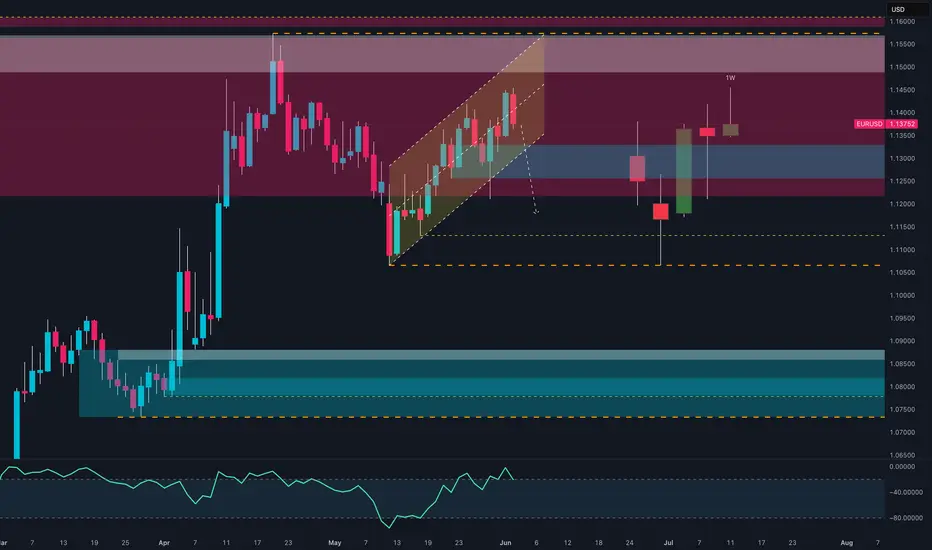
The pair recently completed a clean bullish structure inside an ascending channel, originating from the 1.0600 demand zone and reaching into the key supply area between 1.1400–1.1550.
Recent price behavior indicates:
A weekly candle with a strong upper wick, signaling institutional rejection.
A visible RSI bearish divergence, showing weakening momentum.
The most recent daily candle broke below the channel, suggesting a potential swing high.
Implication: A short-term reversal is likely, targeting the 1.1180 zone, with an extended move potentially reaching the 1.1050–1.1000 area.
🧠 2. COT Data – Institutional Positioning
USD Index:
Non-Commercials increased longs (+823) and slightly increased shorts (+363) — net bias still bullish USD.
Commercials also added to longs, further confirming institutional accumulation.
→ USD strength building.
EUR Futures:
Non-Commercials reduced longs (-1,716) and added shorts (+6,737).
The net long position in EUR continues to weaken.
→ Increasing risk of EUR retracement.
📅 3. Seasonality – EUR/USD in June
EUR/USD tends to be neutral to bearish in June.
The 5- and 10-year averages show consistent early-month declines, supporting a short bias in the first two weeks.
📊 4. Retail Sentiment
Sentiment is currently evenly split (50/50).
However, more volume is positioned long — a potential contrarian signal.
→ A break in this balance may trigger volatility and directionality.
🧭 5. Macro Context
Eurozone is facing stagnation, with falling inflation and weak growth.
U.S. data remains stronger, supporting the Fed’s “higher for longer” narrative.
→ This divergence favors a stronger USD in the near term.
✅ Trading Outlook
📉 Current Bias: Bearish (corrective)
📌 Short-Term Target: 1.1180
📌 Mid-Term Target: 1.1050–1.1000
❌ Invalidation: Weekly close above 1.1460
🎯 Strategy: Look for intraday rejection confirmations and sell pullbacks, in alignment with HTF structure and institutional flows.
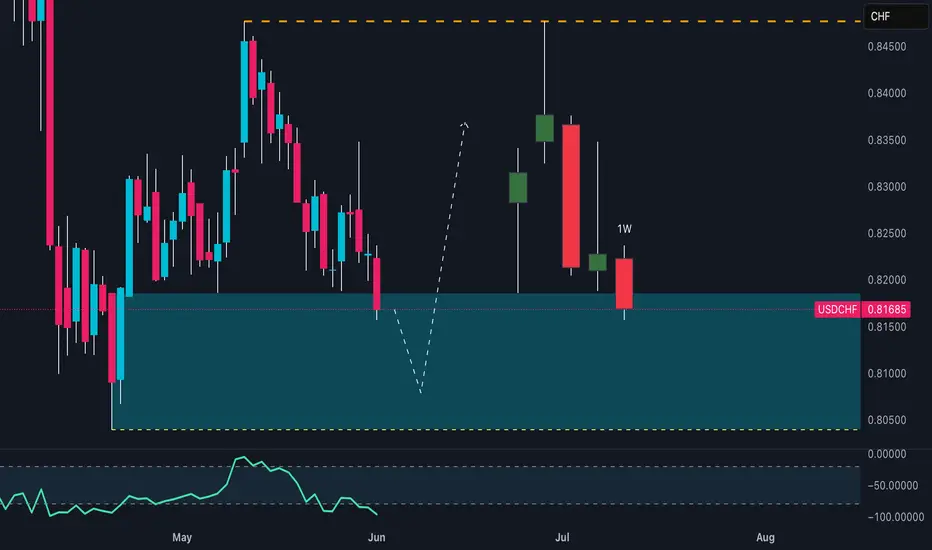
USD/CHF Setup Breaking Down: Don’t Get Caught Long This TrapUSD/CHF is currently trading at a critical technical and macro-structural juncture. Price is hovering within the weekly support area between 0.8050 and 0.8200, a zone that has historically triggered significant bullish reactions. However, the latest weekly candle closed below the psychological 0.8200 level, showing a clear rejection of upper resistance and signaling a lack of buying strength on the U.S. dollar side. This weak closure undermines the bullish structure and opens the door for a potential continuation of the downtrend—especially if price breaks below the 0.8150 mark on the daily or H4 timeframe.
From a seasonal standpoint, June has historically been a bearish month for USD/CHF. Monthly average returns over the past 20, 15, 10, and 5 years confirm steady downside pressure on the dollar against the Swiss franc. Only the 2-year average shows a slight positive bias, but it remains an outlier against the broader seasonal trend. This supports the idea that the recent weakness is not only technical but also cyclical in nature.
The Commitment of Traders (COT) report reinforces this bearish view. On the Swiss franc side, commercial traders (typically the most informed and hedging-oriented participants) are heavily net long, while non-commercial traders (speculators) remain significantly net short. This imbalance is often seen around reversal points and may indicate rising CHF strength. On the U.S. dollar side, positioning is far more balanced—the Dollar Index COT shows a neutral stance, with non-commercials slightly net long but without any dominant momentum. This confirms there’s currently no structural strength behind the dollar to justify a meaningful rebound in USD/CHF.
Lastly, retail sentiment provides a classic contrarian signal: over 90% of retail traders are long on USD/CHF, with only 10% short. This extreme imbalance typically occurs ahead of bearish breakdowns, as institutional players tend to fade overcrowded retail positions.
In conclusion, USD/CHF remains vulnerable to further downside. The weekly price action is weak, seasonal trends are dollar-negative, COT positioning favors CHF strength, and retail sentiment is extremely long-biased. All factors align toward a likely bearish continuation, with technical targets in the 0.8080–0.8050 range. The only alternative scenario would require a strong H4/H1 bullish reaction with a reclaim of 0.8220—but at this stage, that appears unlikely without a major macro catalyst.
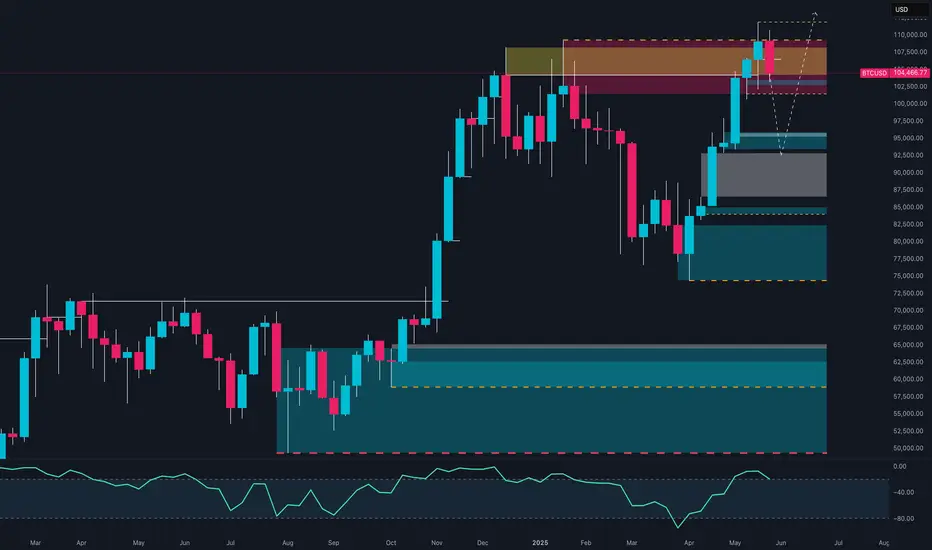
Bitcoin at a Crossroads: 110k RejectionAfter the powerful rally that began in the last quarter of 2024, Bitcoin is now at a critical market juncture. The price has once again reached the 106,000–110,000 USD zone, an area that already showed strong signs of distribution back in February and March 2025. This isn’t just a typical resistance level—it’s a psychologically loaded zone, marked by previous highs and repeated selling pressure.
In May, the monthly candle revealed a clear rejection from this zone: a prominent upper wick and a bearish body, signaling the bulls' struggle to sustain new highs. This behavior suggests the beginning of a profit-taking phase or, more likely, a medium-term consolidation.
The picture becomes even more complex when we look at the COT Report dated May 27, 2025. Non-commercial institutional traders—speculative funds, hedge funds, and portfolio managers—have significantly increased their short positions, now exceeding 26,800 contracts. Meanwhile, long positions are hovering around 24,500, resulting in a net bearish exposure. The message is clear: smart money isn’t buying the breakout—it's selling into it.
Seasonality analysis reinforces this narrative. Historically, June tends to be a weak month for Bitcoin, often followed by renewed strength in the next quarter. The 2025 seasonal curve has mirrored the bullish pattern of 2021 up to May, but now—consistent with historical patterns—is showing signs of slowing. This supports the idea that the market might need a breather before potentially rallying again in Q3.
From a technical standpoint, the key levels are well defined. The 95,000–97,000 USD area is the first dynamic support zone, where the price might find short-term relief. However, the more significant support lies between 82,000 and 85,000 USD—this is the origin of the current rally and aligns with the old breakout structure. A return to this level would represent a healthy and natural correction within a still structurally bullish long-term context.
In summary, the current outlook calls for caution. Momentum is fading, seasonality is unfavorable, and institutional players are trimming long exposure while adding to shorts. Until the price can consolidate above 110,500 USD, the dominant scenario remains a corrective pullback, with interim targets at 95k and potential drops toward the 85k zone.
However, if the market surprises with a strong weekly close above the highs, it could pave the way for a new leg up toward the 125,000–135,000 USD range—potentially fueled by macro catalysts such as ETF inflows, Fed narratives, or broader adoption.
EUR/USD - 4H Analysis - High Probability Trade Setup🔍 Bias: Bullish continuation (Wave 5 setup)
📌 Key Confluences:
Wave (4) is retracing into a key demand zone with strong volume support.
Price is approaching the 71% Fibonacci retracement, a proven institutional entry level.
Ichimoku cloud is holding as dynamic support.
Wave (5) projection targets 1.1550–1.1600 zone (Swing Range).
🎯 Trade Idea:
Buy EUR/USD between 1.1280 – 1.1320
Stop Loss: Below 1.1220 (invalidates wave count)
Take Profit: 1.1550 (1:3+ RR)
⚠️ Risk Note: Confirmation via bullish engulfing candle or volume spike would increase the entry's conviction.
This setup offers strong confluence for a wave 5 rally, making it a high-probability long trade toward the upper swing range.
Follow along for more setups

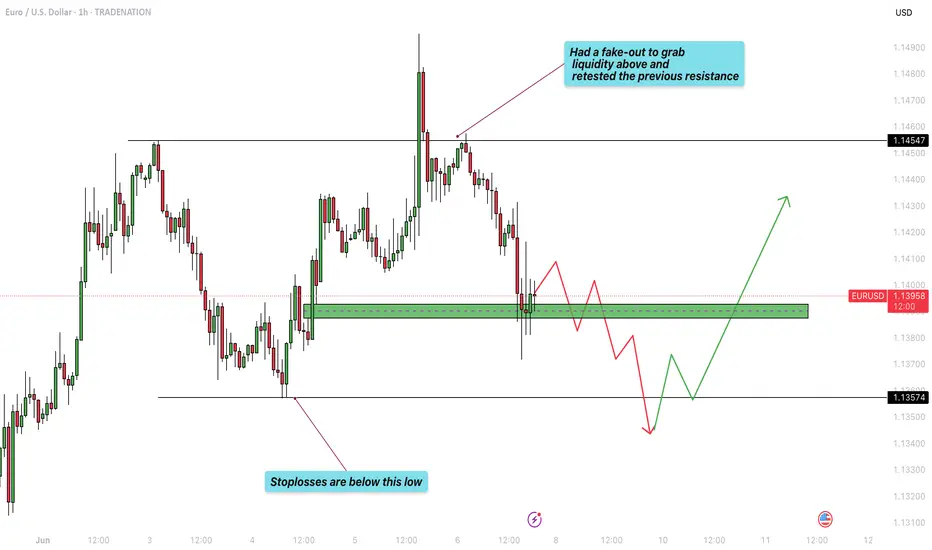
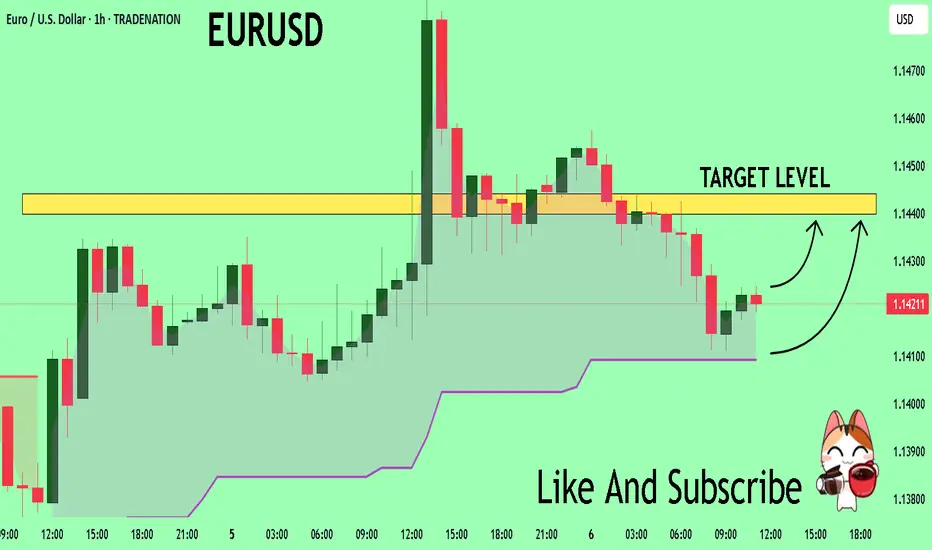
EUR/USD - After taking the highs, are the lows next?The EUR/USD currency pair is moving between two important price levels. The top level is 1.1454 and the bottom level is 1.1357. This means the price is staying inside a range. Yesterday, the price of EUR/USD went above the top level of 1.1454. By doing this, it triggered many stop-loss orders from traders who were expecting the price to go down. These traders had placed their stop-losses just above this level, and the market moved up to take them out.
Current support of the 1H FVG
Now, the price is starting to go down again. It is getting closer to the lower level of the range, which is around 1.1357. There is a chance that the market will go below this level as well. If that happens, it may take out the stop-loss orders of traders who are expecting the price to go up. These traders often place their stop-losses just below the low point of the range. When the market goes below the low, it collects liquidity. In simple words, it grabs the orders that are waiting there.
Looking at the chart, we can see that EUR/USD has found some support at the 1-hour Fair Value Gap (1H FVG). This area is acting like a short-term floor for the price. If a full 1-hour candle closes below this support area, then the price will likely fall further. In that case, it may reach the bottom of the range and possibly move below it to take out more stop-losses.
Why below support?
But why would the market go below the low on purpose? The reason is that many retail traders, those are small traders who trade from home, often put their stop-losses just below the recent low. If the market moves there, it activates those stop-losses. These stop-losses are usually sell orders, and when they get triggered, it gives the market extra selling power. After collecting this liquidity, the market often uses the new buying interest (from other traders entering long positions) to push the price back up again.
Conclusion
So in summary, the EUR/USD is still inside a range. It has already moved above the top to take out stop-losses, and now it might go below the bottom to do the same. After that, there could be a strong move upward, powered by the new liquidity in the market.
Disclosure: I am part of Trade Nation's Influencer program and receive a monthly fee for using their TradingView charts in my analysis.
Thanks for your support.
- Make sure to follow me so you don't miss out on the next analysis!
- Drop a like and leave a comment!
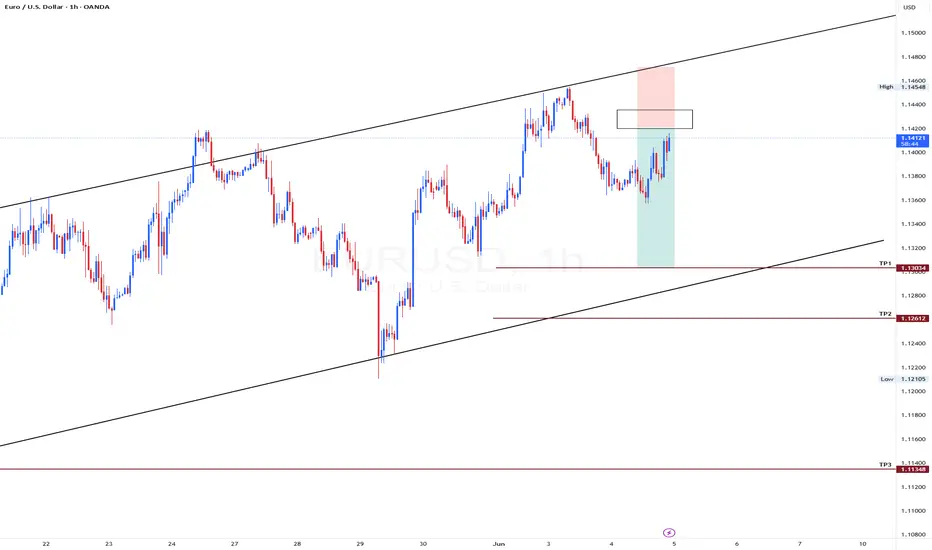
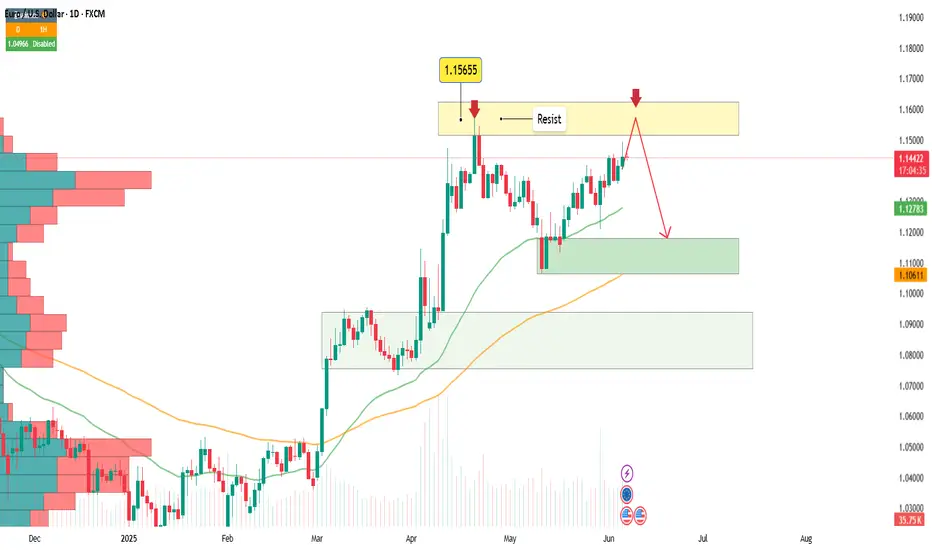
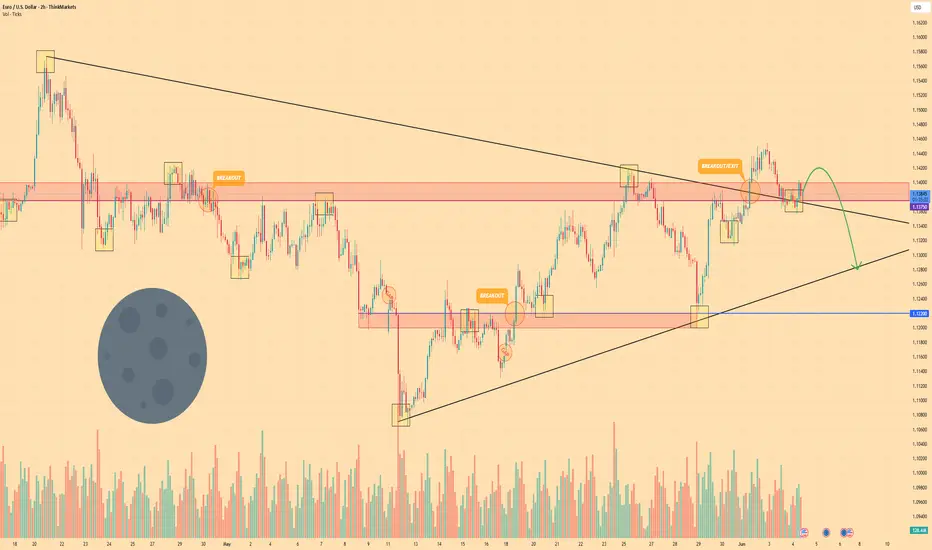
EURUSD - Look for Short (SWING) 1:2.5!Price has formed an ascending channel on the higher time frame, currently consolidating before potentially entering a distribution phase. A breakout could occur in either direction, but if the chart pattern plays out as expected, we may see a break below the key support level. Let’s aim for at least TP1.
Disclaimer:
This is simply my personal technical analysis, and you're free to consider it as a reference or disregard it. No obligation! Emphasizing the importance of proper risk management—it can make a significant difference. Wishing you a successful and happy trading experience!
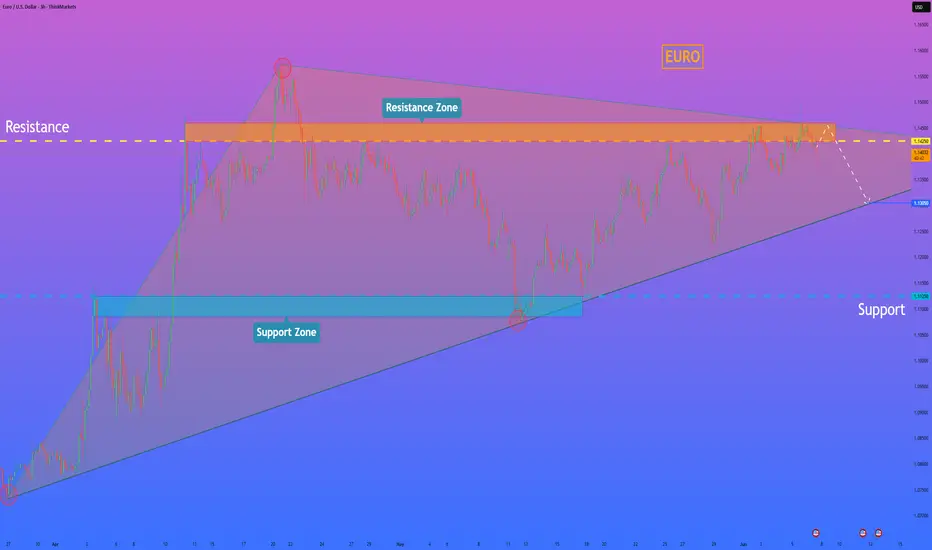
HelenP. I Euro may continue to decline to trend lineHi folks today I'm prepared for you Euro analytics. In this chart, we can see how the price reached the trend line and then started to grow inside a triangle pattern. Price some time traded near the trend line and then made an impulse up to the support level, which coincided with the support zone, and then made a correction, after which it turned around and made an impulse up one more time, breaking the support level. The euro reached the resistance level, which coincided with the resistance zone, and then made a small correction, after which it continued to move up and rose to the resistance line of the triangle. But then the Euro dropped below the resistance level, breaking it, and then continued to decline, after a retest. Price fell to the support zone, where it rebounded from the trend line, which is the support line of the triangle as well, and then started to grow. The euro has grown to a resistance zone, but recently it started to fall and now trades below the 1.1425 resistance level. So, I think that EURUSD will enter to resistance zone one more time and then continue to fall to the trend line. For this case, I set my goal at 1.1305 points, which coincided with this line. If you like my analytics you may support me with your like/comment ❤️
Disclaimer: As part of ThinkMarkets’ Influencer Program, I am sponsored to share and publish their charts in my analysis.
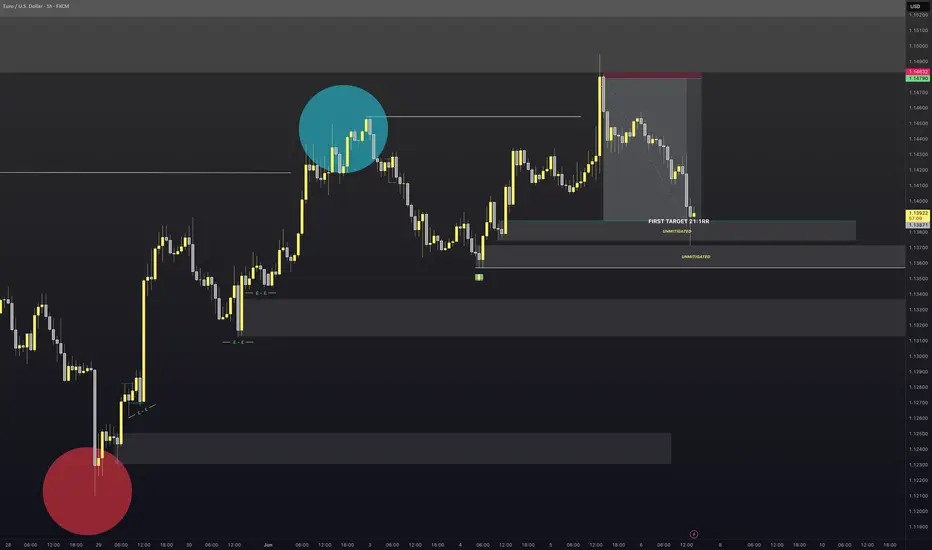
EURUSDVery important area now for EURUSD
Will the unmitigated OB's on the 1H stand strong or, will we continue lower. due to the HTF area of value.
Took a nice short on the 5min TF for a 1:21 RR.
Now lets see how this plays out should be really interesting
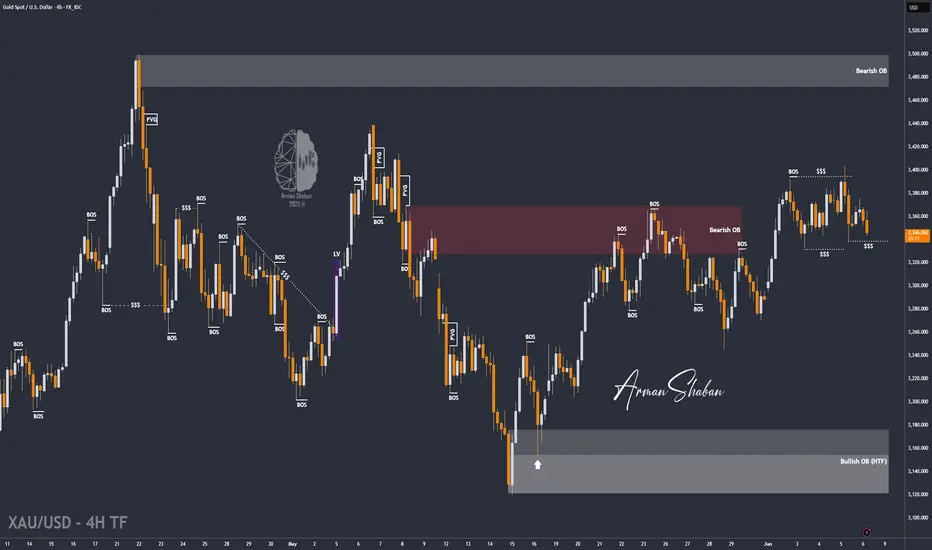
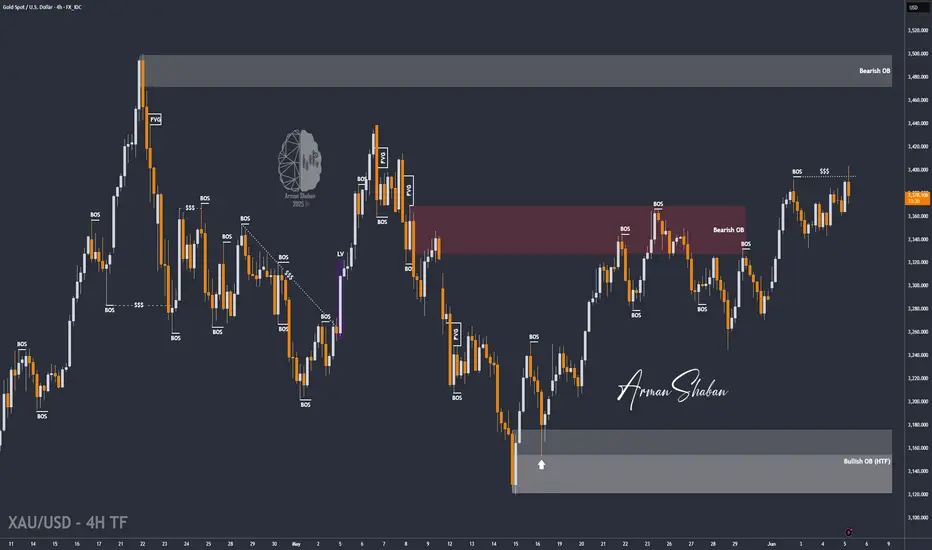
Gold Rejected Below $3370 — Eyes on Lower Demand Zones! (READ)By examining the gold chart on the 4-hour timeframe, we can see that after our previous analysis, the price climbed to $3388, giving us nearly 150 pips of return. However, gold was rejected from that level and failed to hold above $3370, eventually dropping below $3360.
Currently, gold is trading around $3348, and we may likely see further decline toward lower levels. The potential downside targets are $3338, $3332, $3326, and $3317.
Key demand zones to watch are:
→ $3327
→ $3311
→ $3298–$3300
→ $3278
Please support me with your likes and comments to motivate me to share more analysis with you and share your opinion about the possible trend of this chart with me !
Best Regards , Arman Shaban
EURUSD Analysis Today: Technical and Order Flow Analysis !Technical Breakdown:
Rising Wedge Pattern ✅
Price was moving inside a rising channel (blue lines).
This is often a bearish reversal pattern.
Break of Structure 💥
Price broke the lower trendline + support zone — confirming potential downside momentum.
Short Entry Zone 🟪
Purple box marks a premium entry zone (Order Block / Supply Zone) — where sellers are likely positioned.
Stop Loss: 1.14781 🔺 (Above last high)
Target: Key demand zone below (highlighted in grey) 🎯
---
📦 Order Flow Perspective:
Internal structure shows lower highs and lower lows forming.
Expecting price to retest lower blue trendline, then drop to fill imbalance and hit demand zone below.
---
🗓️ Upcoming Events:
Watch out for USD-related news near June 10 & June 14 — it may increase volatility 📊
---
🧠 Summary:
This is a classic bearish continuation setup.
Entry after pullback = higher R:R potential.
Patience and proper risk management are key 🔑
---

EURUSD Set To Grow! BUY!
My dear friends,
My technical analysis for EURUSD is below:
The market is trading on 1.1420 pivot level.
Bias - Bullish
Technical Indicators: Both Super Trend & Pivot HL indicate a highly probable Bullish continuation.
Target - 1.1439
About Used Indicators:
A pivot point is a technical analysis indicator, or calculations, used to determine the overall trend of the market over different time frames.
Disclosure: I am part of Trade Nation's Influencer program and receive a monthly fee for using their TradingView charts in my analysis.
———————————
WISH YOU ALL LUCK
EURUSD: Local Bearish Bias! Short!
My dear friends,
Today we will analyse EURUSD together☺️
The market is at an inflection zone and price has now reached an area around 1.14182 where previous reversals or breakouts have occurred.And a price reaction that we are seeing on multiple timeframes here could signal the next move down so we can enter on confirmation, and target the next key level of 1.14050..Stop-loss is recommended beyond the inflection zone.
❤️Sending you lots of Love and Hugs❤️
EURUSD at Resistance – Pullback Ahead?Hello traders! What’s your take on EURUSD?
EURUSD is currently trading just below a key resistance zone, signaling a potential pullback. A double top pattern may be forming, suggesting the pair could correct before regaining bullish momentum.
We expect a short-term retracement toward the identified support levels before any continuation of the broader uptrend.
Despite this near-term weakness, our long-term outlook remains bullish. This pullback might actually present a better entry opportunity in line with the overall trend.
Do you see it the same way? Drop your thoughts in the comments! 💬
EURUSD failing to close above a key daily highThis is a quick analysis but we are at a key bearish range that may give a double top on the weekly/daily. If this Daily mother candle abides by Candle Range Theory mechanics, we will see it's low taken out.
We'll see 🎯

EURUSD - SellEntered this earlier on the 1min TF
Target will be the first Order Block which is 21:RR.
The reason I am targeting here is the 4H order flow is still bullish. So if we can hit the target I close 50% of the position and let the rest ride and manage accordingly to price.
Lets see how it plays out

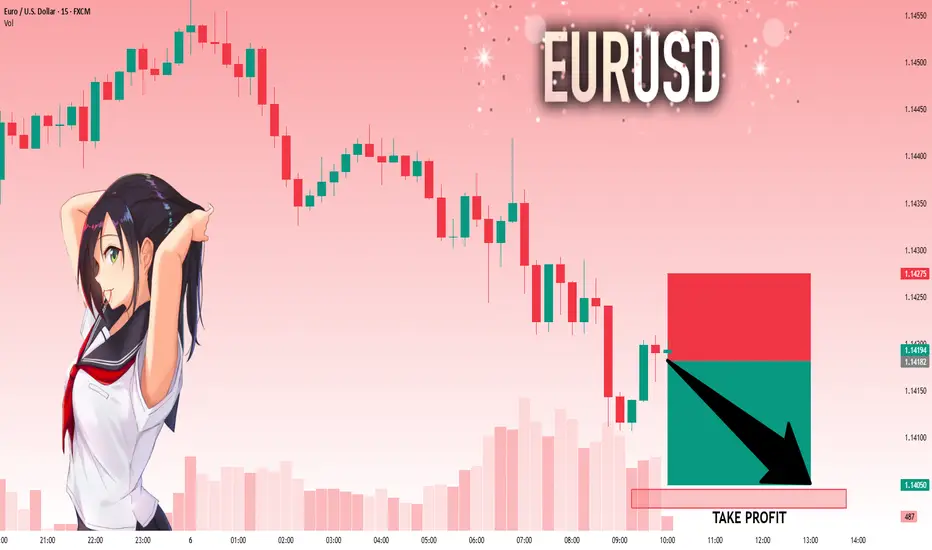
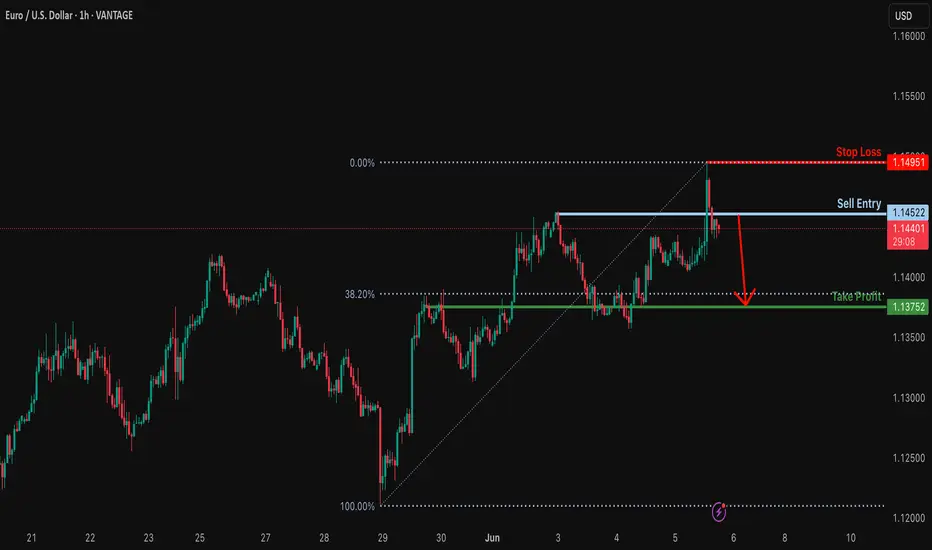
Bearish drop for the Fiber?The price is reacting off the resistance level which is a pullback resistance and could drop from this level to our take profit.
Entry: 1.1452
Why we like it:
There is a pullback resistance level.
Stop loss: 1.1495
Why we like it:
There is a pullback resistance level.
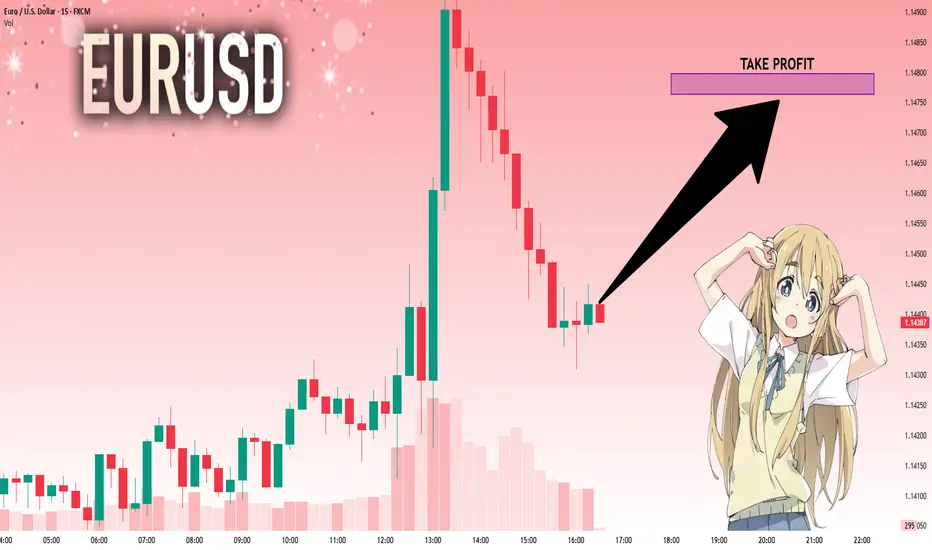
Take profit: 1.1375
Why we like it:
There is an overlap support level that is slightly below the 38.2% Fibonacci retracement.
Enjoying your TradingView experience? Review us!
Please be advised that the information presented on TradingView is provided to Vantage (‘Vantage Global Limited’, ‘we’) by a third-party provider (‘Everest Fortune Group’). Please be reminded that you are solely responsible for the trading decisions on your account. There is a very high degree of risk involved in trading. Any information and/or content is intended entirely for research, educational and informational purposes only and does not constitute investment or consultation advice or investment strategy. The information is not tailored to the investment needs of any specific person and therefore does not involve a consideration of any of the investment objectives, financial situation or needs of any viewer that may receive it. Kindly also note that past performance is not a reliable indicator of future results. Actual results may differ materially from those anticipated in forward-looking or past performance statements. We assume no liability as to the accuracy or completeness of any of the information and/or content provided herein and the Company cannot be held responsible for any omission, mistake nor for any loss or damage including without limitation to any loss of profit which may arise from reliance on any information supplied by Everest Fortune Group.
EURUSD: Will Go Up! Long!
My dear friends,
Today we will analyse EURUSD together☺️
The recent price action suggests a shift in mid-term momentum. A break above the current local range around 1.14403 will confirm the new direction upwards with the target being the next key level of 1.14764 and a reconvened placement of a stop-loss beyond the range.
❤️Sending you lots of Love and Hugs❤️
Gold Hits All Targets with 500+ Pips – Eyes Now on $3420By examining the gold chart on the 4-hour timeframe, we can see that after our previous analysis, the price moved exactly as expected and successfully hit all four targets — $3367, $3380, $3391, and $3400 — reaching as high as $3403 and delivering over 500 pips of return.
After sweeping the liquidity above $3400, the price corrected back to around $3370. Currently, gold is trading around $3380. If the price can hold above the $3370 level, we can expect a continuation of the bullish move toward the $3420 area.
Please support me with your likes and comments to motivate me to share more analysis with you and share your opinion about the possible trend of this chart with me !
Best Regards , Arman Shaban
EURO - Price can drop to $1.1280, breaking support levelHi guys, this is my overview for EURO, feel free to check it and write your feedback in comments👊
A few days ago price broke $1.1375 level and then entered to triangle pattern, where it at once dropped from resistance line.
Price fell to $1.1375 level, where it some time traded between and then continued to decline to $1.1220 level.
When Euro declined to this level, it at once broke this level and fell to support line of a triangle pattern.
Next, price turned around and in a short time rose higher than $1.1220 level, breaking it and continued to grow next.
Euro rose to resistance line and then corrected, after which it made an upward impulse, thereby exiting from triangle.
Now, price traded inside resistance area, near $1.1375 level, and I think EUR can drop to $1.1280
If this post is useful to you, you can support me with like/boost and advice in comments❤️
Disclaimer: As part of ThinkMarkets’ Influencer Program, I am sponsored to share and publish their charts in my analysis.
EURUSD Long Setup Above 1.14544 – Trendline in FocusFX:EURUSD is showing a potential long setup if price breaks above the 1.14544 level . The trade's potential is influenced by an ascending trendline around 1.14710 . If the market hesitates at this level, it may be wise to close the position or move the stop loss to breakeven .

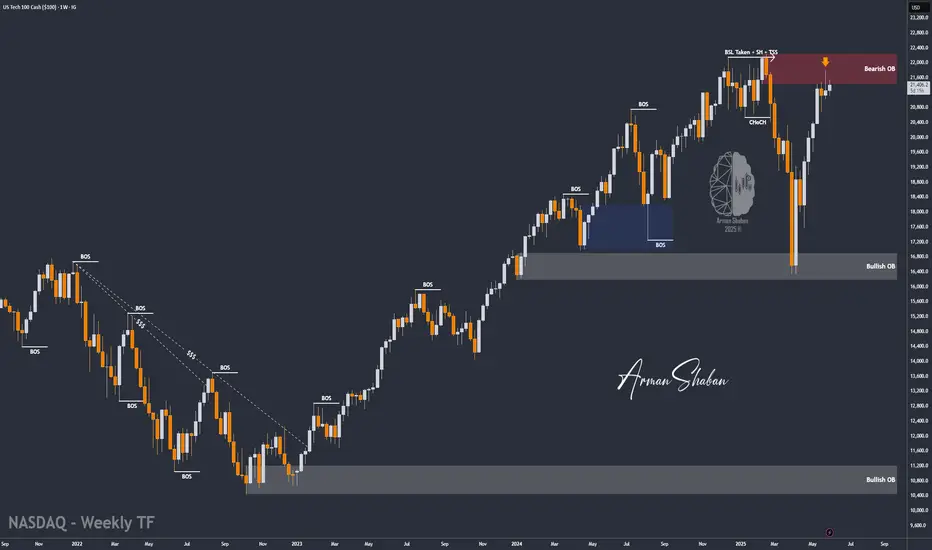
NASDAQ at Weekly Supply Zone – Bearish Breakdown Ahead? (READ)By examining the #Nasdaq chart on the weekly timeframe, we can see that the price is currently trading within the supply zone around 21,400. If it manages to close and stabilize below 21,100, we can expect further downside for this index. The potential bearish targets are 21,000, 20,700, 20,200, and 19,150. The key supply zone ranges from 21,400 to 22,200.
Please support me with your likes and comments to motivate me to share more analysis with you and share your opinion about the possible trend of this chart with me !
Best Regards , Arman Shaban
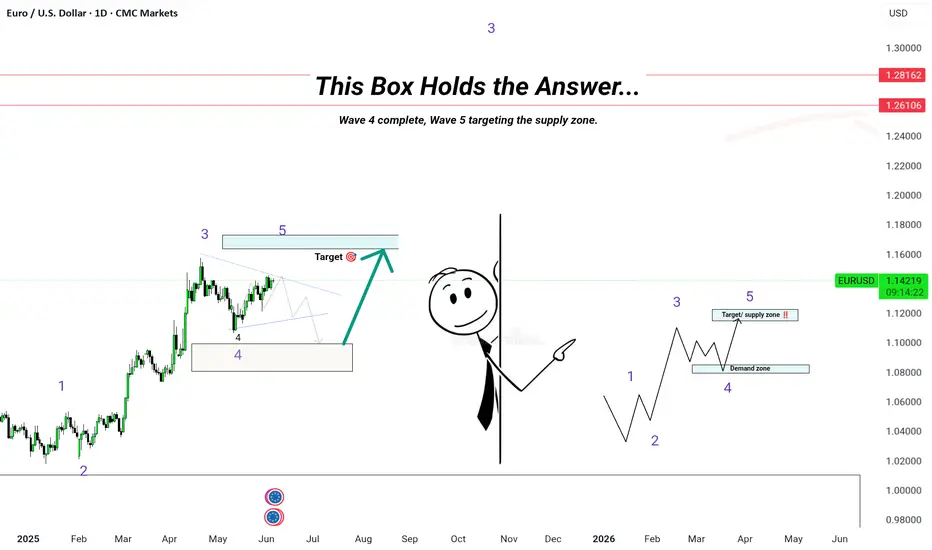
Mr. Wave Says... It’s Time for the Last Push!”[ b] EUR/USD is forming a clean Elliott Wave structure — and guess what?
We’re at Wave 4 consolidation, and Wave 5 is about to explode upward!
🔍 Here's what we're seeing:
✅ Wave 1 to 3 already confirmed with solid impulse
✅ Wave 4 found support near previous breakout zone
🎯 Target: Upper supply zone where Wave 5 is likely to terminate
🔔 This isn’t the time to sleep on the charts. Mr. Wave is literally pointing to the target zone — and we’re not ignoring it. 😉
---
🧠 Pro tip:
Use tight risk management, ride the final push of the motive wave, and watch for reversal signals in the supply zone.
---
📌 #GreenFireForex #ElliottWave #Wave5 #ForexTrading #TechnicalAnalysis #EURUSDSetup #ForexReel #WaveTheory #SupplyZone #ForexSignal #SmartTrading