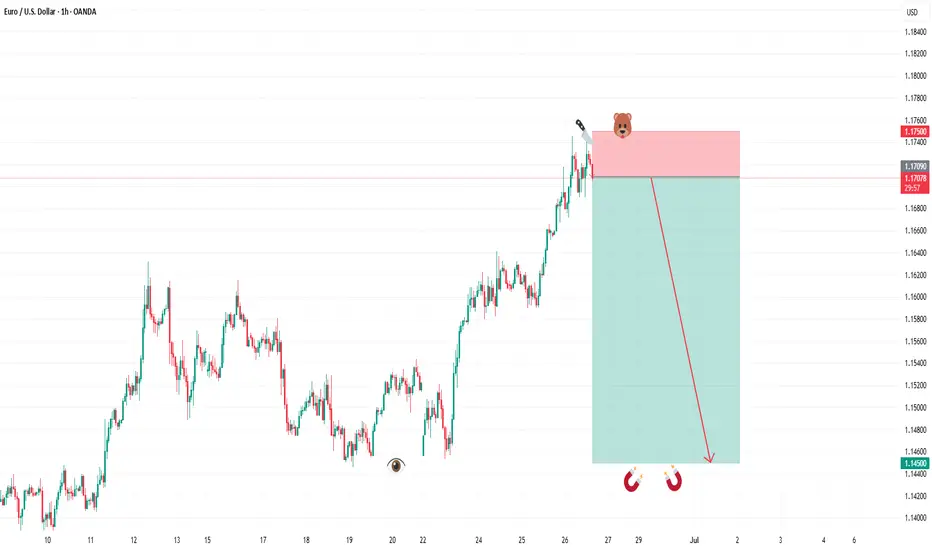
SELL FIBERAfter yesterdays stop out we are at it again, we believe EURUSD bears will step in at current prices. Our sell entry is at 1.17100 our TIGHT stop loss is at 1.17500 and target is as low as 1.14500 . Use proper risk management and always risk what you can afford to loose. Cheers gang
Eurusd-4
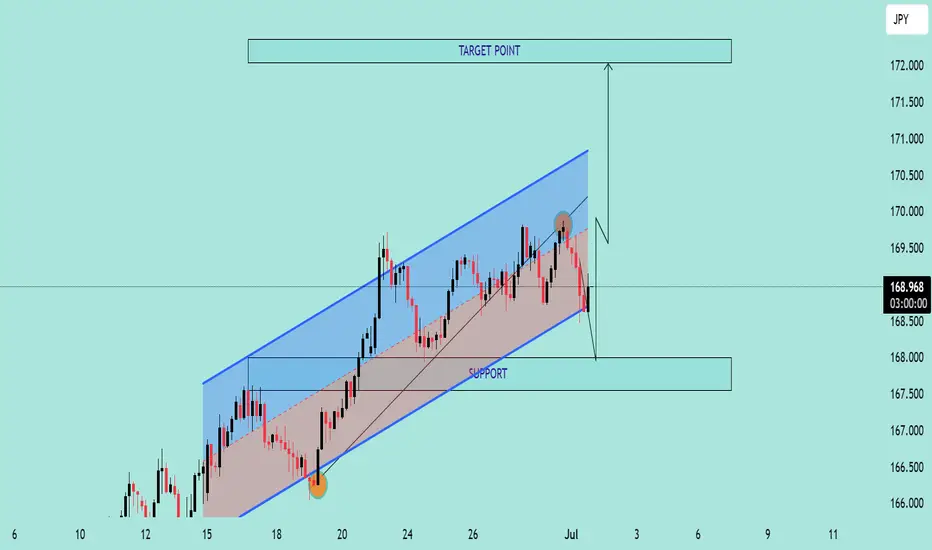
EUR/JPY Potential Bullish ContinuationEUR/JPY Potential Bullish Continuation 📈🔍
📊 Technical Overview:
The EUR/JPY chart presents a bullish channel structure, indicating an overall upward trend. Price action respected the channel boundaries with multiple confirmations before the latest bearish correction.
🔹 Structure Highlights:
🔵 Ascending Channel: Price moved steadily within an upward-sloping channel.
🟠 Support Rebound: A strong bullish candle formed on June 20th after touching the lower boundary — a clear support confirmation.
🔴 Recent Rejection: On July 1st, price tested the upper channel resistance and faced rejection, forming a bearish engulfing candle.
🟫 Support Zone Marked: Around the 167.800 level, this zone has been tested multiple times, indicating a possible demand area.
🔁 Current Scenario:
The pair has broken down from the internal trendline (light brown line) and is heading toward the support zone. A bullish bounce from this area may lead to a rally toward the Target Point at ~172.000 🎯.
📌 Key Levels:
Support Zone: 167.600 – 168.000
Resistance Zone: 170.500 – 172.000
Current Price: 168.994
📈 Outlook:
If support holds and bullish momentum returns, there's potential for a move toward the target area at the top of the channel. However, a break below the support zone could invalidate the bullish scenario and suggest a deeper correction.
🧠 Conclusion:
Wait for bullish confirmation near support before considering long positions. A clean break and retest of the support zone could signal a continuation of the upward trend.
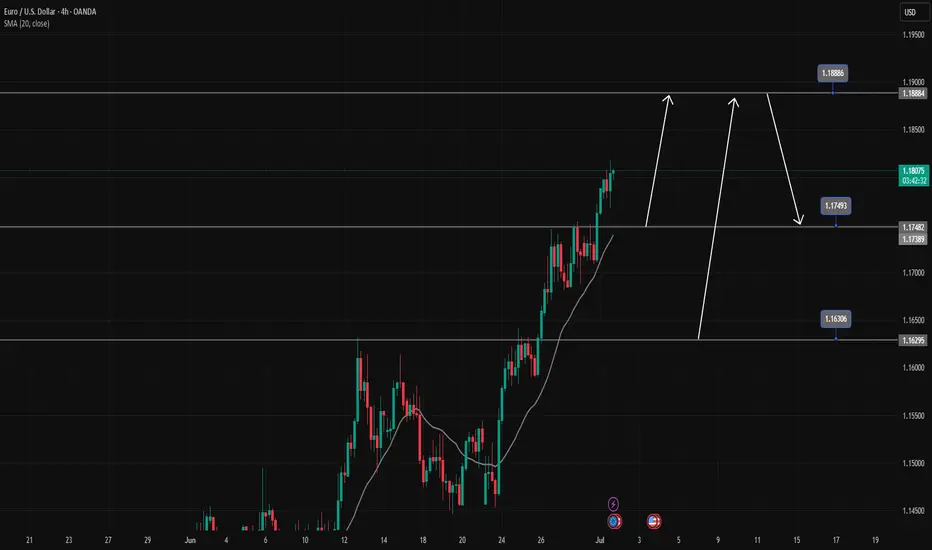
EURUSD is in a strong uptrendEURUSD is in a strong uptrend, Price just broke the resistance zone of 1.175.
All the bullish momentum is heading towards the resistance zone of 1.188.
If there is a close of the h4 candle below the resistance zone of 1.175, there will likely be a Pullback to 1.163 to find more buying momentum towards the target at the resistance zone of 1.188
📈 Key Levels
Support: 1.175-1.163
Resistance: 1.188
📊 Recommended Trade Setups
BUY EURUSD 1.175-1.173 Stoploss 1.170
BUY EURUSD 1.163-1.161 Stoploss 1.158
SELL EURUSD 1.188-1.190 Stoploss 1.1930
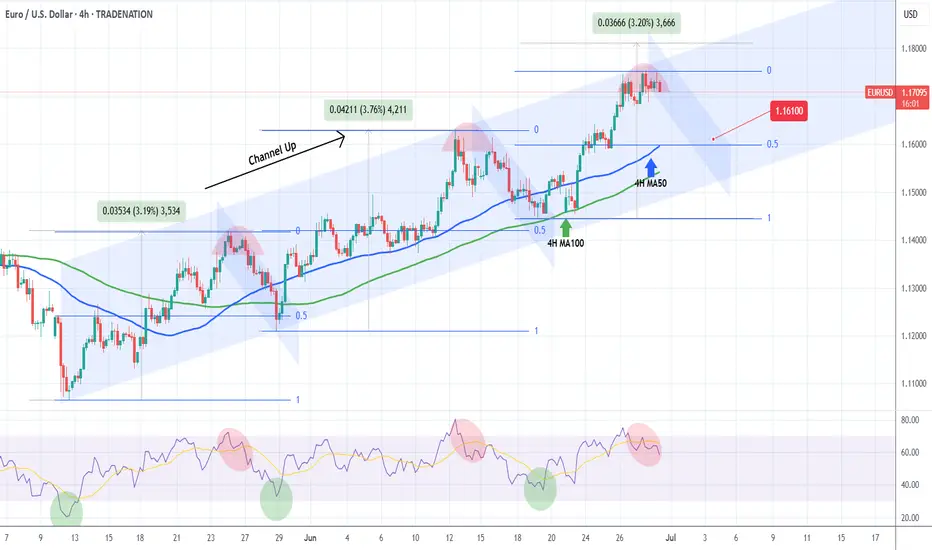
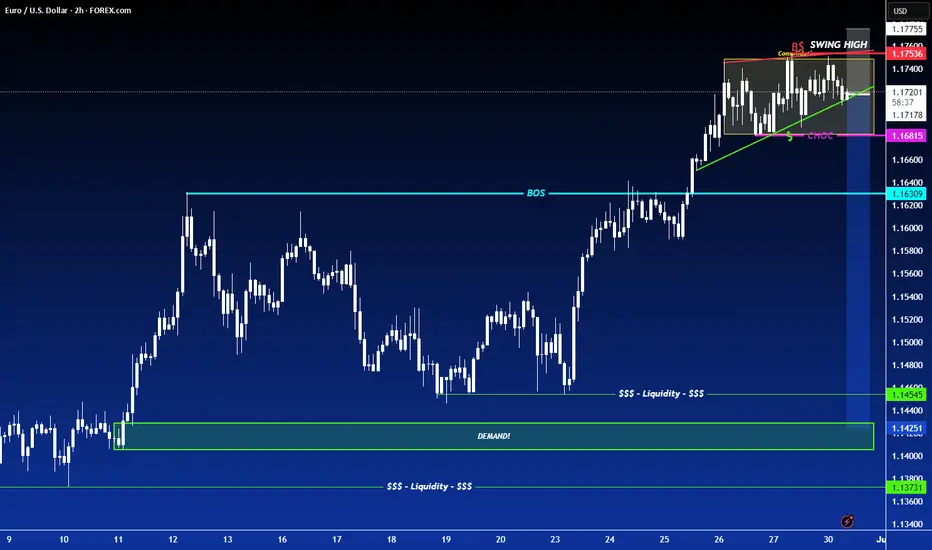
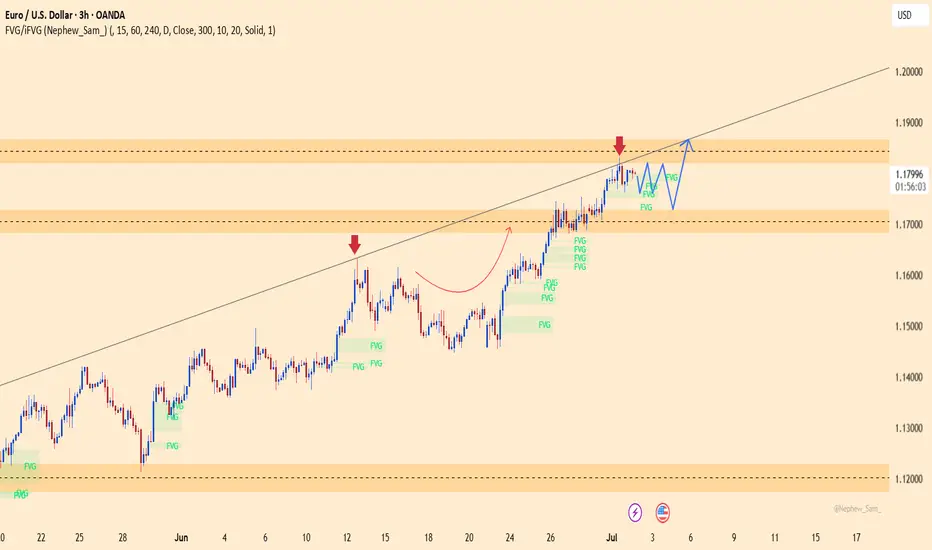
EURUSD Sell signal at the top of the Channel Up.Last time we analyzed the EURUSD pair (June 23, see chart below) we gave a strong buy signals at the bottom of the 1.5-month Channel Up:
The price is almost near our Target but since it's been consolidating for so many 4H candles on the pattern's top, it is better to take the good profit and turn bearish.
The 0.5 Fibonacci retracement level has been a solid target for the previous two Bearish Legs, but since the last one bottomed just above it on the 4H MA100 (green trend-line), we will place the Target a little higher this time also at 1.16100.
-------------------------------------------------------------------------------
** Please LIKE 👍, FOLLOW ✅, SHARE 🙌 and COMMENT ✍ if you enjoy this idea! Also share your ideas and charts in the comments section below! This is best way to keep it relevant, support us, keep the content here free and allow the idea to reach as many people as possible. **
-------------------------------------------------------------------------------
Disclosure: I am part of Trade Nation's Influencer program and receive a monthly fee for using their TradingView charts in my analysis.
💸💸💸💸💸💸
👇 👇 👇 👇 👇 👇
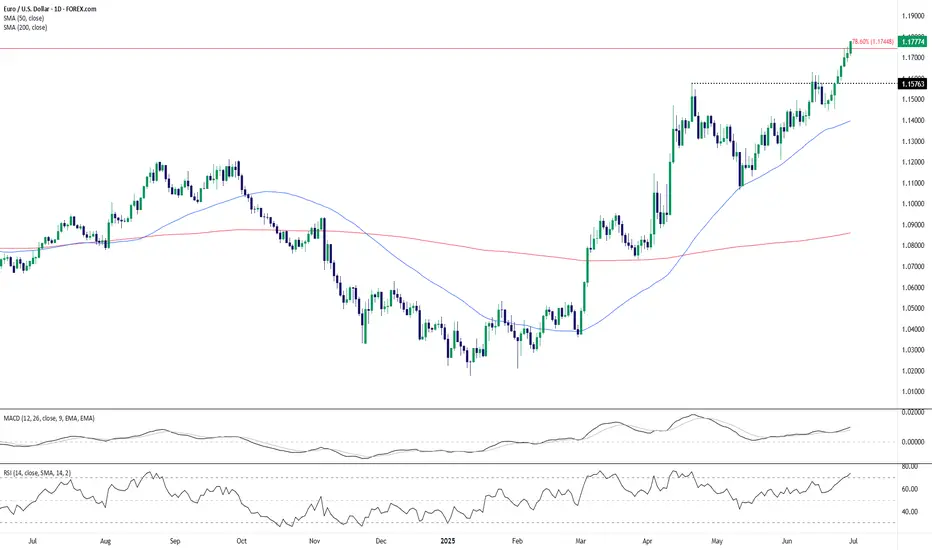
EUR/USD Breakout Eyes 1.18 as Bullish Momentum BuildsEUR/USD has punched through the 78.6% Fibonacci retracement level (1.1744) of the July 2023–October 2023 decline, signaling strong bullish continuation. The breakout above the recent swing high near 1.1576 confirms the uptrend is gaining traction, supported by rising moving averages.
The 50-day SMA has crossed well above the 200-day SMA, maintaining a strong golden cross structure, reinforcing the bullish bias. Momentum indicators support the advance, with the RSI entering overbought territory at 73.79, and the MACD maintaining a positive spread above the signal line — a classic sign of trend strength rather than imminent reversal.
However, the overbought RSI suggests the pair could face some short-term consolidation or a shallow pullback before targeting the psychological 1.18 handle. Bulls would likely view any dip toward the breakout level (1.1576) as a potential buying opportunity.
As long as EUR/USD holds above that support, the path of least resistance remains to the upside, potentially paving the way for a full retracement toward the 1.19–1.20 zone seen last year.
-MW
EURUSD: focus on jobs dataThe major macro data for this week, the PCE indicator, was posted on Friday. The Personal Consumption Expenditure index, Feds favorite inflation gauge, increased by 0,1% in May, bringing the index to the level of 2,3% on a yearly basis. Both figures were in line with market expectations. The core PCE was a bit higher than anticipated, at the level of 0,2% for the month and 2,7% for the year. A bit surprising figures came from Personal Income in May, which dropped by -0,4%, while the Personal Spending was down by -0,1% in May. Analysts are noting that implemented trade tariffs are slowly beginning to reflect in the personal spending of the US citizens. Also, this sort of potential development was noted by the Fed during the last two FOMC meetings.
The rest of posted macro data for the US included the Existing Home Sales in May reached 4,03M, which was an increase of 0,8% on a monthly basis. This was significantly above the market estimate of -1,3%. The Durable Goods Orders in May were higher by 16,4%, surpassing the market estimate of 8,5%. The GDP Growth Rate final for Q1was standing in a negative territory of -0,5% for the quarter, and was higher from market expectation of -0,2%. The end of the week brought University of Michigan Consumer Sentiment figures final for June, which was standing at 60,7 and was in line with estimates. The Inflation Expectations were a bit higher from the previous estimate, ending the June with expected 5% inflation, while the market was expecting to see 5,1%.
The HCOB Manufacturing PMI flash for June in Germany was standing at the level of 49, while the same index for the Euro Zone reached 49,4. Both indicators were in line with market expectations. The Ifo Business Climate in Germany in June reached 88,4, in line with market estimates. The GfK Consumer Confidence in July was at the level of -20,3, a bit higher from estimated -19,3.
The eurusd was traded with a bullish sentiment during the previous week. The currency pair started the week around the level of 1,1460 and continued toward the upside for the rest of the week. The highest weekly level at 1,1741 was reached in Friday's trading session. The RSI reached the clear overbought market side as of the end of the week, at the level of 71. The MA50 continues to diverge from MA200, without an indication that the potential cross is near.
The market favored the euro during the last two weeks. It comes as a result of insecurity when it comes to potential negative impact of implemented trade tariffs, which are slowly revealing in the US economy. The week ahead brings more jobs data, including JOLTs, NFP and unemployment rate, which will shape the investors sentiment. Some increased volatility might be ahead. The resistance level at 1,17 has been clearly tested during the previous week, and it will mark the beginning of the week ahead. The RSI is pointing to a higher probability of a short term reversal in the coming period, which might occur in the week ahead, impacted, most probably, by jobs data. In case of a reversal, the level of 1,1620 might easily be the next target. On the opposite side, there is a lower probability of a further move above the 1,17 level, however, the market might spend some time here, before a decision to make further move.
Important news to watch during the week ahead are:
EUR: Retail Sales in May in Germany, Inflation Rate preliminary in June for both Germany and the Euro Zone, Unemployment Rate in June in Germany,
USD: ISM Manufacturing PMI in June, JOLTs Job Openings in May, Non-farm Payrolls in June, Unemployment rate in June, Average Hourly Earnings and Spending, ISM Services PMI in June
German CPI flatlines, eurozone CPI nextThe euro is up for an eighth consecutive day and has gained 2.4% during that time. In the North American session, EUR/USD is trading at 1.1738, up 0.36% on the day.
German inflation data on Monday pointed to a weakening German economy. The CPI report indicated that the deflationary process slowly continues. The inflation rate for June came in at 0% m/m, down from 0.1% in May and below the consensus of 0.2%. Annually, inflation dropped to 2.0% from 2.1% and below the consensus of 2.1%. The eurozone releases its CPI report on Tuesday.
Inflation has been dropping in small increments and has now fallen to the European Central Bank's inflation target of 2%. The ECB cut the deposit rate to 2.0% earlier in June and meets next in July. Although eurozone inflation is largely contained, there are concerns about the impact that US tariffs and counter-tariffs by US trading partners could have on the inflation picture. The ECB is likely to maintain rates in July but could lower rates in September if disinflation continues.
The US continues to show signs that the economy is slowing down. Last week, GDP was revised downwards to -0.5% in the first quarter. This was followed by US consumer spending for May (PCE) which posted a 0.1% decline, following a 0.2% gain in April and shy of the consensus of 0.1%. This was the first contraction since January. If economic data continues to head lower, pressure will increase on the Federal Reserve to lower interest rates, which isn't expected before the September meeting.
EUR/USD is testing resistance at 1.1755. Above, there is resistance at 1.1791
1.1718 and 1.1682 are the next support levels
EURUSDHello, I hope you have a good day ❤
Please don't forget to support us so that our activities can continue!🚀
The trend of the above times is completely upward and this move is not far from expected.
But since it is the first week of the new month, be sure to observe capital management.
Be profitable💲💎
EURUSD Under Pressure! SELL!
My dear subscribers,
My technical analysis for EURUSD is below:
The price is coiling around a solid key level - 1.1726
Bias - Bearish
Technical Indicators: Pivot Points High anticipates a potential price reversal.
Super trend shows a clear sell, giving a perfect indicators' convergence.
Goal - 1.1612
My Stop Loss - 1.1783
About Used Indicators:
By the very nature of the supertrend indicator, it offers firm support and resistance levels for traders to enter and exit trades. Additionally, it also provides signals for setting stop losses
Disclosure: I am part of Trade Nation's Influencer program and receive a monthly fee for using their TradingView charts in my analysis.
———————————
WISH YOU ALL LUCK
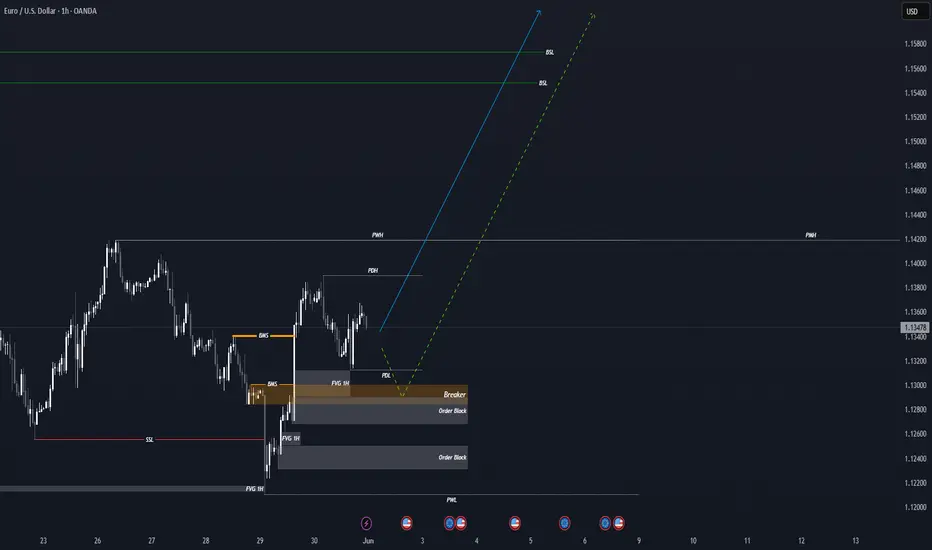
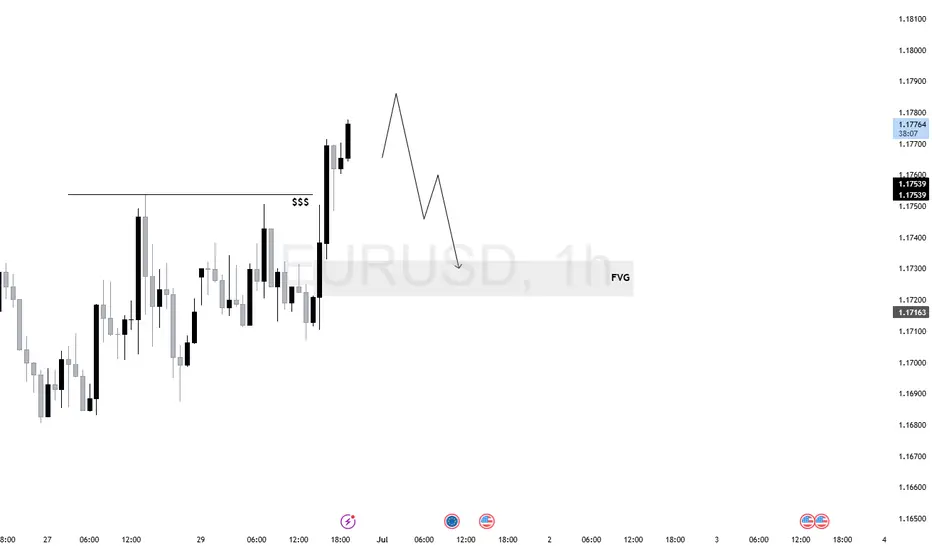
$EU (EURUSD) 1H AnalysisEURUSD swept short-term sell-side liquidity and printed a strong displacement above the relative equal highs.
Price is now in premium territory and likely hunting liquidity before rebalancing.
Bias remains bearish if price fails to form higher-timeframe continuation. Ideal setup would be a short from signs of rejection toward 1.17163 FVG zone.
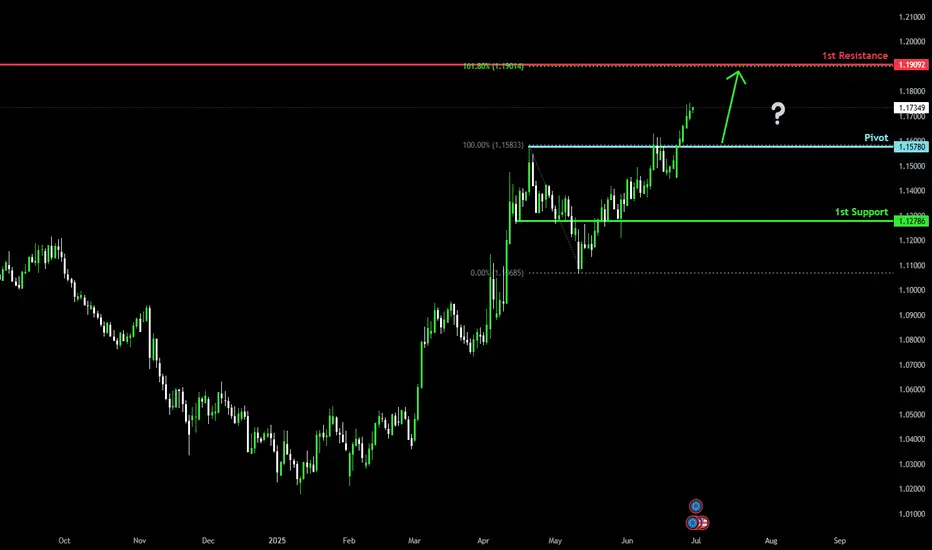
Bullish rise?The Fiber (EUR/USD) has reacted off the pivot and could rise to the 1st resistance.
Pivot: 1.1578
1st Support: 1.1278
1st Resistance: 1.1909
Risk Warning:
Trading Forex and CFDs carries a high level of risk to your capital and you should only trade with money you can afford to lose. Trading Forex and CFDs may not be suitable for all investors, so please ensure that you fully understand the risks involved and seek independent advice if necessary.
Disclaimer:
The above opinions given constitute general market commentary, and do not constitute the opinion or advice of IC Markets or any form of personal or investment advice.
Any opinions, news, research, analyses, prices, other information, or links to third-party sites contained on this website are provided on an "as-is" basis, are intended only to be informative, is not an advice nor a recommendation, nor research, or a record of our trading prices, or an offer of, or solicitation for a transaction in any financial instrument and thus should not be treated as such. The information provided does not involve any specific investment objectives, financial situation and needs of any specific person who may receive it. Please be aware, that past performance is not a reliable indicator of future performance and/or results. Past Performance or Forward-looking scenarios based upon the reasonable beliefs of the third-party provider are not a guarantee of future performance. Actual results may differ materially from those anticipated in forward-looking or past performance statements. IC Markets makes no representation or warranty and assumes no liability as to the accuracy or completeness of the information provided, nor any loss arising from any investment based on a recommendation, forecast or any information supplied by any third-party.
SHORT ON EUR/USDEUR/USD has a rising wedge within a consolidation zone.
The dollar looks like it will rise which will cause this pair to fall.
I will be selling EU looking to catch 150-300 pips this week.
EURUSD BUY SETUP 1:5HELLO HOW ARE YOU ?
What i think about market ?
I Think the market will take liquidity
and will reach imbalance , then touch the supply area
and last will go up boooom

EURUSD: Will Go Down! Short!
My dear friends,
Today we will analyse EURUSD together☺️
The recent price action suggests a shift in mid-term momentum. A break below the current local range around 1.17225 will confirm the new direction downwards with the target being the next key level of 1.17114.and a reconvened placement of a stop-loss beyond the range.
❤️Sending you lots of Love and Hugs❤️
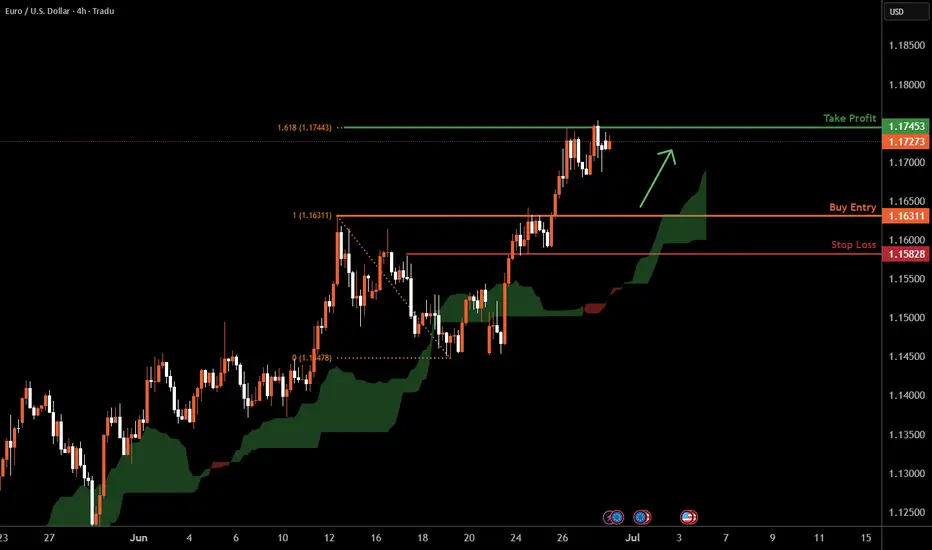
EURUSD H4 I Bullish BounceBased on the H4 chart analysis, the price is falling toward our buy entry level at 1.1631, a pullback support.
Our take profit is set at 1.1745, a swing high resistance that aligns with the 161.8% Fib extension.
The stop loss is placed at 1.1582, an overlap support.
High Risk Investment Warning
Trading Forex/CFDs on margin carries a high level of risk and may not be suitable for all investors. Leverage can work against you.
Stratos Markets Limited (tradu.com ):
CFDs are complex instruments and come with a high risk of losing money rapidly due to leverage. 63% of retail investor accounts lose money when trading CFDs with this provider. You should consider whether you understand how CFDs work and whether you can afford to take the high risk of losing your money.
Stratos Europe Ltd (tradu.com ):
CFDs are complex instruments and come with a high risk of losing money rapidly due to leverage. 63% of retail investor accounts lose money when trading CFDs with this provider. You should consider whether you understand how CFDs work and whether you can afford to take the high risk of losing your money.
Stratos Global LLC (tradu.com ):
Losses can exceed deposits.
Please be advised that the information presented on TradingView is provided to Tradu (‘Company’, ‘we’) by a third-party provider (‘TFA Global Pte Ltd’). Please be reminded that you are solely responsible for the trading decisions on your account. There is a very high degree of risk involved in trading. Any information and/or content is intended entirely for research, educational and informational purposes only and does not constitute investment or consultation advice or investment strategy. The information is not tailored to the investment needs of any specific person and therefore does not involve a consideration of any of the investment objectives, financial situation or needs of any viewer that may receive it. Kindly also note that past performance is not a reliable indicator of future results. Actual results may differ materially from those anticipated in forward-looking or past performance statements. We assume no liability as to the accuracy or completeness of any of the information and/or content provided herein and the Company cannot be held responsible for any omission, mistake nor for any loss or damage including without limitation to any loss of profit which may arise from reliance on any information supplied by TFA Global Pte Ltd.
The speaker(s) is neither an employee, agent nor representative of Tradu and is therefore acting independently. The opinions given are their own, constitute general market commentary, and do not constitute the opinion or advice of Tradu or any form of personal or investment advice. Tradu neither endorses nor guarantees offerings of third-party speakers, nor is Tradu responsible for the content, veracity or opinions of third-party speakers, presenters or participants.
EURUSD SELL TRADEOpportunity to sell on EURUSD
Entry: 1.18000
Stop loss: 1.18200
Take profit 📈 1.17400
Comment your opinion
For fund management. Contact me on X @shajudeakinoba1
EURUSD: Building Pressure for a Breakout?Hello everyone! What do you think about EURUSD?
Today, the pair is trading around 1.179 and continues its bullish trend as the US dollar tumbles in global markets.
While EURUSD is currently confined within a wedge pattern, history shows this formation often favors bullish continuation. Personally, I’m watching closely — either for a pullback to the lower boundary or a confirmed breakout to trigger a stronger rally.
What about you? What’s your outlook on EURUSD?

EURUSD: Uptrend Targeting 1.18600EURUSD is maintaining a solid bullish structure after breaking above the 1.17300 zone. The pair is currently consolidating around 1.1800 and may see a minor pullback before pushing toward the 1.18600 target.
The main support comes from a weaker USD following Fed Chair Powell’s “patient” remarks, along with strong PMI data from the EU. EURUSD has now posted 10 consecutive days of gains, signaling strong upward momentum.
As long as price holds above the FVG zone near 1.1780, the bullish trend remains intact, with 1.18600 as the next potential upside target.
EUR/USD Keeps Climbing – Dollar on the Back FootEUR/USD is still pushing higher today, trading around 1.171 and showing no signs of slowing down. The pair’s strength is backed by both technical momentum and the current market backdrop.
What’s fueling the move? Simple: the US dollar is under pressure again. Fresh concerns about the Federal Reserve’s independence — especially with talks around replacing Powell — are shaking investor confidence. That’s giving the euro the upper hand and helping this pair hover near its highest level in four years.
Looks like the bulls aren’t done yet. You riding this trend?

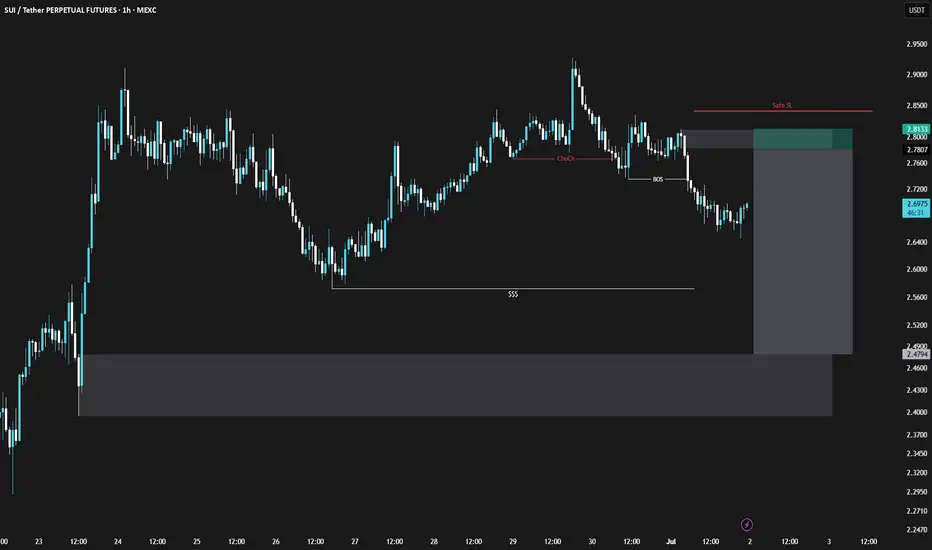
SUI/USDT Short Setup (2025-07-25)SUI/USDT Short setup for day traders.
Please enter with confirmation in 5M time frame.
⚠️ This Analysis will be updated ...
👤 Sadegh Ahmadi: GPTradersHub
📅 2025.Jul.2
⚠️(DYOR)
❤️ If you apperciate my work , Please like and comment , It Keeps me motivated to do better
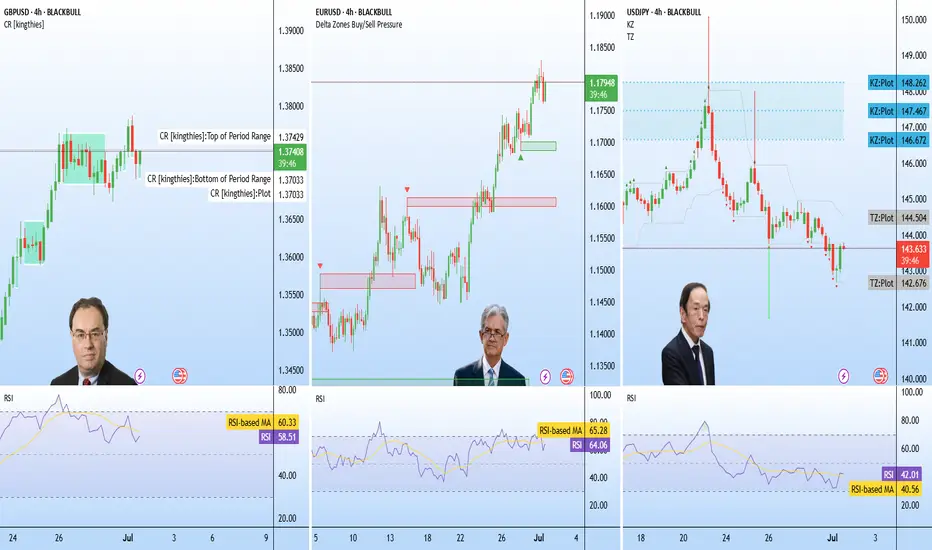
Sintra Signals: Central Banks Stay Cautious The ECB Forum in Sintra brought together the heads of the world’s most influential central banks—Lagarde (ECB), Powell (Fed), Bailey (BOE), Ueda (BOJ), and Rhee (BOK).
Across the board, central banks are remaining cautious and data-driven, with no firm commitments on timing for rate changes.
Fed Chair Powell said the U.S. economy is strong, with inflation manageable despite expected summer upticks. He noted tariffs have delayed potential rate cuts and confirmed the Fed is proceeding meeting by meeting.
BOE’s Bailey highlighted signs of softening in the UK economy and said policy remains restrictive but will ease over time. He sees the path of rates continuing downward.
BOJ’s Ueda noted headline inflation is above 2%. Any hikes will depend on underlying core inflation which remains below target.
Fundamental Market Analysis for July 1, 2025 EURUSDEvent to pay attention to today:
01.07 16:30 EET. USD - Federal Reserve Chairman Jerome Powell Speaks
01.07 16:30 EET. EUR - ECB President Christine Lagarde Speaks
01.07 17:00 EET. USD - ISM Manufacturing PMI
EUR/USD is trading in negative territory near 1.1790 in the early European session on Tuesday. The US dollar (USD) is weakening against the euro (EUR) amid growing budget concerns and uncertainty surrounding trade deals.
Four people familiar with the negotiations said US President Donald Trump's administration is seeking to phase in deals with the most involved countries as they rush to reach an agreement by the July 9 deadline. Uncertainty over trade agreements continued to weigh on sentiment and sell the US dollar.
Investors are concerned about the US Senate's attempts to pass Trump's tax and spending cuts bill, which faces intra-party disagreement over a projected $3.3 trillion increase in the national debt. Fiscal concerns have dampened optimism and contributed to the decline in the US dollar. This, in turn, serves as a tailwind for the major pair.
German inflation, as measured by the Harmonized Index of Consumer Prices (HICP), eased to 2.0% y/y in June from 2.1% in the previous reading. The figure was below expectations of 2.2%.
On a month-on-month basis, HICP rose 0.1% in June vs. 0.2% previously, below the market consensus forecast of 0.3%. Softer-than-expected German inflation data may limit near-term growth.
Trade recommendation: BUY 1.1795, SL 1.1725, TP 1.1880
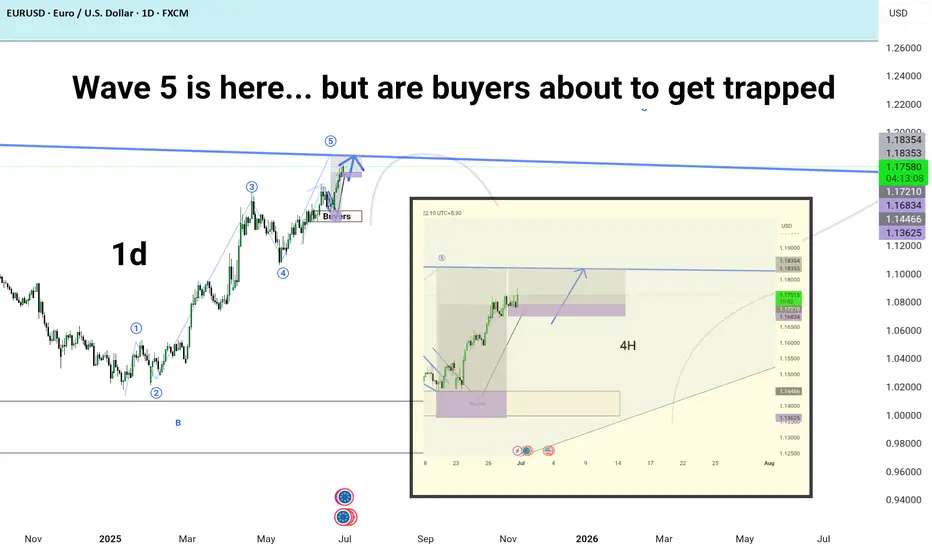
Wave 5 is here... but are buyers about to get trapped1D Timeframe (Main Chart)
✅ Elliott Wave Count:
Wave 1–2–3–4–5 structure is clearly marked.
Wave 5 seems to be completing near the upper trendline, aligning with potential C wave of a larger correction.
🔺 Key Zones:
Buyer zone highlighted under Wave 4 – indicating strong demand before Wave 5 push.
Resistance from the descending trendline just above Wave 5 – potential reversal/sell area.
Price region near 1.1757–1.1835 marked as a potential exhaustion zone.
---
🕒 4H Timeframe (Inset Chart)
📈 Current Price:
Trading around 1.1755, approaching the resistance cluster (1.1757–1.1835).
🔻 Potential Scenarios:
1. Immediate Sell-Off:
If Wave 5 has completed, expect a retracement back to previous demand zones (around 1.1683, 1.1446, or even 1.1362).
2. Final Push Up:
If minor Wave 5 isn't finished yet, price could test the 1.1833–1.1853 area before reversing.