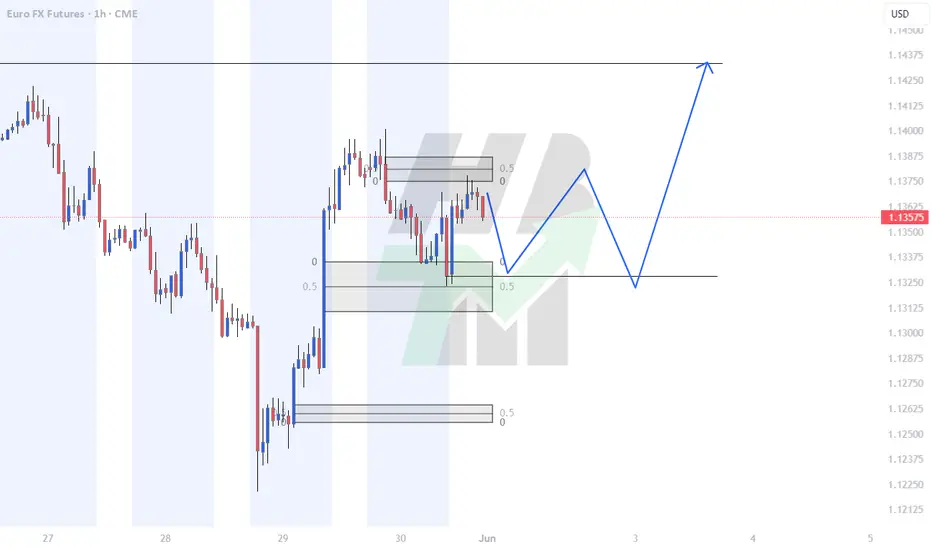
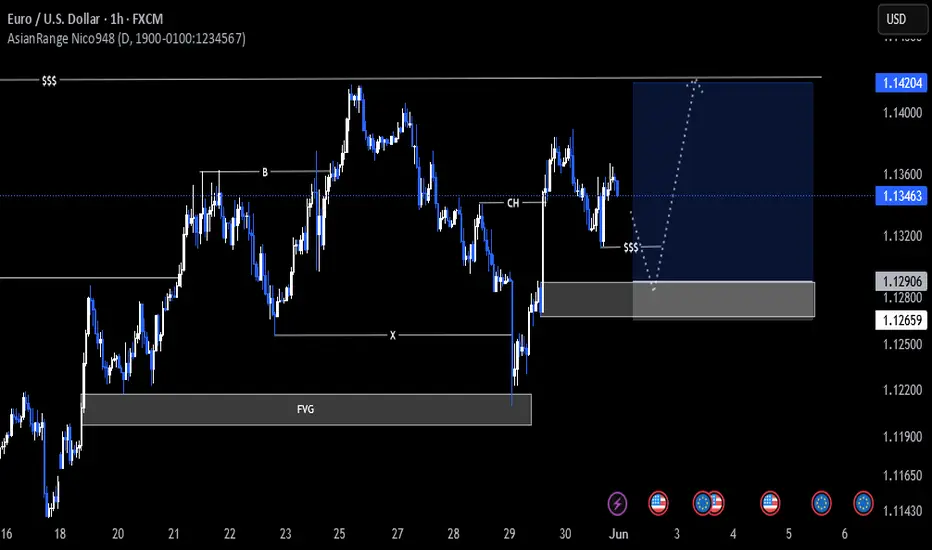
6E Weekly Trajections I've marked out the FVG's on the 15m TF. This is my idea on where the price will be going over the next week. Make sure we watch for tariff news since a lot is going on with the courts.
Eurusd-4
How to Secure Prop Firm Funding: Proven Strategies to Pass1️⃣ How to Secure Prop Firm Funding: Proven Strategies to Pass Challenges 📈
Introduction ✨
Securing prop firm funding opens the door to trading substantial capital and achieving financial freedom. However, passing these evaluations requires meticulous strategy, disciplined execution, and smart risk management. This article provides actionable strategies, optimized trading setups, and insights on leveraging AI to ensure you successfully navigate and pass your prop firm challenges.
Understanding Prop Firm Evaluations 📊🔍
Prop firm challenges typically include specific trading objectives:
💰 Profit targets (8–10% within 30 days)
⛔ Daily loss limits (usually 5%)
📉 Maximum drawdown limits (typically 10%)
💡 Tip: Print the rules and display them at your workspace to avoid rule breaches.
Focus on One High-Probability Strategy 📌🎯
Consistently profitable traders use one rigorously tested strategy. For example, a popular setup:
🔄 Liquidity Sweep: Wait for price to clear stops above recent highs or lows.
⚡ Market Structure Break (BOS): Enter after price breaks and confirms a new trend.
📥 Entry: Order block (OB) or Fair Value Gap (FVG).
Example Trade:
🔗 Pair: EUR/USD
🔽 Entry: OB after sweep at 1.0800
🛑 Stop Loss (SL): 1.0820
🎯 Take Profit (TP): 1.0740
📊 Risk-to-Reward Ratio (RRR): 3:1
Start Small, Think Big 🧠🌱
Initially, risk only 0.5% per trade to maintain psychological comfort and buffer against drawdowns. Increase risk gradually once you have a profit cushion.
Leverage AI Insights 🤖📊
Modern traders enhance decision-making using AI-driven tools:
🟢 AI indicators for real-time liquidity detection
🔵 Predictive analytics for entry confirmations
Efficient Risk Management 🛡️⚖️
Set daily and weekly risk limits. For instance:
⏳ Maximum daily risk: 1%
📅 Weekly drawdown cap: 3%
Practical Example:
💵 If trading a $100,000 account, never risk more than $1,000 in a single day.
Journaling for Improvement 📒📝
Record every trade’s rationale, execution details, and outcome. This fosters accountability and improvement.
Conclusion ✅
Securing prop funding isn't about luck but disciplined, strategic execution. Optimize your trading, leverage technology, and strictly manage risk to ensure long-term success. 🏆
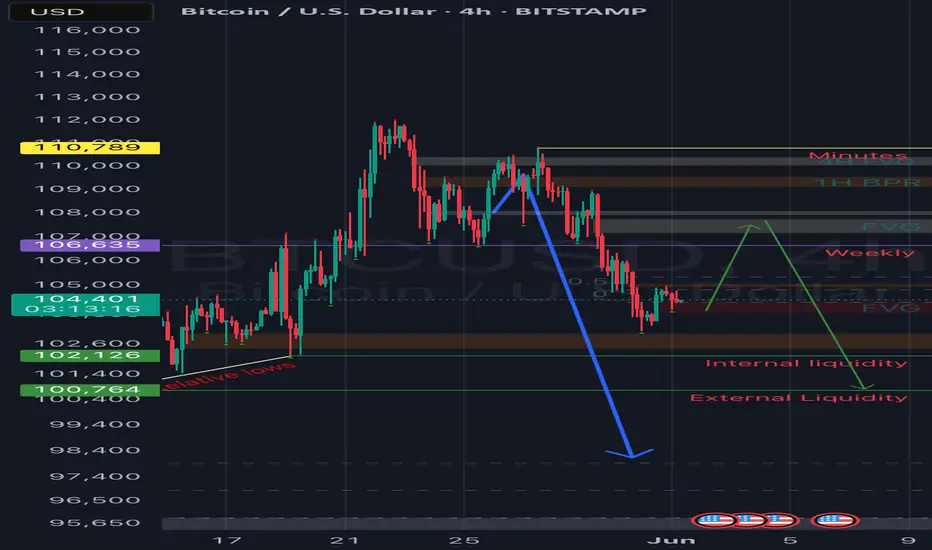
Final BTCUSD update..Good day traders, here is my final update on BTCUSD and I like how price has been respecting our PD arrays. Keep in mind traders price moving in waves and what again😂😂🏃🏾♂️, point is today is the last trading day for the week and my thoughts is that we can expect BTCUSD to start going higher today and tomorrow maybe till Tuesday …sorry I’m being too sure but if you focus on time and price you start to KNOW(ledge) things or maybe I should say secrets?!🤨🤔
I always expect price to manipulate higher if my bias is shorts, ICT’s power of 3 works wonders when it come to this thought process.
Watch how price reacts to the FVG where price is trading now, it’s not a signal just watch out price moves always from it for the rest of today.
We only going high to shoot lower…keep that in mind!!🤯
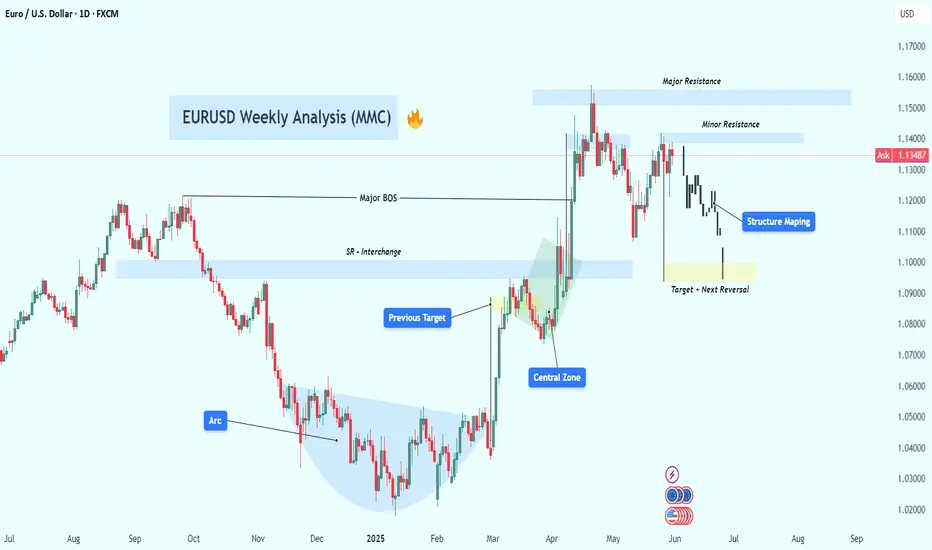
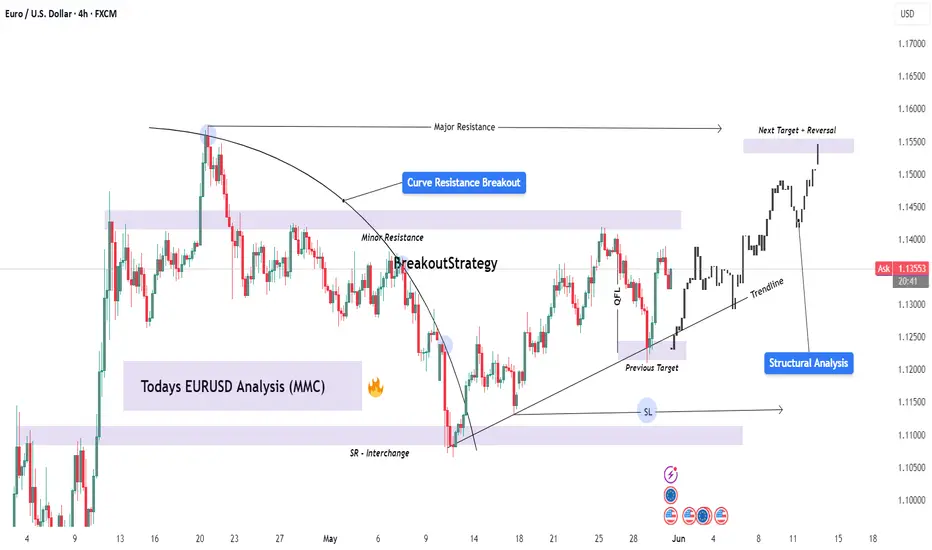
EURUSD Weekly Analysis (MMC) – Bearish Path to Target Zone📈 Market Narrative – Understanding EURUSD's Path with MMC
The EURUSD pair is currently navigating a critical phase in its macro price structure, aligning closely with the Mind Market Concept (MMC) methodology — a trading framework rooted in institutional price behavior, psychological arcs, and structured market mapping.
This chart reveals a story of accumulation, expansion, manipulation, and rebalancing — classic smart money behavior playing out on the higher timeframe. The current move is not just price action — it's a strategic delivery of price toward imbalance, guided by volume vacuums, liquidity zones, and engineered traps.
🧩 Phase-by-Phase Technical Analysis
🔷 1. Arc Accumulation Zone – The Beginning of Institutional Positioning
In the latter half of 2024, EURUSD entered a rounded arc formation, which marks a textbook accumulation phase.
This "bowl-like" curve represents gradual absorption of sell-side liquidity by institutions.
The lows became progressively higher, indicating demand stepping in while supply weakened.
Volume during this time was suppressed — another smart money tactic to accumulate without causing price spikes.
📌 Why This Matters: Arcs often precede explosive breakouts, particularly when aligned with time-based liquidity cycles (quarterly/yearly rebalancing). This zone gave birth to the breakout that followed.
🔷 2. The Central Zone – Consolidation Before Expansion
Once the arc base was complete, price broke out impulsively, then pulled back into what is labeled the Central Zone.
This zone acts as a mid-range liquidity pocket — where orders are stacked and reaccumulation occurs.
It also became the launchpad for the final markup wave that tapped the previous target around 1.1250.
🔍 This move was the realignment phase, where smart money took price above key highs to:
Hit their internal targets.
Trap breakout traders.
Induce euphoria before distribution.
🔷 3. Major BOS – Break of Macro Structure
The breakout through 1.1150–1.1200 confirmed a Major Break of Structure (BOS).
This BOS acted as a signal for:
Trend reversal confirmation for many retail traders.
A "green light" to buy — which was anticipated and exploited by institutions.
But here’s the twist:
Price rejected the SR Interchange Zone (support turned resistance), signaling that the breakout was engineered to trap liquidity.
🔷 4. Distribution & Manipulation – The Trap Layer
The chart clearly shows two critical supply areas:
Minor Resistance (around 1.1400s)
Major Resistance (around 1.1550–1.1600s)
Price briefly approached these zones but failed to hold, forming a complex distribution range.
This is where:
Smart money distributed their long positions.
Retail buyers got trapped.
Volume increased during sell-side preparation.
📌 The rejection from these zones sent price into a clean markdown, forming lower highs and confirming the bearish structure mapping.
🔷 5. Structural Mapping – Downtrend Control
Price action is now clearly in a bearish delivery phase, as shown by:
Lower highs & lower lows
Repeated rejections from minor resistance
Large red candles with little retracement (showing momentum)
This phase is often misunderstood by retail traders. But within MMC, it’s identified as the delivery to imbalance — a controlled descent into unmitigated demand.
🔷 6. Target + Reversal Zone – Where the Real Opportunity Begins
We are approaching the most important area on the chart:
🟡 Target + Reversal Zone (around 1.0950–1.1000)
This zone is not randomly drawn:
It's the origin of the arc breakout, a high-volume node.
It's a discounted price level where institutions may re-engage.
It’s untapped demand from the earlier accumulation — meaning no major reaction has occurred here yet.
If price slows down here, forms a liquidity sweep, or gives a bullish engulfing on the lower timeframe — this could be the reversal point.
But:
If price slices through with strong momentum, it may signal macro weakness, opening room to test the 1.0800 region.
🧭 Trade Plan & Execution Guide
Setup Type Actionable Guidance
📉 Bearish Pullback Entry Short entries near 1.1300–1.1350 with stop above minor resistance
🟡 Demand Reversal Watch Wait for reaction in 1.0950–1.1000, assess volume & candle response
📊 Structure Confirmation Use lower timeframe BOS for entry alignment
🛡️ Risk Management Keep risk below 1% per trade, avoid chasing mid-zone prices
💬 Key Takeaways
EURUSD has completed its accumulation → expansion → manipulation cycle.
We are now entering the rebalancing phase, where the market returns to fair value (demand).
Smart money flow is visible — from engineered highs to controlled selloffs.
The Target + Reversal Zone will likely dictate the next macro direction.
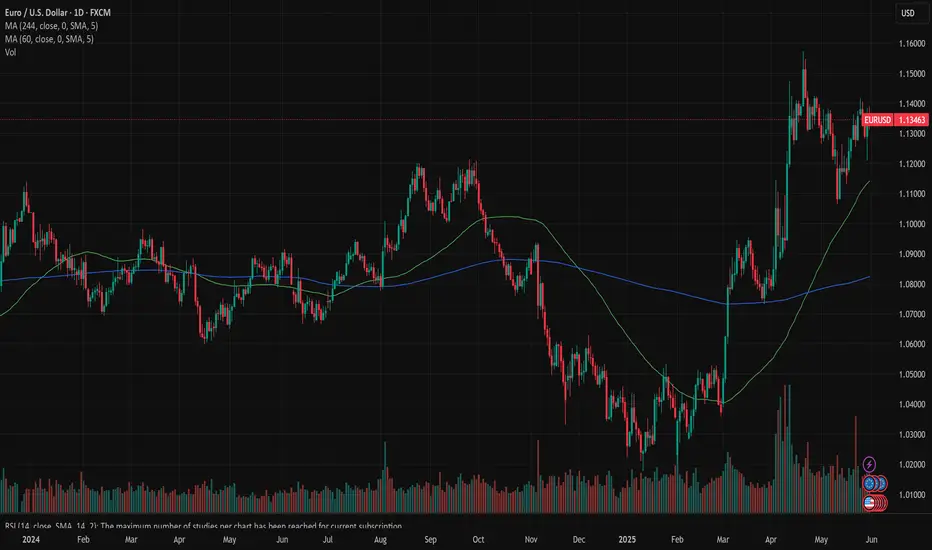
EURUSD: weekly focus on jobs dataThe previous week started with US macro data related to Durable Goods Orders. This indicator surprisingly dropped by -6,3% in April compared to the previous month. Although negative, the indicator was better from the market estimate of -6,8%. The second estimate of US GDP Growth rate for Q1 was -0,2%, and was a bit better from the market estimate of -0,3%. Fed's favorite inflation gauge, PCE data, was posted during the previous week. The PCE in April increased by 0,1%, which was in line with market anticipation. Core PCE was also standing at the level of 0,1% for the month. At the same time, Personal Income was higher by 0,8% in April, highly above forecasted 0,4%, while Personal Spending was higher by 0,2% for the month, and in line with market estimate. The week was closed with University of Michigan Consumer Sentiment. Final indicator level for May was 52,2, modestly above market expectation of 51. The five years inflation expectations were also modestly decreased to the level of 4,2%, which was below market estimate of 4,6%.
The GfK Consumer Confidence in Germany continues to move in a negative territory in June with the level of -19,9, a bit higher from market consensus at -19. The Unemployment rate in Germany in May remained unchanged from the previous month, at the level of 6,3%, and in line with market expectations. The Retail Sales in Germany in April dropped by -1,1% on a monthly basis, bringing the indicator to 2,3% when compared with the previous year. Preliminary Inflation estimate for Germany in May stands at 0,1% for the month and 2,1% on a yearly basis.
The currency pair moved in a mixed manner during the previous week. The highest weekly level at 1,1414 marked the start of the week, however, eurusd is ending the week lower, at the level of 1,1348. Still the lowest weekly level was shortly touched at Thursday's trading session at the level of 1,1213. The RSI moved between levels of 53 and 59, without a clear indication that the market is heading toward either side. The MA50 continues to diverge from MA200, without an indication of a potential change of course in the coming period.
The week ahead brings some important news, which the market is currently following with high anticipation. The US jobs data will be in focus in the week ahead, including the Non-farm payrolls for May. This might bring some higher volatility in case that the official data are not in line with market anticipation. On the other hand, the ECB meeting is scheduled for the week ahead, where ECB members will make a decision whether to cut interest rates for another time during this year. As per Reuters pool, there is a high probability that the ECB will make another cut at the June 5th meeting, by 25bps, bringing the facility rate to the level of 2%. This day might be another volatile day on the market. As per current charts, there is probability for eurusd to test 1,1250 short term support level in the week ahead, and this would be the level to watch. If it holds, then the eurusd will revert back with high probability to reach levels above the previous week's highs at 1,14. In this case, the currency pair will head to test 1,15 levels for one more time, but it might occur in more than one week. For the week ahead, the 1,14 resistance would be the level to watch. Current charts are showing low probability that the short term support at 1,1250 will be breached to the downside. Just in case that this move occurs, then the next level to watch will be 1,11. However, such a move currently has a low probability of occurrence.
Important news to watch during the week ahead are:
EUR: Inflation rate in EuroZone, flash for May, ECB rate decision, ECB Press conference, Trade Balance for Germany in April,
USD: ISM Manufacturing PMI for May, JOLTs Jobs Openings in April, ISM Services PMI for May, Non-farm Payrolls in May, Unemployment rate in May.
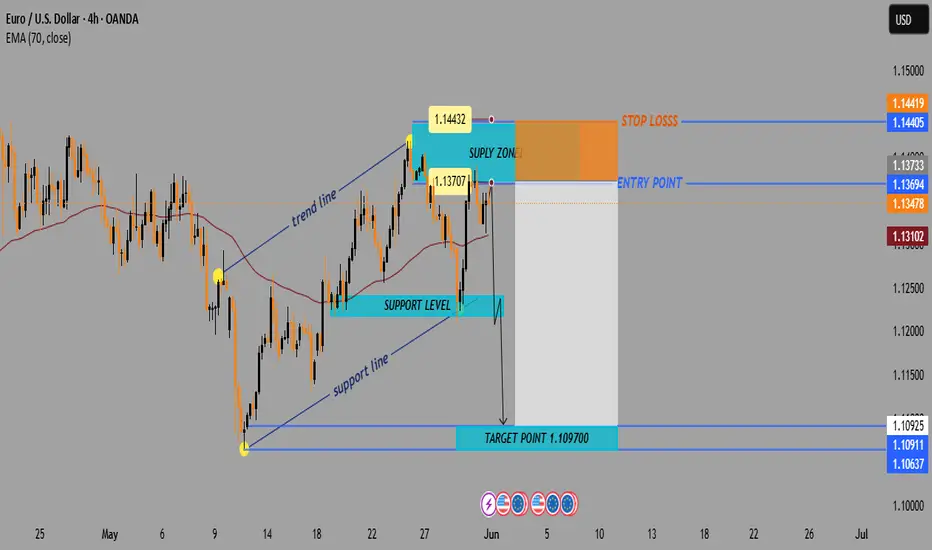
EUR/USD4H Bearish Trade Setup Supply Zone Rejection with 3:1 RRR🔷 Trend Overview
📈 Price was in a rising channel (trend line + support line).
❌ Channel broken on downside → potential trend reversal.
🟧 🔼 Supply Zone (Sell Area)
📍 Zone: 1.13707 – 1.14432
🟠 Price faced rejection here.
💡 Institutional selling likely in this zone.
🔥 This is the ideal short-entry area.
🟦 🔽 Entry Point
🎯 Entry: Around 1.13694
🧩 Sits just below supply zone = safer trigger.
✅ Wait for a bearish confirmation candle before entering.
🟨 Support Level
📉 Support Zone: ~1.13100 – 1.13400
📊 Recently broken with a strong bearish candle.
🧱 Used to act as a floor, now may act as resistance.
🟩 🎯 Target Point
✅ Take Profit: 1.10970
📎 Matches previous structure support.
💰 Lock in profits before the psychological level at 1.1100.
🟥 ⛔ Stop Loss
❌ Stop: 1.14419
📏 Placed above the supply zone for protection.
🛡️ Shields from false breakouts or spikes.
⚖️ Risk-to-Reward Ratio (RRR)
💡 Approx. 3:1 ✅
📉 Risk: ~70 pips
📈 Reward: ~270 pips
🔥 High-probability setup
📌 EMA (Exponential Moving Average – 70)
📍 EMA 70 at 1.13102
🔻 Price is below the EMA → favors bearish momentum
🧠 Pro Tips:
🔍 Watch for bearish engulfing or rejection candles at the entry zone.
🗓️ Be aware of major news events (ECB, Fed).
🧮 Adjust lot size for risk management (based on SL size).
✅ Summary:
🧩 Element 📊 Value
Trade Type 🔻 Short (Sell)
Entry Point 📌 1.13694
Stop Loss ⛔ 1.14419
Take Profit 🎯 1.10970
RRR ⚖️ ~3:1
Sentiment 📉 Bearish
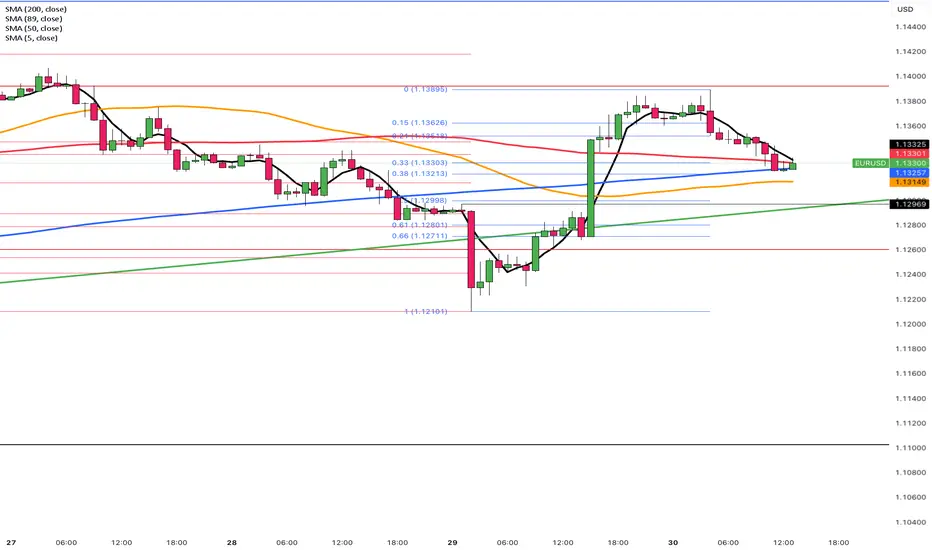
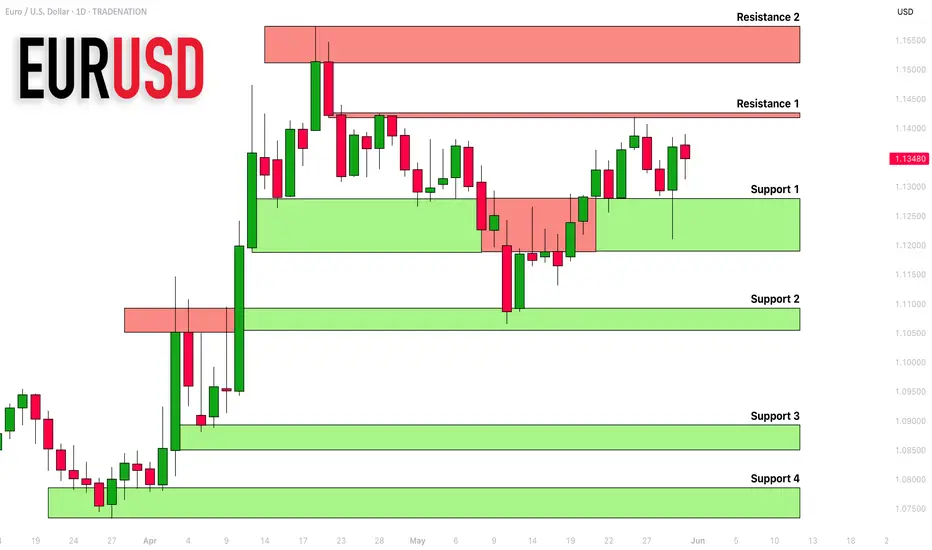
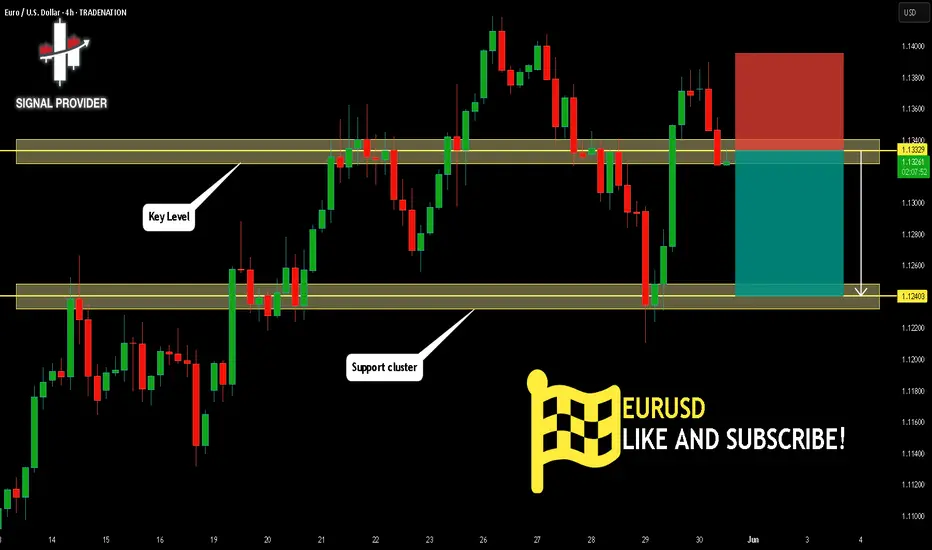
EURUSD: Detailed Support & Resistance Analysis For Next Week
Here is my latest structure analysis
and important supports and resistances for EURUSD
for next week.
Consider these structures for pullback/breakout trading.
❤️Please, support my work with like, thank you!❤️
I am part of Trade Nation's Influencer program and receive a monthly fee for using their TradingView charts in my analysis.
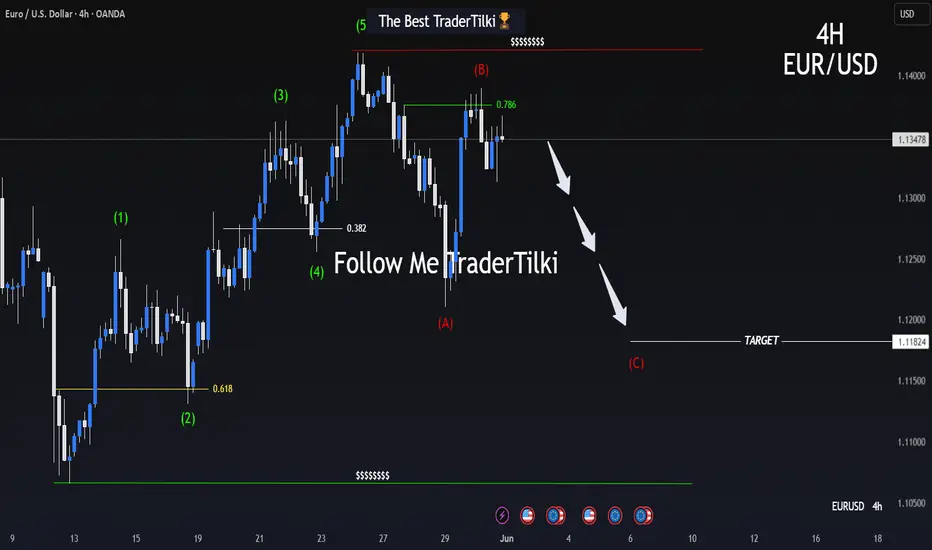
EURUSD 4H ELLIOTT WAVE COUNT – DOWNSIDE TARGET CONFIRMED!Good Morning, Traders,
I’m sharing my wave analysis for EURUSD with you. After completing its first five waves, it formed the A-B wave and is now expected to move into the C wave.
The target level for the C wave is currently 1.11838.
I meticulously prepare these analyses for you, and I sincerely appreciate your support through likes. Every like from you is my biggest motivation to continue sharing my analyses.
I’m truly grateful for each of you—love to all my followers
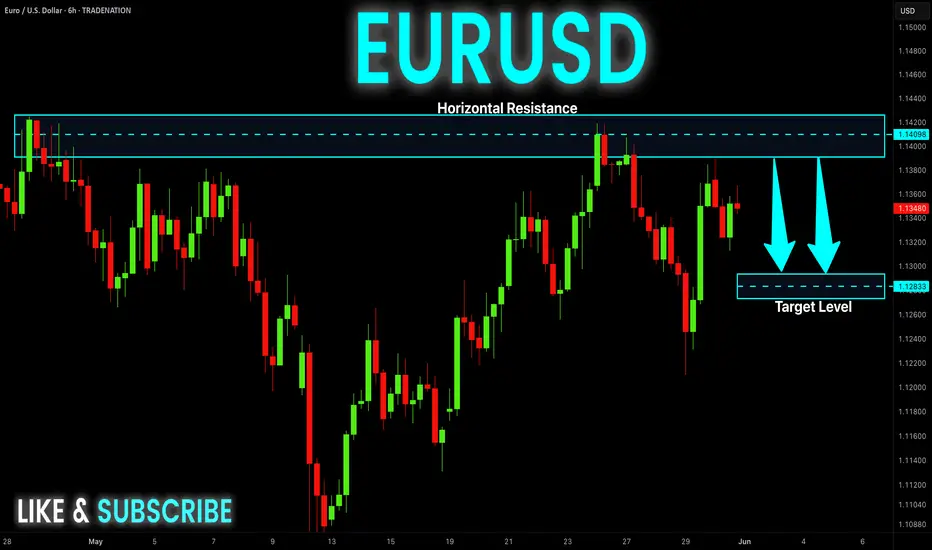
EUR-USD Bearish Bias! Sell!
Hello,Traders!
EUR-USD will soon hit a
Strong horizontal resistance
Level around 1.1420 so as
It is a strong level a local
Bearish pullback and a move
Down are to be expected
On Monday
Sell!
Comment and subscribe to help us grow!
Check out other forecasts below too!
Disclosure: I am part of Trade Nation's Influencer program and receive a monthly fee for using their TradingView charts in my analysis.
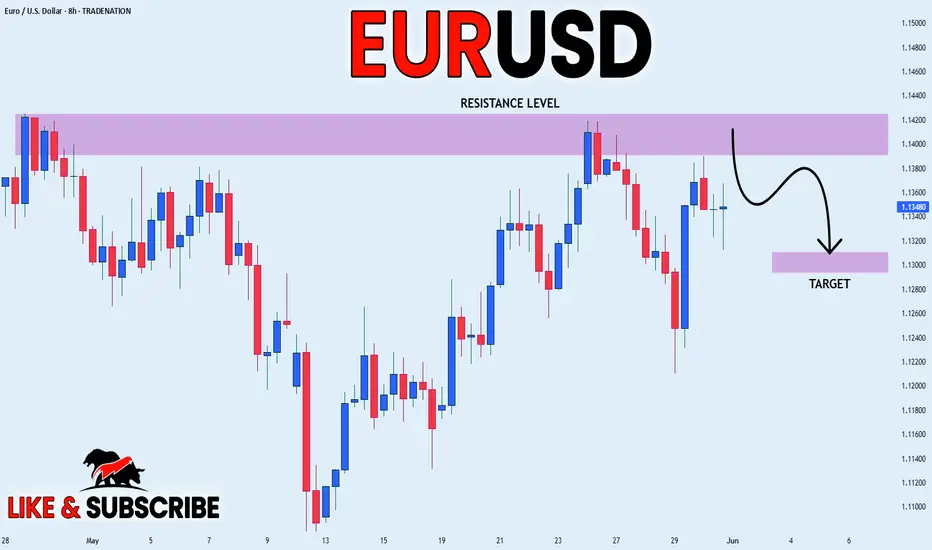
EUR_USD WILL FALL|SHORT|
✅EUR_USD is going up now
But a strong resistance level is ahead at 1.1425
Thus I am expecting a pullback
And a move down towards the target
Below at 1.1310on Monday!
SHORT🔥
✅Like and subscribe to never miss a new idea!✅
Disclosure: I am part of Trade Nation's Influencer program and receive a monthly fee for using their TradingView charts in my analysis.
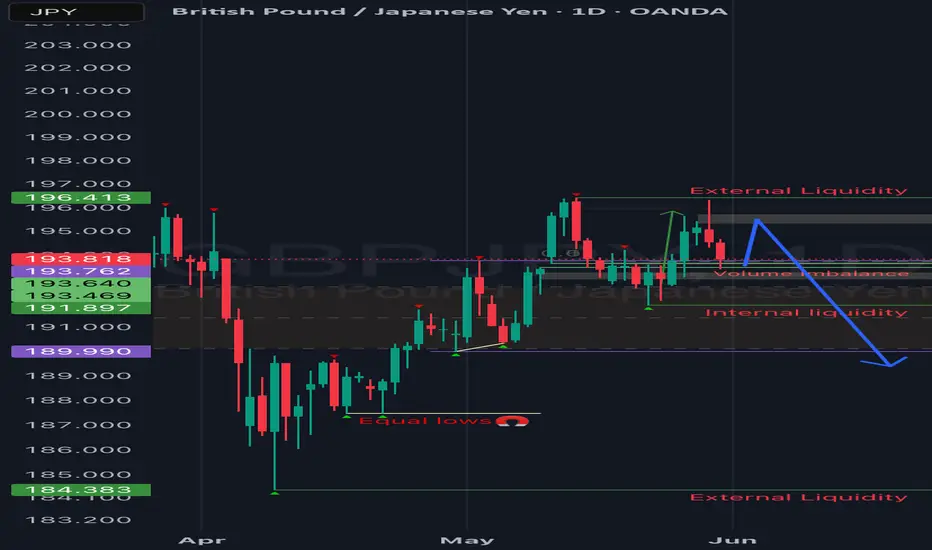
GBPJPY update!!Good day traders, I’m back with yet another beautiful setup on GJ and I really wish we can all monitor how price plays out and learn more about price signature.
For this setup I’ll explain more about it after the fact because it’ll help me make my point clearer and easily understandable.
Yet another gift..🎁🧧
EURUSD Possible AnalysisEURUSD has been overall bullish with retracemets here and there. It has recently made a deep retracement that could be mistaken for a shift in market structure, while in reality it's just liquidity accumulation. Price recently shifted structure back to bullish on 4h timeframe where it preceded to break more structure before retracing to sweep liquidity below a low and tap a fvg in the process. It preceded to shift structure on the 1h time frame, breaking with a huge bullish candle symbolizing increase in bullish momentum. It is currently retracing towards an orderblock that was responsible for the break and could possibly retest it and fill the imbalance above it before it continues its bullish move up to take out the latest weak high.
EURUSD Under Pressure! SELL!
My dear friends,
Please, find my technical outlook for EURUSD below:
The instrument tests an important psychological level 1.1348
Bias - Bearish
Technical Indicators: Supper Trend gives a precise Bearish signal, while Pivot Point HL predicts price changes and potential reversals in the market.
Target - 1.1313
About Used Indicators:
Super-trend indicator is more useful in trending markets where there are clear uptrends and downtrends in price.
Disclosure: I am part of Trade Nation's Influencer program and receive a monthly fee for using their TradingView charts in my analysis.
———————————
WISH YOU ALL LUCK

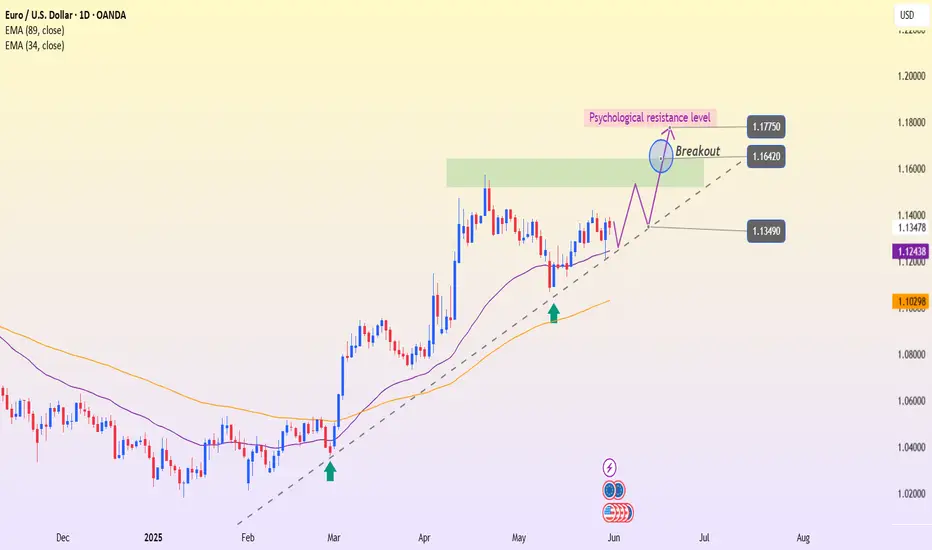
EURUSD – Ready to Break the Psychological CeilingOn the D1 chart, EURUSD is maintaining a stable uptrend structure with higher lows and a well-respected trendline. Buying pressure continues to emerge around the EMA 34 support zone, indicating that the bulls remain in control.
Currently, price is approaching the psychological resistance level at 1.16420 – an area that has rejected price multiple times in the past. However, a potential breakout pattern is forming: if the price can close decisively above this zone, the next target could extend to 1.17750.
While waiting for a breakout confirmation, traders can watch for minor pullbacks toward the trendline or EMA to find entries aligned with the trend. The overall momentum still favors the buyers, as long as the 1.13490 level holds.
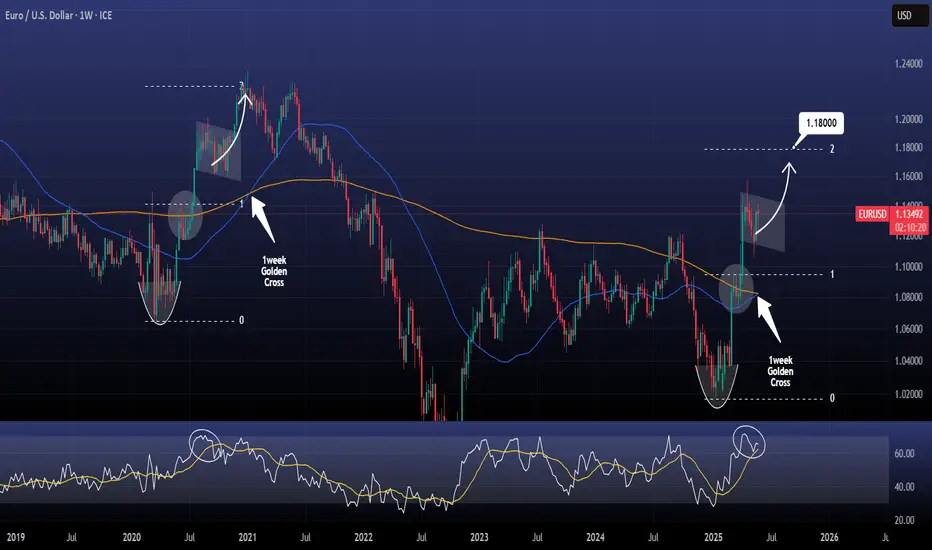
EURUSD Bull Flag and 1week Golden Cross pushing it higher.EURUSD is on a Bull Flag pattern and just completed a 1week Golden Cross.
The structure is identical to the last 1week Golden Cross on January 11th 2021, which was also formed at the end of a Bull Flag pattern.
That formation pushed the pair higher to complete a 2.0 Fibonacci extension Top.
Buy and target 1.1800.
Follow us, like the idea and leave a comment below!!
EURUSD: Strong Bullish Sentiment! Long!
My dear friends,
Today we will analyse EURUSD together☺️
The price is near a wide key level
and the pair is approaching a significant decision level of 1.13516 Therefore, a strong bullish reaction here could determine the next move up.We will watch for a confirmation candle, and then target the next key level of 1.13768.Recommend Stop-loss is beyond the current level.
❤️Sending you lots of Love and Hugs❤️
Gold at Key Rejection Zone: Will the Drop Resume from $3310?By examining the gold chart on the 4-hour timeframe, we can see that after some consolidation between $3294 and $3302, the price finally began a sharp drop, correcting down to $3245. This area was a key demand zone on lower timeframes, which triggered a rebound, and gold is now trading around $3310. If the price gets rejected from the $3310–$3313 zone, we can expect another potential decline.
Please support me with your likes and comments to motivate me to share more analysis with you and share your opinion about the possible trend of this chart with me !
Best Regards , Arman Shaban

EURUSD Structural Analysis | Curve Breakout to Key Reversal Zone🔍 Structure Analysis:
The EURUSD pair has been exhibiting classic smart money behavior following a reaccumulation phase beneath a curved resistance structure. This curve acted as a dynamic liquidity ceiling, engineered to trap breakout traders during early sessions and encourage early shorts — only to be invalidated later by institutional momentum.
What we now see is a clean structural breakout, a shift in market sentiment, and a precision drive toward premium liquidity zones, where we expect reactions from institutional orders or profit-taking.
📐 Technical Breakdown:
🔹 1. Curved Resistance Breakout (Trend Manipulation Layer)
The curve represents a multi-touch descending resistance line that was gradually compressing price.
Multiple rejections created a false sense of bearish continuation, but in reality, smart money was accumulating positions under the curve.
The final breakout was impulsive and occurred on elevated volume, breaking both the curve and a short-term bearish structure.
🔹 2. Bullish Market Structure Confirmation
Higher highs and higher lows are now clearly established.
After the curve break, the price pulled back slightly, respecting the new trendline support — a sign of retest behavior and continuation.
The previous internal structure break was confirmed after a key swing high was violated, flipping the order flow to bullish.
🔹 3. SR Interchange + QFL Demand Zone
The 1.11800–1.12200 zone held firm during the retracement, previously acting as a strong resistance and now a support flip.
This zone coincides with a QFL-style accumulation base — a concept based on sudden dips into support where big orders are filled before sharp reversals.
Wick rejections and candle closes show strong interest by buyers.
🔹 4. Trendline & Structure Alignment
A clean ascending trendline is acting as dynamic support.
Each touch on the trendline has been followed by bullish expansion — another indication of institutional order flow support.
This trendline also aligns with internal FVGs (Fair Value Gaps), offering more confluence.
🔹 5. Liquidity Magnet: Next Major Zone
The next key area is marked around 1.15500–1.15750, which is a previous structural high, order block, and likely liquidity pool for pending sell-side orders.
This area is expected to act as a magnet, pulling price toward it before a potential reversal or redistribution phase begins.
📊 Trade Management Plan:
Parameter Details
Bias Bullish (Short-Term to Mid-Term)
Entry Zones Retest of trendline or minor FVGs
TP1 1.14500 (interim supply)
TP2 (Main) 1.15500–1.15750 (major liquidity zone)
SL Below 1.11800 (invalidates bullish idea)
RR Target 1:2.5 to 1:3 depending on entry precision
🧠 Concepts Applied:
Smart Money Concepts (SMC)
Break of Structure (BOS) & Change of Character (CHOCH)
Curve Manipulation / Compression
SR Flip (Support-Resistance Interchange)
QFL (Quasimodo Failure Level)
Trendline + FVG Confluence
Liquidity Pool Targeting
Volume Expansion Breakout Confirmation
🛎️ Watchlist Notes & Trade Expectations:
Expect short-term pullbacks into the 1.13000–1.13200 zone for liquidity re-tests.
Watch for reaction or sweep near 1.15500 — this is where short-term sellers may enter, and institutions may offload.
If price holds above the trendline and consolidates near the high, a continuation leg to even higher targets (1.16500) is possible — depending on macro conditions.
✅ Conclusion:
This EURUSD setup is a high-probability opportunity shaped by smart money behavior and deep structural context. The combination of the curve breakout, trendline strength, and liquidity targeting provides a clear roadmap for execution and management.
Use this analysis as a framework — always confirm with price action and risk management aligned with your personal strategy.
EURUSD: Bullish Forecast & Outlook
The analysis of the EURUSD chart clearly shows us that the pair is finally about to go up due to the rising pressure from the buyers.
Disclosure: I am part of Trade Nation's Influencer program and receive a monthly fee for using their TradingView charts in my analysis.
❤️ Please, support our work with like & comment! ❤️

EURUSD | Bearish Divergence | Bearish MomentumCurrently, EURUSD is clearly in a downtrend, consistently forming lower lows and lower highs, confirming a bearish market structure. According to Dow Theory, the recent bullish momentum has now shifted into a confirmed downtrend. Additionally, the 1-hour trendline support has been broken, signaling weakness in the previous bullish leg. We now anticipate a pullback toward the recently broken structure or resistance zone, where further bearish continuation is likely.
On the 1-hour timeframe, a well-formed bearish divergence on the RSI adds confluence to our bias, indicating weakening bullish momentum and a potential trend continuation to the downside. Since our initial entry was slightly late, we’ve strategically placed a limit order near the retest zone and executed a partial position at the current market price to secure early exposure. Overall, structure and momentum both align with short-term bearish sentiment.

Euro can reach resistance line of pennant and then dropHello traders, I want share with you my opinion about Euro. The price of the Euro had been gradually declining, forming a series of lower highs and finding support around the 1.1070 - 1.1025 buyer zone. This pullback created the groundwork for a new structure to form as volatility narrowed and momentum shifted. After reaching a local bottom, the market rebounded and began constructing an upward pennant, a classic consolidation pattern that often precedes continuation or reversal, depending on breakout direction. Within this pennant, price respected both trendlines, each approach to the upper resistance was followed by a rejection, and each touch of the support line triggered a bounce. Now, the Euro is moving closer to the resistance line of the pennant once again. Given the overall structure, proximity to the 1.1415 resistance level, and prior reactions from the seller zone, I think the Euro can reach the top boundary and then continue to decline, potentially breaking below the pattern. That’s why I set my TP at 1.1150 points, targeting a move toward the support level and exit from the pennant. Please share this idea with your friends and click Boost 🚀
Disclaimer: As part of ThinkMarkets’ Influencer Program, I am sponsored to share and publish their charts in my analysis.

EURUSD Will Move Lower! Sell!
Please, check our technical outlook for EURUSD.
Time Frame: 4h
Current Trend: Bearish
Sentiment: Overbought (based on 7-period RSI)
Forecast: Bearish
The price is testing a key resistance 1.133.
Taking into consideration the current market trend & overbought RSI, chances will be high to see a bearish movement to the downside at least to 1.124 level.
P.S
Overbought describes a period of time where there has been a significant and consistent upward move in price over a period of time without much pullback.
Disclosure: I am part of Trade Nation's Influencer program and receive a monthly fee for using their TradingView charts in my analysis.
Like and subscribe and comment my ideas if you enjoy them!
EUR/USD Drifts Lower as Dollar ReboundsEUR/USD is struggling to hold onto Thursday’s rebound from the 1.1200 region—its lowest in nearly 10 days—and trades with a slight bearish bias in Friday’s Asian session. The pair is hovering near the mid-1.1300s, down around 0.15% on the day.
The US Dollar regained some ground due to renewed safe-haven demand after a federal appeals court reinstated former President Trump’s broad trade tariffs, injecting fresh uncertainty into the markets. However, the dollar’s momentum remains limited by concerns over the US fiscal outlook and expectations of Fed rate cuts in 2025.
The euro finds partial support as Trump postponed tariffs on EU imports. Market focus now shifts to the upcoming US PCE inflation data, which may influence Fed policy expectations, followed by next Thursday’s ECB meeting for further direction.
Resistance is seen at 1.1400, with higher levels at 1.1460 and 1.1500. Support is located at 1.1300, followed by 1.1260 and 1.1210.