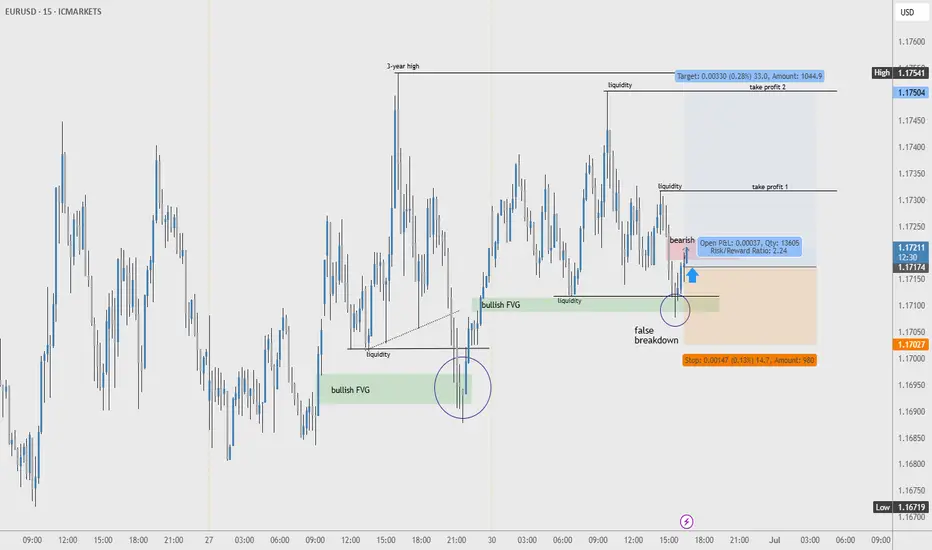
EURUSD M15 Buy signal intradayTechnical:
1. Bullish FVG
2. False Breakdown
3. Bullish Reaction
Fundamental:
- neutral-bullish
Eurusd-4
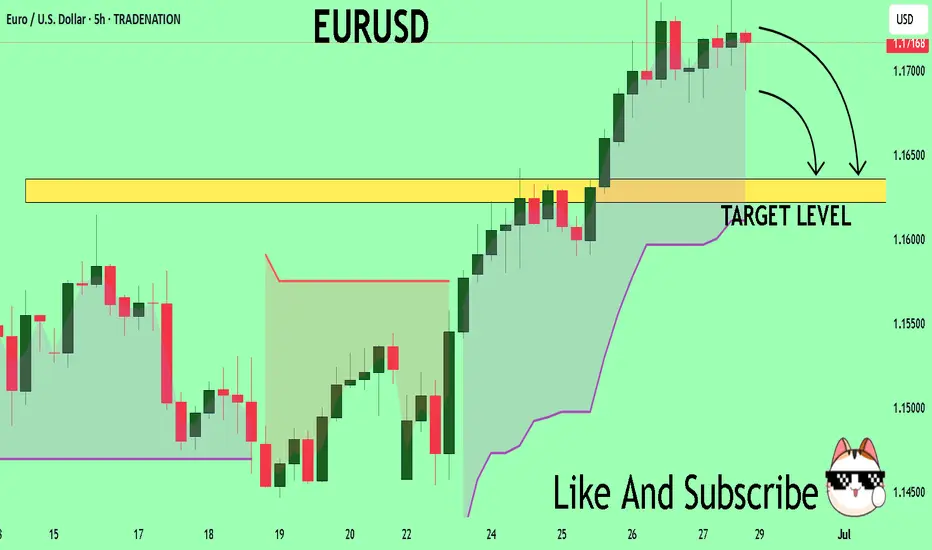
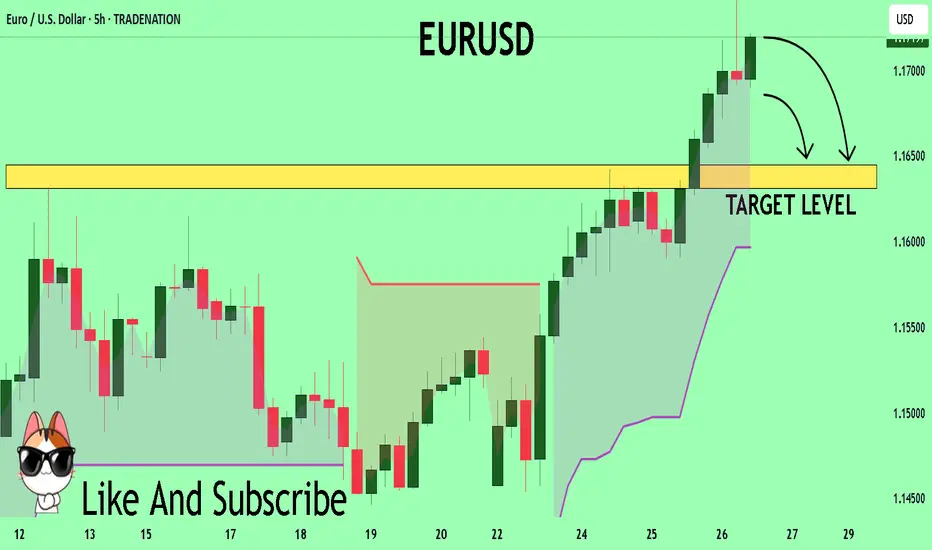
EURUSD Will Go Higher From Support! Long!
Take a look at our analysis for EURUSD.
Time Frame: 1h
Current Trend: Bullish
Sentiment: Oversold (based on 7-period RSI)
Forecast: Bullish
The market is on a crucial zone of demand 1.172.
The oversold market condition in a combination with key structure gives us a relatively strong bullish signal with goal 1.177 level.
P.S
We determine oversold/overbought condition with RSI indicator.
When it drops below 30 - the market is considered to be oversold.
When it bounces above 70 - the market is considered to be overbought.
Disclosure: I am part of Trade Nation's Influencer program and receive a monthly fee for using their TradingView charts in my analysis.
Like and subscribe and comment my ideas if you enjoy them!
EUR/USD Keeps Climbing – Dollar on the Back FootEUR/USD is still pushing higher today, trading around 1.171 and showing no signs of slowing down. The pair’s strength is backed by both technical momentum and the current market backdrop.
What’s fueling the move? Simple: the US dollar is under pressure again. Fresh concerns about the Federal Reserve’s independence — especially with talks around replacing Powell — are shaking investor confidence. That’s giving the euro the upper hand and helping this pair hover near its highest level in four years.
Looks like the bulls aren’t done yet. You riding this trend?

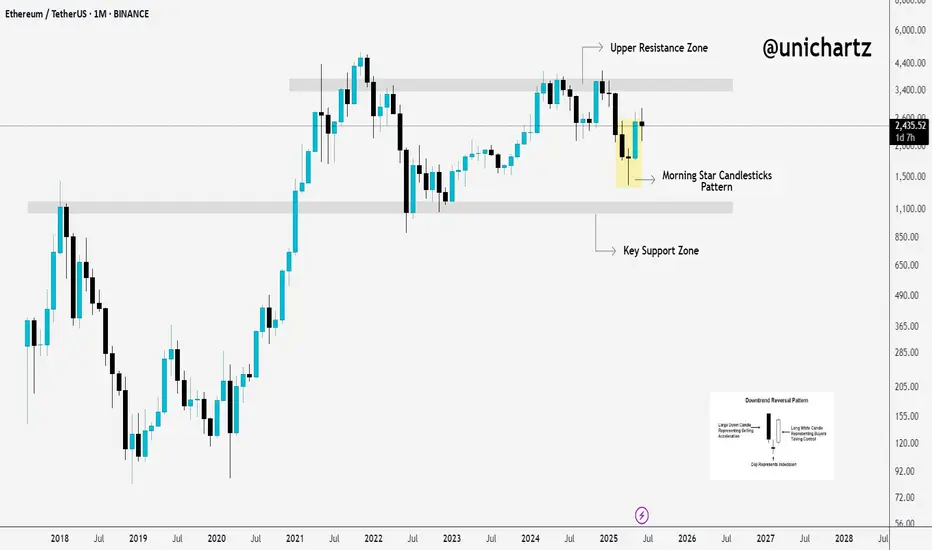
Ethereum Rebounds from Strong Base – ATH in Sight?Hello traders, here’s the CRYPTOCAP:ETH Monthly Outlook
Ethereum is flashing early signs of a bullish reversal, with a clean Morning Star candlestick pattern forming right above the $1,050–$1,200 support zone, a historically strong base.
After bouncing hard from this level, ETH is now approaching the major resistance area at $3,400–$3,800, the same zone that previously rejected upward moves.
If ETH can break and close above this resistance, we could see the start of a fresh bullish leg. But until then, this zone remains a major hurdle.
Keep an eye on the monthly close, it could confirm a shift in long-term momentum.
DYOR, NFA
Thanks for following along — stay tuned for more updates!
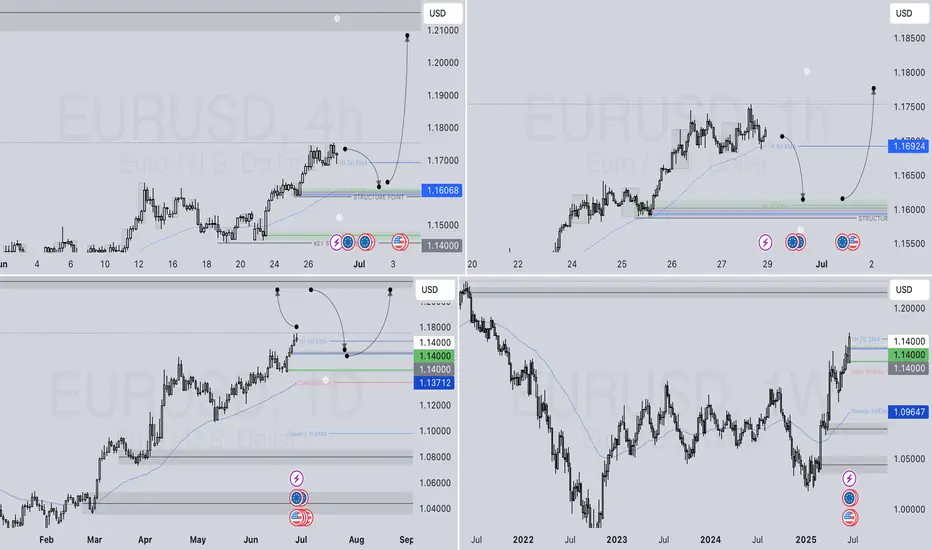
EURUSD WEEKLY HIGHER TIME FRAME FORECAST Q3 W27 Y25EURUSD WEEKLY HIGHER TIME FRAME FORECAST Q3 W27 Y25
Professional Risk Managers👋
Welcome back to another FRGNT chart update📈
Diving into some Forex setups using predominantly higher time frame order blocks alongside confirmation breaks of structure.
Let’s see what price action is telling us today! 👀
💡Here are some trade confluences📝
✅Weekly Order block identified
✅Daily Order block identified
✅4H Order Block identified
🔑 Remember, to participate in trading comes always with a degree of risk, therefore as professional risk managers it remains vital that we stick to our risk management plan as well as our trading strategies.
📈The rest, we leave to the balance of probabilities.
💡Fail to plan. Plan to fail.
🏆It has always been that simple.
❤️Good luck with your trading journey, I shall see you at the very top.
🎯Trade consistent, FRGNT X
EURUSD..BUYAnalysis complete — scenarios outlined. The zone could be a decision point for . Price reaction here may define the next move.
If price breaks and pulls back to retest, a reversal setup might emerge.
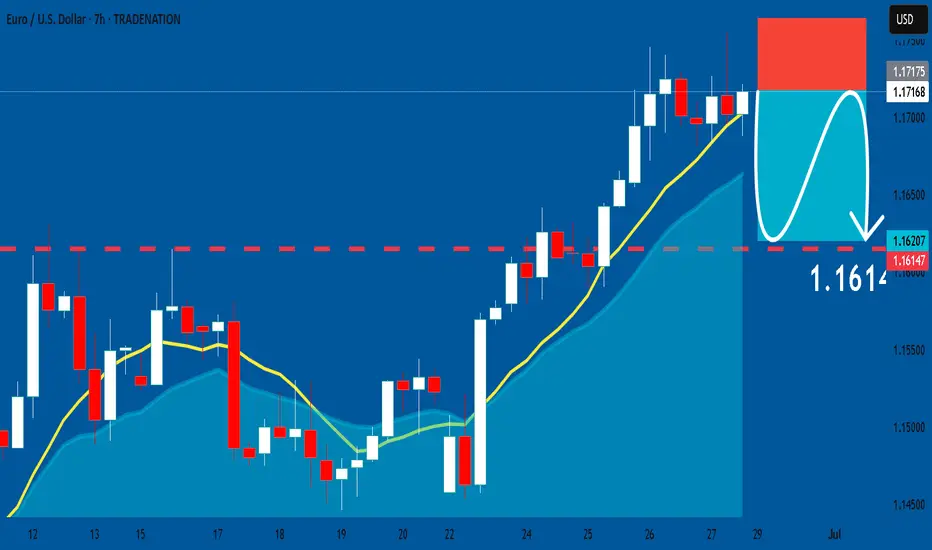
EURUSD: Short Trading Opportunity
EURUSD
- Classic bearish setup
- Our team expects bearish continuation
SUGGESTED TRADE:
Swing Trade
Short EURUSD
Entry Point - 1.1717
Stop Loss - 1.1764
Take Profit - 1.1614
Our Risk - 1%
Start protection of your profits from lower levels
Disclosure: I am part of Trade Nation's Influencer program and receive a monthly fee for using their TradingView charts in my analysis.
❤️ Please, support our work with like & comment! ❤️
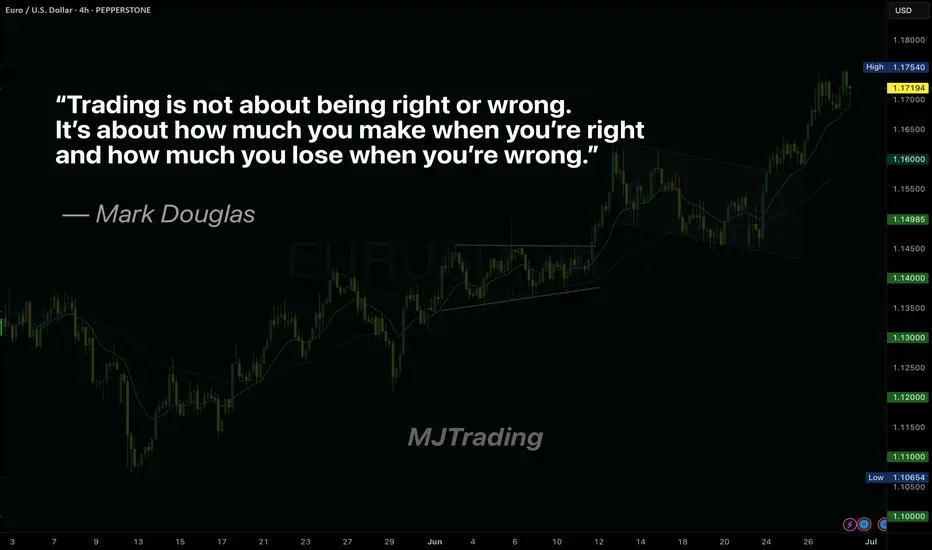
Master Your Edge: It’s Not About Just Being Right
Most traders obsess over being right on every trade. But the truth is, consistent profitability doesn’t come from perfect predictions—it comes from disciplined risk management.
Mark Douglas reminds us:
“Trading is not about being right or wrong. It’s about how much you make when you’re right and how much you lose when you’re wrong.”
Focus less on proving yourself right, and more on protecting your capital when you’re wrong. That’s how professionals thrive in uncertain markets.
#MJTrading
#TradingPsychology #MarkDouglas #ForexMindset #TraderMindset #EURUSD #TradingQuotes #ForexLife #RiskManagement #TradingDiscipline #ForexEducation #ChartOfTheDay #PriceAction #MindOverMarkets
Eurusd Short-term bearish EUR/USD is showing bearish momentum, breaking below key support with lower highs forming. Selling pressure is increasing amid a stronger USD outlook, favoring a short position.
EUR/USD – Smart Money Trap at 1.18? Massive Rejection Ahead 1. Technical Context
The pair has been moving inside a well-defined bullish channel since May, forming higher highs and higher lows. Price is currently hovering around 1.1718, approaching the upper boundary of the channel and a key weekly supply zone (1.1750–1.1850).
➡️ Potential scenario:
A short bullish extension toward 1.1780–1.1820 to trigger stop hunts, followed by a bearish rejection toward 1.1500, and potentially 1.1380.
The daily RSI is overbought (>70), suggesting a likely short-term correction.
2. Retail Sentiment
80% of retail traders are short, with an average entry around 1.1318.
This signals a liquidity cluster above current highs, increasing the likelihood of a fake bullish breakout followed by a sell-off.
➡️ Contrarian insight: Retail heavily short → market may push higher first to wipe them out before reversing lower.
3. COT Report – USD Index (DXY)
Non-commercials (speculators) increased their short exposure on USD (+3,134).
Commercials cut their short positions (-1,994), indicating a potential bottoming on the dollar.
➡️ Conclusion: USD strength could return soon → bearish pressure for EUR/USD.
4. COT Report – EUR FX
Non-commercials increased longs on EUR (+2,980) and sharply reduced shorts (-6,602) → market is now heavily net long.
Commercials remain net short (581,664 vs 417,363 longs).
➡️ Over-leveraged spec longs → vulnerable to downside squeeze if macro sentiment shifts.
5. Seasonality
June tends to be mildly bullish for EUR/USD.
July historically shows even stronger upward performance over the last 5–10 years.
➡️ Shorts are high risk in the very short term, but a bearish setup is likely in the second half of July, especially if price action confirms.
6. Trading Outlook
📍 Short-Term Bias: Neutral to bullish toward 1.1780–1.1820
📍 Mid-Term Bias: Bearish on rejection from supply area and break of channel
🎯 Key Levels:
1.1780–1.1850: critical decision zone (liquidity + weekly supply)
1.1500: first key support
1.1380: next downside target (demand zone + previous POC)
📌 Final Conclusion
The most likely play is a short setup from 1.1780–1.1850 on strong rejection, supported by:
Extreme retail positioning (80% short),
COT pointing to USD recovery,
Extended technical structure,
Overbought RSI on the daily chart.

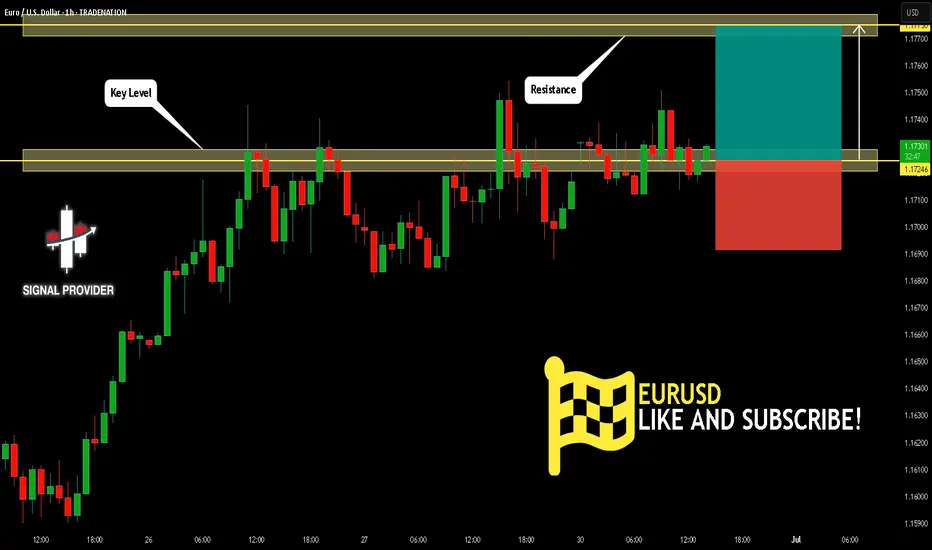
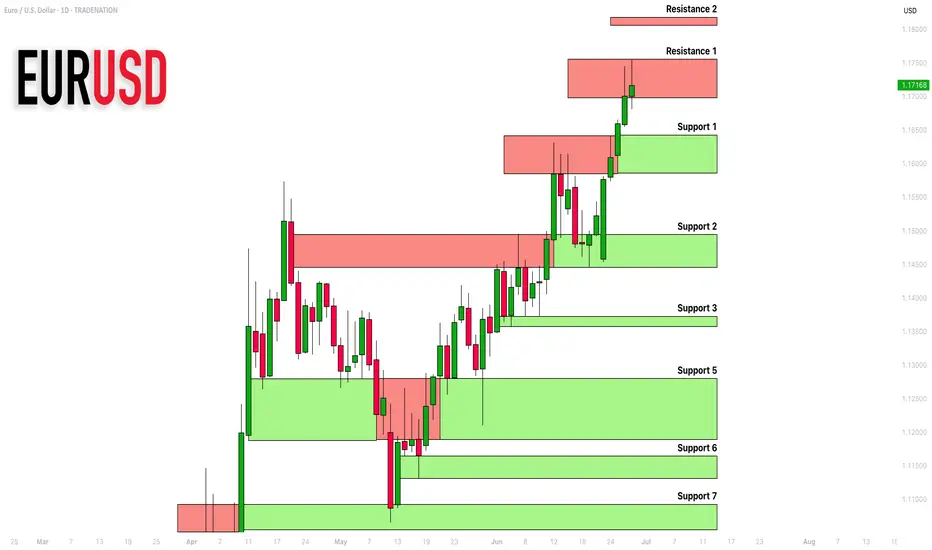
EURUSD: Support & Resistance Analysis for Next Week 🇪🇺🇺🇸
Here is my latest structure analysis
and important supports & resistances for EURUSD for next week.
Consider these structures for pullback/breakout trading.
❤️Please, support my work with like, thank you!❤️
I am part of Trade Nation's Influencer program and receive a monthly fee for using their TradingView charts in my analysis.
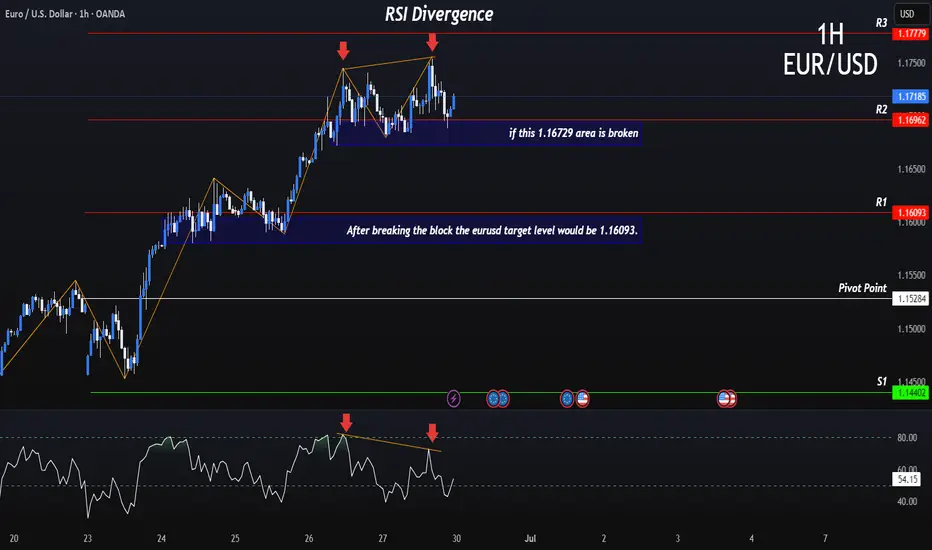
RSI Flashes Warning on EURUSD: Critical Level Under Watch!Good morning traders,
If the EURUSD pair breaks below the 1.16729 level due to an RSI divergence, the next potential target could be around 1.16093.
Keep in mind that a break below 1.16729 may also signal a potential trend reversal.
I've marked the pivot points for you on the chart for better clarity.
Additionally, it's crucial to keep an eye on current economic data and news releases as part of your fundamental analysis.
I meticulously prepare these analyses for you, and I sincerely appreciate your support through likes. Every like from you is my biggest motivation to continue sharing my analyses.
I’m truly grateful for each of you—love to all my followers💙💙💙
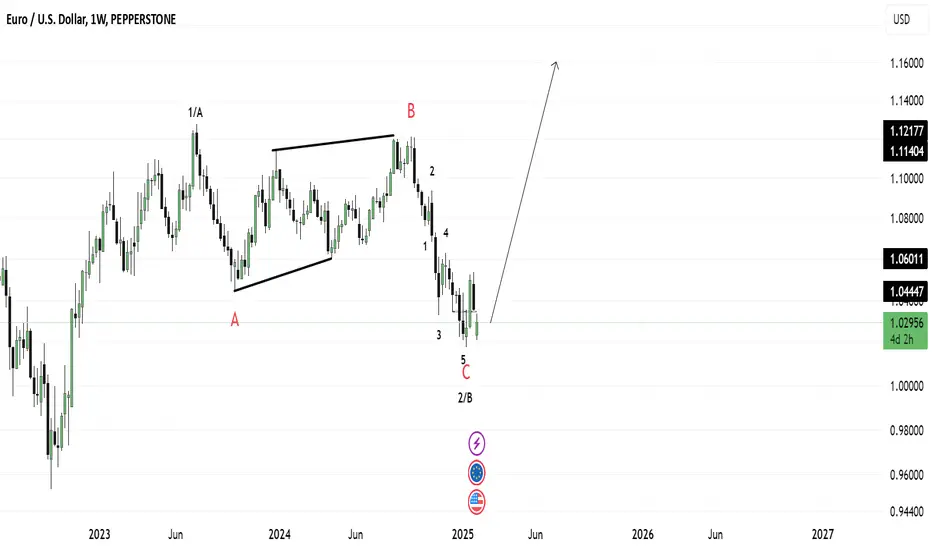
Elliott Wave Analysis for EUR/USD - Bullish OutlookPEPPERSTONE:EURUSD
This analysis is based on the application of Elliott Wave principles for the EUR/USD market on a weekly timeframe.
💡 Wave Identification:
Corrective Cycle (ABC): After a peak marked by wave B, the market completed a 5-wave downward structure (waves 1 to 5), forming wave C, signaling a possible end of the correction.
Potential Reversal Zone (2/B): The current point is a strategic level where a bullish rebound is anticipated.
📊 Projection:
A bullish impulse is expected from point C. The initial target lies in the 1.1140 - 1.1217 zone, corresponding to key resistance levels and Fibonacci projections.
🧠 Conclusion:
A breakout above 1.0440 could confirm a significant bullish impulse, suggesting buyers are regaining control.
⚠️ Disclaimer : This analysis is not financial advice. Always conduct your own research before investing.
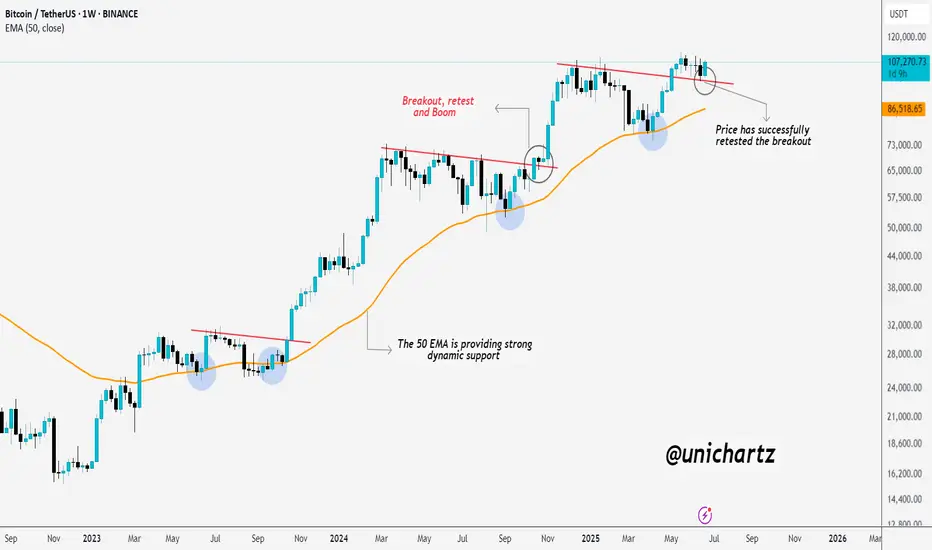
Bitcoin Bounced Right Where It ShouldBitcoin continues to respect the script — breakout, clean retest, and now holding strong.
The 50 EMA has been a reliable dynamic support throughout the entire uptrend, and once again, it helped catch the recent dip. Price has now successfully retested the breakout zone and is starting to bounce.
Structure looks healthy, momentum is building, and unless the support fails, the next leg up could be just around the corner.
Simple setups. No noise. Just trend.
DYOR, NFA
EURUSD What Next? SELL!
My dear friends,
My technical analysis for EURUSD is below:
The market is trading on 1.1716 pivot level.
Bias - Bearish
Technical Indicators: Both Super Trend & Pivot HL indicate a highly probable Bearish continuation.
Target - 1.1635
About Used Indicators:
A pivot point is a technical analysis indicator, or calculations, used to determine the overall trend of the market over different time frames.
Disclosure: I am part of Trade Nation's Influencer program and receive a monthly fee for using their TradingView charts in my analysis.
———————————
WISH YOU ALL LUCK
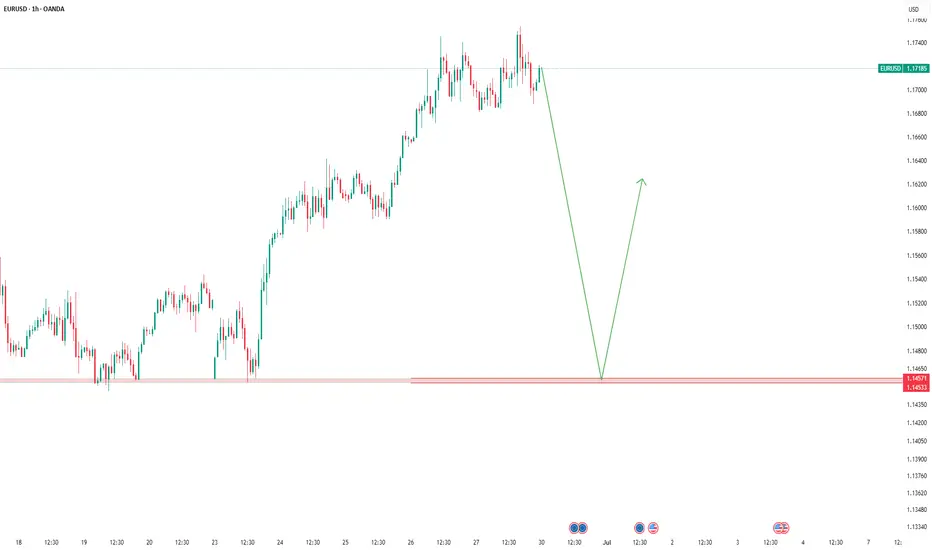
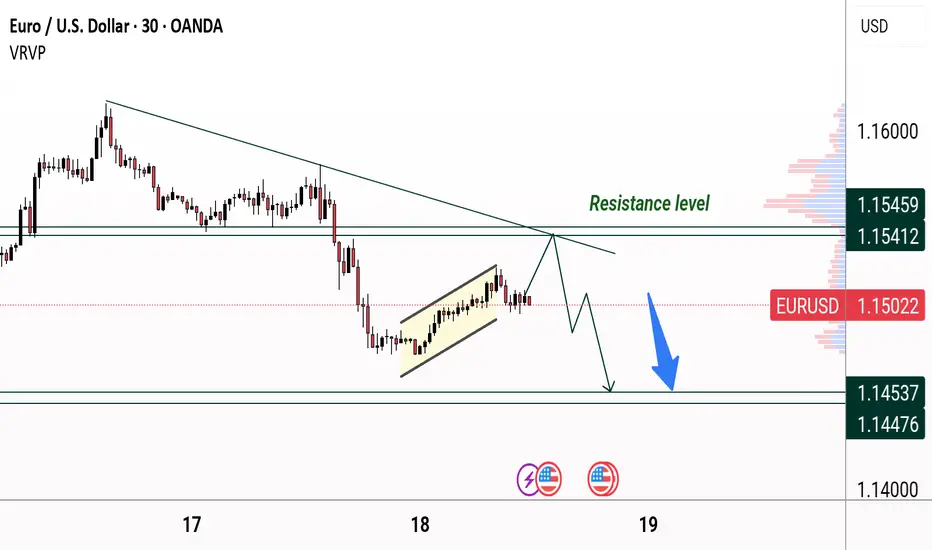
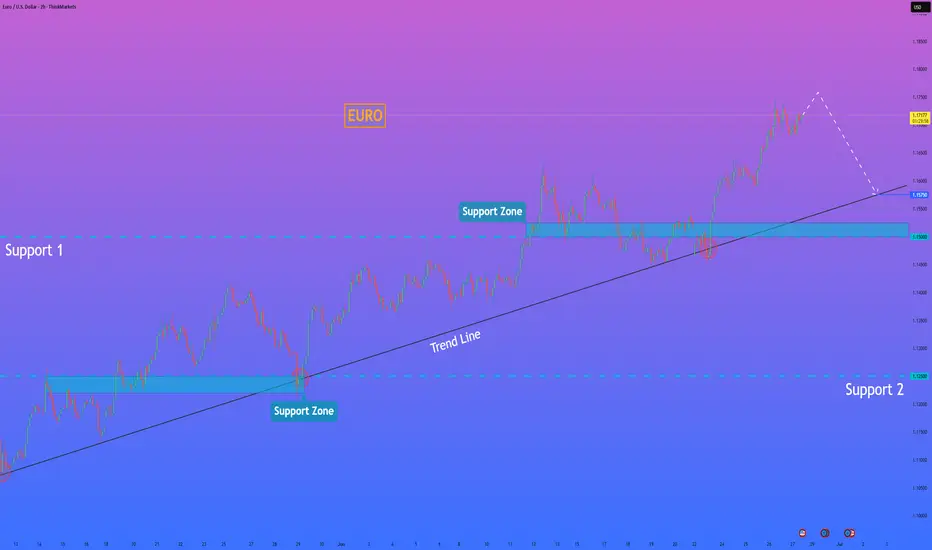
HelenP. I Euro will drop to trend line, after movement upHi folks today I'm prepared for you Euro analytics. If we look at the chart, we can see that EURUSD has been moving in a stable upward trend, supported by a clear ascending trend line. Each time the price approached this line, it rebounded and continued to grow, respecting the bullish structure. After the recent breakout from the support zone around 1.1500, the market made a strong impulse to the upside and reached a local high. Now, the momentum seems to be slowing down, which opens the possibility for a corrective movement. Given this setup, I expect that the price could first make a small upward push to trap late buyers, and then turn around to begin a decline. The trend line remains a critical technical level, and I anticipate the price will revisit it soon. For this reason, I’ve placed my goal at 1.1575 points — this area aligns with the trend line and can serve as the next support if a pullback occurs. As long as this level holds, the market remains in a bullish structure, but a correction seems likely before further growth. If you like my analytics you may support me with your like/comment.
Disclaimer: As part of ThinkMarkets’ Influencer Program, I am sponsored to share and publish their charts in my analysis.
EUR/USD Wave 5 Topped? Correction Incoming to 1.076FX_IDC:EURUSD PEPPERSTONE:EURUSD OANDA:EURUSD
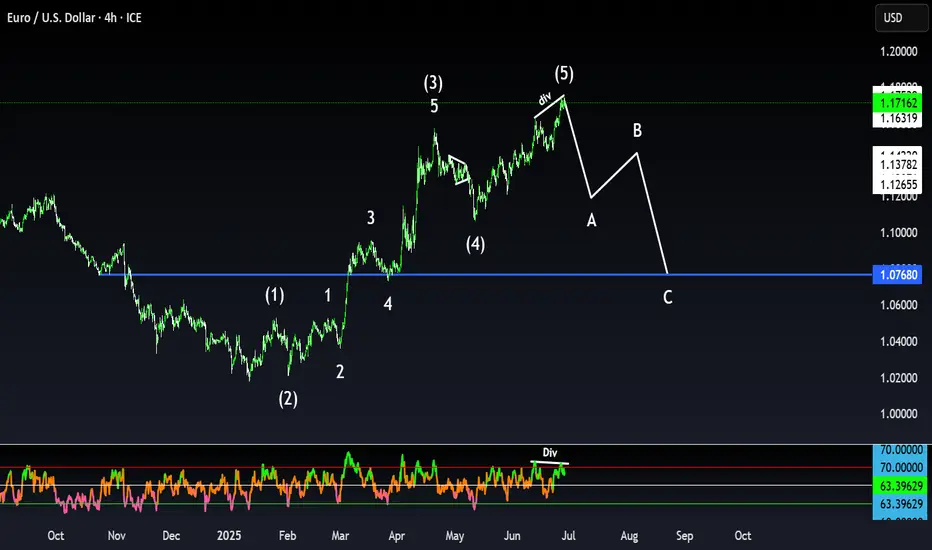
📈 Chart Breakdown
🔢 Elliott Impulse Wave Completed:
Waves (1) to (5) appear to form a clean 5-wave impulse structure upward.
Final wave (5) is diverging on the oscillator (RSI), signaling potential bullish exhaustion.
🧾 ABC Correction Expected:
After the 5-wave impulse, you project an ABC corrective move:
Wave A: initial drop
Wave B: partial recovery
Wave C: deeper move likely toward the 1.07680 support (blue horizontal line)
⚠️ Bearish RSI Divergence:
The label "Div" confirms bearish divergence between price and RSI → typical at end of Wave (5).
🧠 Summary:
Structure: 5-wave impulse + projected 3-wave correction
Bias: Short-term bearish targeting 1.07680
Confirmation: Look for break below support or trendline + momentum shift
BTC - Will the Bears finally get their chance?Buy Side Liquidity Sweep in Progress
Price is currently climbing toward a region densely packed with resting buy side liquidity, marked by multiple previous highs. The area around 108,900 to 111,000 is especially significant, with two clear liquidity pools stacked above recent swing highs. These levels are likely to attract price as market participants seek to trigger stop orders and induce fresh buying interest—setting the stage for a potential reversal.
Weakness in the Current Impulse
The recent rally has advanced with minimal retracement and virtually no visible Gaps. This lack of corrective structure often indicates imbalance and suggests the move is overextended. When price moves upward too cleanly, it tends to leave behind thin liquidity zones, making the entire leg vulnerable to a sharper correction once exhaustion sets in.
Fair Value Gap as a Draw Below
Below current price lies a prominent bullish Fair Value Gap around 104,000. This inefficiency was left unfilled during the last leg up and may now serve as a magnet for price. These types of Gaps are often revisited by the market in an effort to rebalance supply and demand, especially after aggressive moves that break structure to the upside.
Once the higher liquidity levels are swept, watch for a clear reaction—either a strong rejection or lower timeframe structure shift—which could signal that the top is in. If that shift materializes, price may begin a downward leg targeting the unfilled Gap below. The magnitude of the move, combined with the lack of structure on the way up, leaves plenty of room for corrective action.
For those looking to engage, waiting for confirmation on a lower timeframe—such as a break of short-term bullish structure or the formation of a bearish Gap—can help time entries more precisely. In setups like these, patience is key: let the Sweep play out, observe how price reacts, and only then consider stepping in.

EURUSD Will Collapse! SELL!
My dear subscribers,
My technical analysis for EURUSD is below:
The price is coiling around a solid key level - 1.1716
Bias - Bearish
Technical Indicators: Pivot Points Low anticipates a potential price reversal.
Super trend shows a clear sell, giving a perfect indicators' convergence.
Goal - 1.1644
About Used Indicators:
By the very nature of the supertrend indicator, it offers firm support and resistance levels for traders to enter and exit trades. Additionally, it also provides signals for setting stop losses
Disclosure: I am part of Trade Nation's Influencer program and receive a monthly fee for using their TradingView charts in my analysis.
———————————
WISH YOU ALL LUCK
Soybeans Crashing Into Demand — Reversal Coming or Trap?1. COT REPORT — Updated June 17, 2025
📌 Non-Commercials (Speculators)
Long: +5,661 → 195,984
Short: -9,226 → 110,761
✅ Net Long Increase: A clear bullish shift in speculative positioning (+14,887 net contracts). This is an early indication of a sentiment reversal.
📌 Commercials (Hedgers / Producers)
Long: +6,023
Short: -5,806
➡️ The decrease in net shorts suggests improving confidence among institutional players.
📌 Total Open Interest: 846,169 (down by 12,776)
❗ This slight drop may be linked to position rotation or partial profit-taking.
2. NET POSITIONS CHART INSIGHT
Commercial traders remain structurally net short, but their exposure has been gradually declining since March.
Non-commercial traders have increased their net long positions since April, aligned with the price's technical recovery.
The current price is trading near the historical mean, indicating neutral conditions with potential room for further upside.
🕰️ 3. SEASONALITY OUTLOOK
The June–July period has historically been bearish:
June Average Performance:
Last 5 years: -39.61
Last 2 years: -38.71
July Average Performance:
Last 20 years: -44.82
Last 2 years: -34.73
📉 August and September typically continue this seasonal downtrend.
🟨 Caution is advised on initiating long positions during this phase.
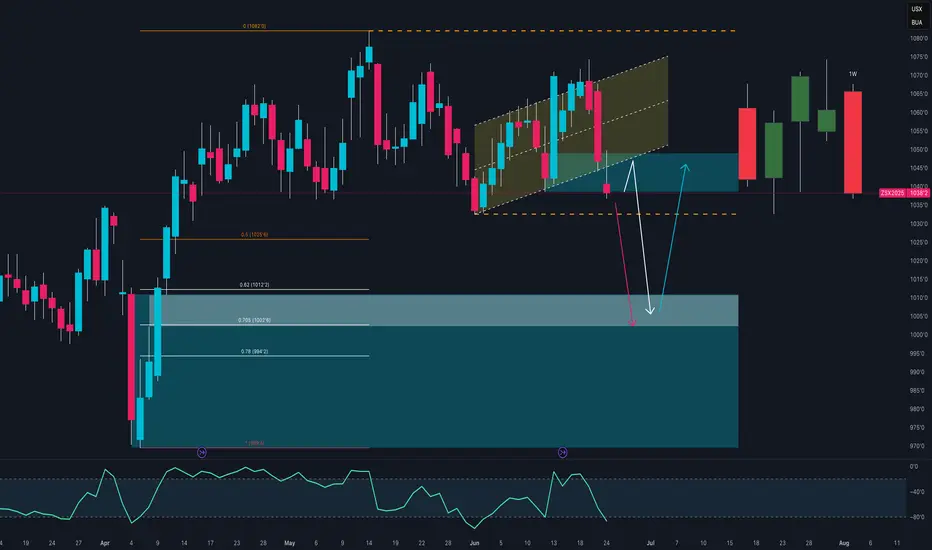
📊 4. TECHNICAL OUTLOOK —
Current Structure:
Rising channel has broken to the downside with a strong bearish impulse candle.
RSI is neutral but previously showed bearish divergence.
Key Support Zones:
1035–1025: Intermediate support area already tested.
1012–994: Golden Pocket aligned with a demand block — likely target zone with high potential for reaction.
Possible Scenarios:
🔴 Bearish Continuation: A retracement followed by a move down into the 994–1000 range, where a tactical long setup may emerge.
🔵 Bull Trap and Reversal: A rapid recovery above 1050, potentially triggering a continuation to 1080 (range top).
5. EXECUTION SUMMARY
Primary Bias: Bearish in the short term
🎯 Target Zone: 994–1000
🛑 Invalidation Level: Weekly close above 1055
Tactical Long Setup: Monitor price action at 994–1000 for bullish reaction.
Macro context and speculative positioning suggest a structural bottom may develop in Q3 2025, but current conditions are not yet favorable for a full swing position.
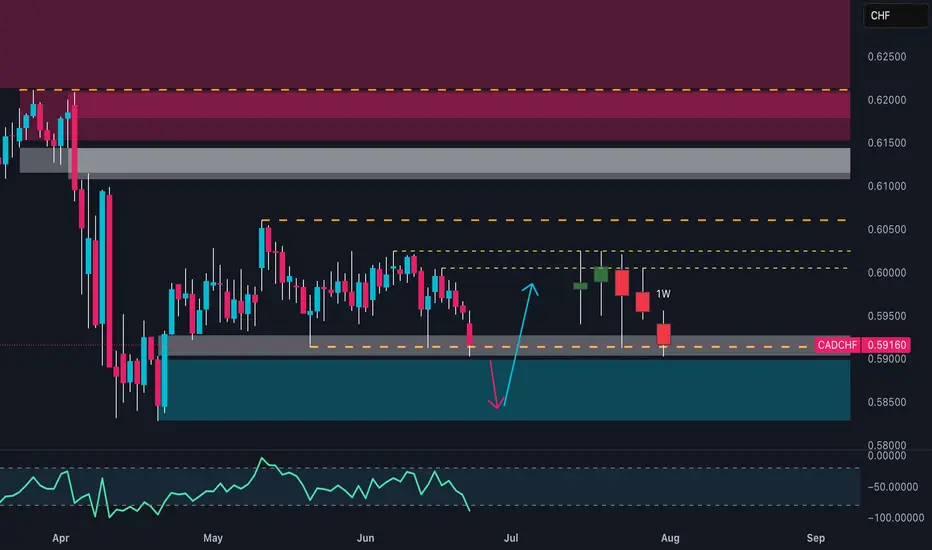
CADCHF at the Cliff's Edge – Is a Breakdown Imminent? 🧭 Technical Context
Price is currently sitting at the key support area of 0.5890–0.5900, tested multiple times since April.
This week’s candlestick shows a clear close below the intermediate micro-structure (two consecutive closes under recent lows), confirming bearish pressure.
The weekly RSI remains in a neutral-to-low zone, trending downwards with no active bullish divergence.
📉 Technical Conclusion: Active bearish bias. Watch out for potential false breaks below 0.5890 as liquidity traps.
📊 COT Report – as of June 17, 2025
🇨🇦 CAD
Non-Commercials: added +8.5k long contracts, aggressively cut −18.3k shorts
→ Excessive optimism, potential exhaustion on the buy-side
Commercials: added +31k shorts
→ Typical hedge behavior – signaling protection from CAD devaluation
🇨🇭CHF
Net positions in gradual decline with no sharp moves → CHF remains in consolidation, with a defensive tone
Open Interest dropped by −19.5k → Institutional money exiting positions
→ Interpretation: Market likely preparing for a directional breakout, CHF could act as a safe haven
📉 COT Conclusion: CAD appears overbought, CHF still gathering strength. Bearish bias on CADCHF remains intact.
📅 Seasonality – June Pattern
CHF tends to strengthen in June:
+0.0095 (10Y average), +0.0068 (5Y average)
CAD shows structural weakness in June:
−0.0027 (10Y), −0.0076 (5Y)
📉 Seasonality Conclusion: June favors CAD weakness and CHF strength → Bearish confirmation for CADCHF
🧠 Retail Sentiment
92% of retail traders are long CADCHF, only 8% are short
→ Extreme imbalance = classic contrarian signal
📉 Sentiment Conclusion: Confirms potential for continued downside on CADCHF
✅ Trade Plan Summary
📌 Base scenario:
Short CADCHF if we get a daily/weekly close below 0.5890
🎯 Target 1: 0.5820
🎯 Target 2: 0.5770
🚫 Invalidation: daily close above 0.5960 (invalidates current setup)
📌 Alternative scenario:
Short from 0.5960–0.6000 if we get a bearish rejection pattern → ideal for better R/R
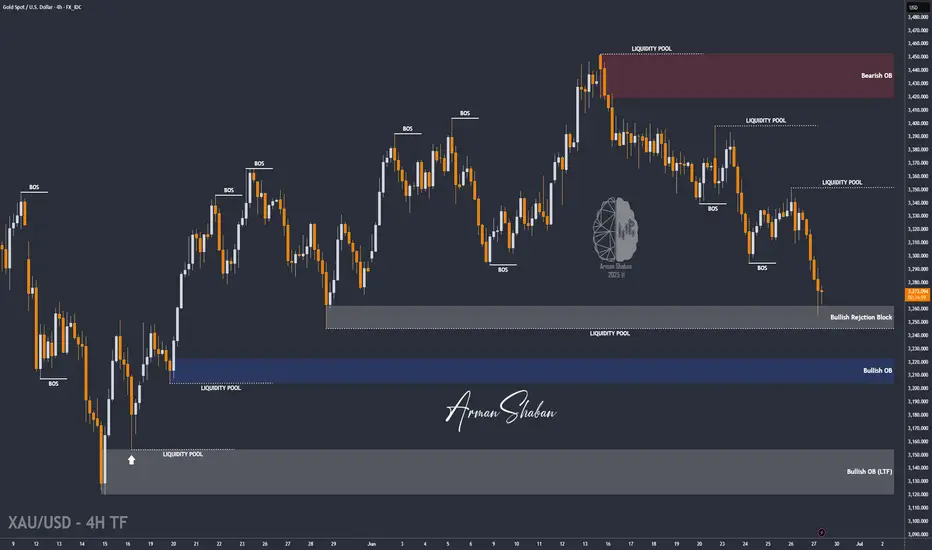
XAUUSD : Ready for More Upside Before Another Fall ?By analyzing the gold chart on the 4-hour timeframe, we can see that price initially followed our bullish scenario, climbing 140 pips up to $3336. However, after hitting that level, gold reversed and entered the bearish scenario, dropping below $3300 and eventually finding support around $3255.
This area acted as a strong demand zone, and we’ve since seen a rebound. Currently, gold is trading around $3273, and as long as price holds above the marked demand zone (Bullish Rejection Block), we may expect another bullish move before price potentially targets the liquidity below $3245 and $3203.
Please support me with your likes and comments to motivate me to share more analysis with you and share your opinion about the possible trend of this chart with me !
Best Regards , Arman Shaban
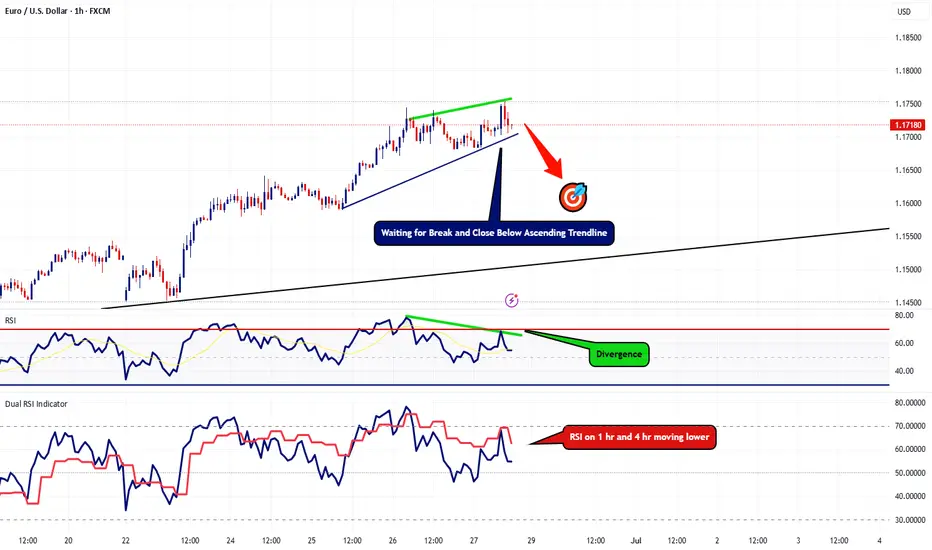
EURUSD Lots of Bearish Clues Popping UpThis is an update to my last post, I'm still waiting for that 4hr candle to close below the last. However, now I'm starting to spot more bearish indications on the 1hr timeframe.
First thing I'm noticing is the RSI divergence show that the bullish strength is weakening. RSI on the 4hr + the 1hr are heading lower. Now I'm still waiting for that 4 hour to close below the last but I also want to see this ascending trendline break and hold below as well.
In the event we break below this trendline, I'll be looking to go short with my target plotted on the chart.