EUR_USD RISING SUPPORT AHEAD|LONG|
✅EUR_USD is trading along the rising support
And as the pair will soon retest it
I am expecting the price to go up
To retest the supply levels above at 1.1511
LONG🚀
✅Like and subscribe to never miss a new idea!✅
Disclosure: I am part of Trade Nation's Influencer program and receive a monthly fee for using their TradingView charts in my analysis.
Eurusd-4
GBP/JPY in Trouble? Smart Money Rotates Into Yen📊 1. COT Analysis
JPY (Japanese Yen):
Non-Commercial Net Long: +54,615 – showing strong long accumulation since March.
Recent Changes:
Long: -5,319
Short: +1,235
➡️ Mixed signals short-term, but overall net long positioning remains strong. Speculative funds are still heavily favoring the Yen, suggesting potential continued strength.
GBP (British Pound):
Non-Commercial Net Long: +51,634 (111,076 long – 59,442 short)
Recent Changes:
Long: +7,404
Short: -9,015
➡️ Specs are still net long on GBP, but exposure has slightly decreased. The divergence with the Yen is narrowing.
🔎 COT Summary:
Both currencies are being bought by speculators, but the JPY has shown more consistent long-term positioning. Net momentum appears to shift in favor of Yen strength, pointing to potential downside for GBP/JPY.
📅 2. Seasonality – June
Historically, June is a weak month for GBP/JPY, especially over 20y, 15y, 5y, and 2y windows.
Monthly average return is negative across all major historical timeframes (e.g. -1.2415 over 10 years).
➡️ Seasonality reinforces a bearish bias for June.
🧠 3. Retail Sentiment
Short: 52%
Long: 48%
➡️ Retail positioning is balanced, slightly skewed short. Not a strong contrarian signal, but also doesn’t support a bullish breakout scenario.
📉 4. Technical Analysis
Current Structure: Ascending channel from mid-May → currently testing lower boundary.
Key Zone: 195.600–196.520 is a major supply zone with multiple rejections.
Recent Candle Action: Bearish pin bar + engulfing candle → strong rejection from resistance.
Downside Targets:
First: 193.076
Second: 191.439
Break of the channel would further confirm a trend reversal.
➡️ Price action supports a short scenario with high reward-to-risk toward lower zones.

CADJPY Bearish Reversal? Smart Money + Seasonal Confluence🧠 COT Sentiment
Speculators are heavily net short on CAD (–93K), while maintaining a strong net long position on JPY (+144K).
→ This positioning clearly favors JPY strength over CAD weakness.
Commercials are hedging JPY downside, but the dominant flow remains JPY bullish.
📅 Seasonal Patterns
Historically, June is weak for CAD (5Y, 10Y, 15Y averages all negative).
Meanwhile, JPY tends to strengthen in the second half of June.
→ Seasonality supports a bearish outlook on the pair.
📉 Technical Structure
Price has reacted precisely to the Fibonacci 0.705 retracement (106.23) and is showing signs of RSI divergence.
We are trading within a key supply zone between 106.70 and 108.30, which also aligns with a major resistance cluster and harmonic extension.
First target sits at 103.88, with potential extension to 101.20 if breakdown confirms.
🛢 Macro Catalyst
Oil remains under pressure.
CAD retail sales dropped significantly.
Risk-off sentiment (cautious Fed + geopolitical tensions) favors JPY as a safe haven.
📊 Retail Sentiment
62% of retail traders are short, but with an average entry at 108.49.
→ A break below 106 could trigger liquidation, fueling further downside.
🧩 Trade Setup
🔹 Entry zone: 106.70–107.00
🔸 SL: Above 108.40 (invalidates the bearish thesis)
🎯 TP1: 103.88 (S/R retest)
🎯 TP2: 101.20 (extended target on risk aversion)
🧭 Synthesis
Every angle aligns toward a potential bearish reversal on CAD/JPY:
✅ COT positioning
✅ Seasonality
✅ Macro narrative
✅ Technical confluence
✅ Retail sentiment trap

EURJPY Just Broke Out – Is This the Start of a Summer Rally?📊 1. COT Report – Euro & Yen
EUR (Euro FX – CME):
Non-Commercials:
Long: +5,968 | Short: -4,293 → Net Long increasing
Commercials:
Long: +11,480 | Short: +24,451 → Net Short
→ Speculators are clearly bullish on the euro.
JPY (Japanese Yen – CME):
Non-Commercials:
Long: -5,319 | Short: +1,235 → Net Long decreasing
Commercials:
Long: +31,893 | Short: +25,462 → Hedging, but still net short
→ The yen continues to be sold, especially by institutional players.
📌 EUR/JPY COT Summary:
Speculators are buying EUR and selling JPY → strong bullish bias on EUR/JPY.
🧠 2. Retail Sentiment
80% of retail traders are short EUR/JPY, with an average entry at 161.50
Current price is around 167.20 → retail is heavily underwater
✅ Strong contrarian bullish signal
📉 3. Technical Analysis
Price broke out of a long-term range, printing new yearly highs
RSI is overbought but with no active bearish divergence
Price sits inside a major supply zone between 166.50 and 168.00, where previous rejections occurred
A potential pullback to the 164.60–164.15 area aligns with ascending trendline support
🟡 Likely Scenario:
A healthy technical pullback to 164.50–165.00 to cool off RSI,
followed by a continuation higher if supported by momentum and COT positioning
📅 4. Seasonality
June is historically a bullish month for EUR/JPY:
5-year avg: +1.167%
2-year avg: +2.41%
→ Seasonality supports more upside into early July
🌍 5. Macro Context
BoJ remains dovish, no sign of imminent tightening
ECB is steady but relatively less dovish → rate differential still favors the euro
No signs yet of verbal intervention from Japan.
Smart Money Just Flipped Bearish on USD/CAD. Are You Still Long?🧠 1. COT Context & Institutional Flows
🇨🇦 CAD COT Report (CME) – June 10, 2025
Non-Commercials (speculators): net short 93,143 contracts (19,651 long vs. 112,794 short), with a short reduction of -14,319 → early bearish unwinding.
Commercials: net long 91,207 contracts (223,285 long vs. 132,078 short), with strong accumulation (+27,999 longs).
🔄 Net open interest change: +18,436 → renewed institutional interest on the long CAD side.
🇺🇸 USD Index COT Report (ICE) – June 10, 2025
Non-Commercials: net long 1,402 contracts (17,027 long vs. 15,625 short), with a +1,279 increase in longs → modest USD support.
Commercials remain net short -35 contracts, no clear shift.
🔄 Total open interest +2,652 → mild bullish interest in USD.
📌 Implication: Strong institutional support for CAD, USD mildly supported. Net positioning favors downside pressure on USD/CAD.
💹 2. Technical Analysis & Price Action
Primary trend: clearly bearish from the 1.38 zone.
Current price: 1.3552, testing a macro demand zone (1.3470–1.3540).
Daily RSI remains deeply oversold → possible technical bounce, but no reversal structure confirmed.
Recent candles show lower highs and lower lows, with no bullish momentum.
📌 Implication: The bearish trend remains in control. A technical rebound is possible, but bias stays short as long as price trades below 1.3640.
📈 3. Retail Sentiment
77% of retail traders are long USD/CAD, with an average entry at 1.3646.
Only 23% are short, positioned better at 1.3790.
📌 Implication: Retail is heavily long → contrarian bearish signal confirmed.
📊 4. Seasonality
June is historically weak for USD/CAD:
5Y Avg: -0.0118
2Y Avg: -0.0081
The June seasonal curve shows a stronger downside acceleration into the second half of the month.
📌 Implication: Seasonality adds downward pressure into month-end.
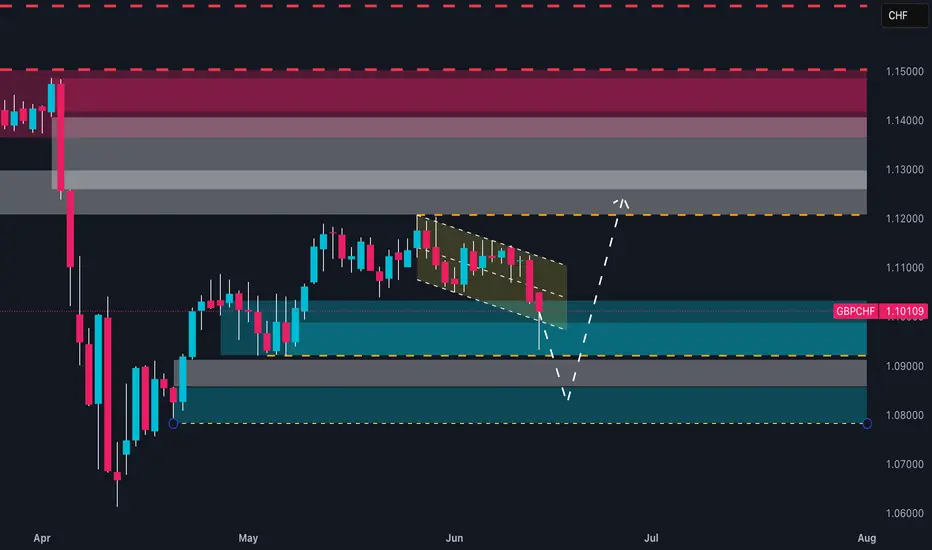
Retail is 86% Long on GBPCHF… But Smart Money Is Setting a Trap📊 1. RETAIL SENTIMENT
Long Positions: 86% – Average Entry: 1.1196
Short Positions: 14% – Average Entry: 1.0999
Current Price: 1.1010
Analysis:
Retail positioning is heavily skewed towards longs, with the average long entry significantly above the current market price. This creates vulnerability to downside pressure through stop-loss hunting or a bearish squeeze. Such extreme retail bias often acts as a contrarian signal: smart money may continue pushing the price lower to flush out retail traders before any meaningful reversal occurs.
🧾 2. COMMITMENTS OF TRADERS – COT REPORT (June 10, 2025)
🔹 British Pound (GBP)
Non-Commercials (Speculators): Net Long increasing by +7.4K → now at +51.6K
Commercials (Hedgers): Net Short decreasing by -13.9K → now at -60.5K
Total Open Interest: Decreased by -19K
Interpretation:
Speculators are maintaining strong long exposure on GBP, while commercials are covering some shorts—potentially signaling a short-term pause in bullish momentum. However, the drop in overall open interest suggests possible consolidation or short-term uncertainty.
🔹 Swiss Franc (CHF)
Non-Commercials: Net Shorts reduced by -2.7K
Commercials: Net Longs increased by +2.5K
Total Open Interest: Increased by +5.6K
Interpretation:
The CHF is gaining strength. Commercial participants are increasing their long exposure while speculators reduce their shorts—this positive divergence supports a bullish outlook on CHF, especially against retail-heavy long pairs like GBP.
📈 3. CHF SEASONALITY – JUNE
Average CHF Performance in June:
20-Year Avg: +0.0099
15-Year Avg: +0.0138
10-Year Avg: +0.0099
5-Year Avg: +0.0039
Analysis:
Historically, June is a seasonally strong month for the Swiss Franc. This seasonal bias aligns with current macro conditions, reinforcing the bullish case for CHF.
📊 4. TECHNICAL ANALYSIS (Daily Chart)
Pattern: Descending channel with a recent false breakdown and re-entry
Key Support Zone: 1.0980–1.1000 → tested and defended with a bullish wick
Target Resistance: 1.1170–1.1200 → prior retail cluster, supply zone, and average long entry
Scenario: A confirmed breakout of the channel could trigger a short squeeze toward 1.1170–1.1200
📌 STRATEGIC OUTLOOK
The current GBP/CHF setup is technically and sentimentally delicate. The price sits on a major daily demand zone, while sentiment and macro flows suggest downside pressure remains in play—but also allow room for a potential contrarian rally (short squeeze).
👉 Action Plan:
Wait for intraday/daily confirmation:
Go long above 1.1045 (breakout confirmation) → target 1.1170
Go short below 1.0980 (bearish continuation) → target 1.0860
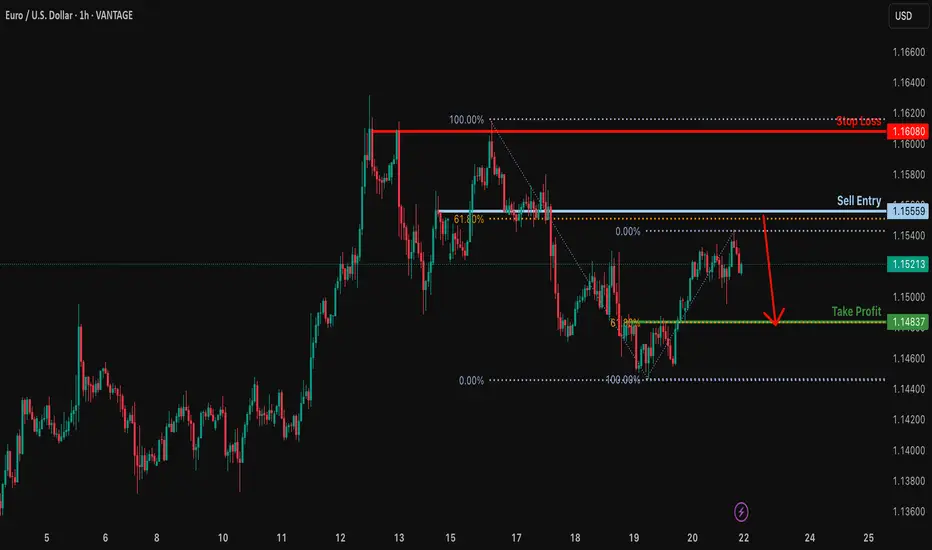
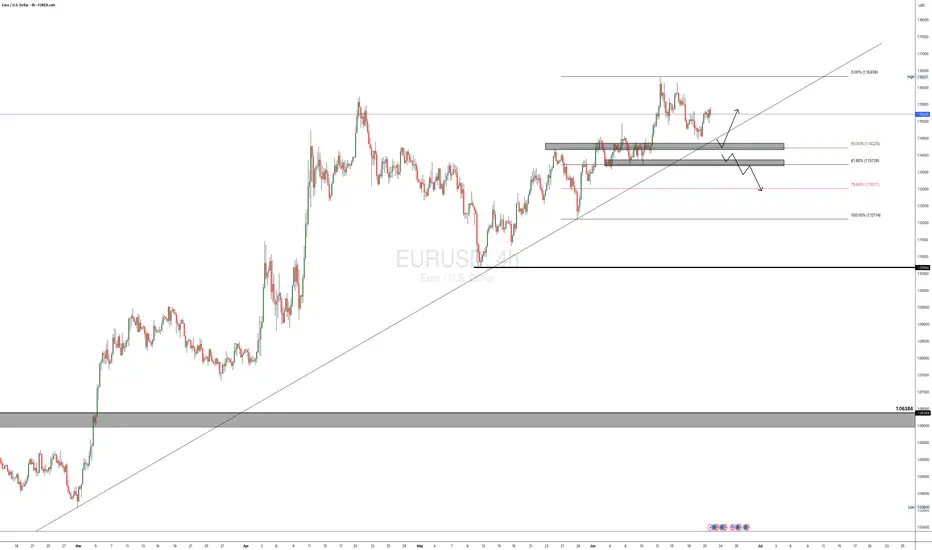
Bearish reversal?EUR/USD is rising towards the resistance level which is a pullback resistance that lines up with the 61.8% Fibonacci retracement and could reverse from this level to our take profit.
Entry: 1.1555
Why we like it:
There is a pullback resistance that lines up with the 61.8% Fibonacci retracement.
Stop loss: 1.1608
Why we like it:
There is a pullback resistance.
Take profit: 1.1483
Why we like it:
There is a pullback support level that aligns with the 61.8% Fibonacci retracement.
Enjoying your TradingView experience? Review us!
Please be advised that the information presented on TradingView is provided to Vantage (‘Vantage Global Limited’, ‘we’) by a third-party provider (‘Everest Fortune Group’). Please be reminded that you are solely responsible for the trading decisions on your account. There is a very high degree of risk involved in trading. Any information and/or content is intended entirely for research, educational and informational purposes only and does not constitute investment or consultation advice or investment strategy. The information is not tailored to the investment needs of any specific person and therefore does not involve a consideration of any of the investment objectives, financial situation or needs of any viewer that may receive it. Kindly also note that past performance is not a reliable indicator of future results. Actual results may differ materially from those anticipated in forward-looking or past performance statements. We assume no liability as to the accuracy or completeness of any of the information and/or content provided herein and the Company cannot be held responsible for any omission, mistake nor for any loss or damage including without limitation to any loss of profit which may arise from reliance on any information supplied by Everest Fortune Group.
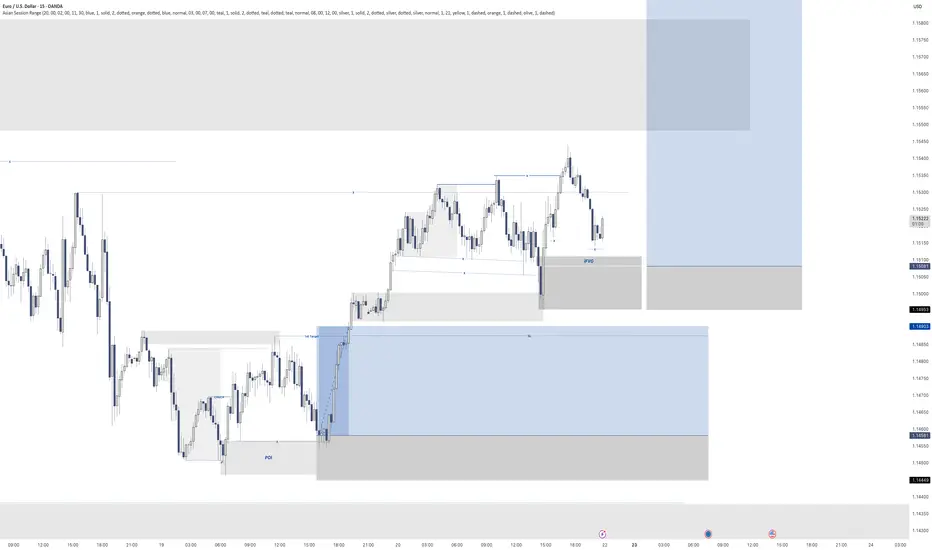
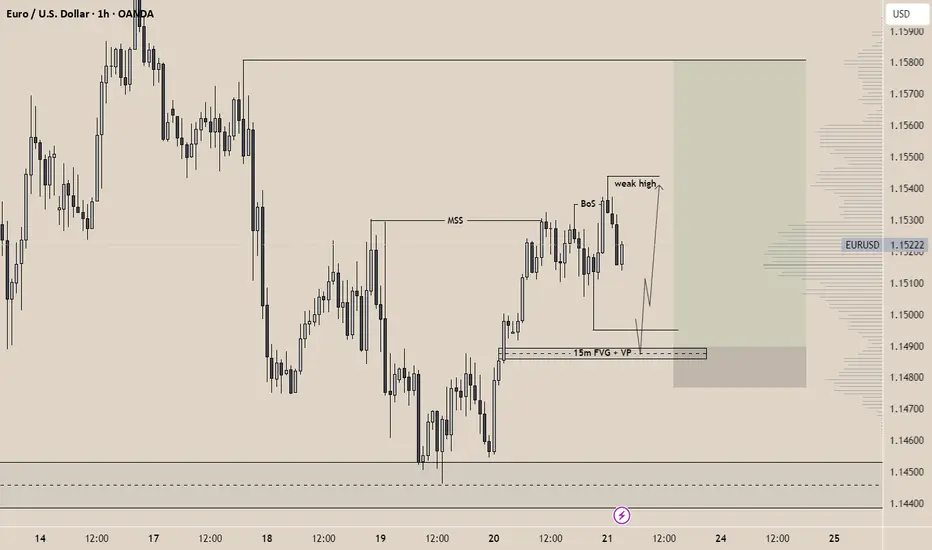
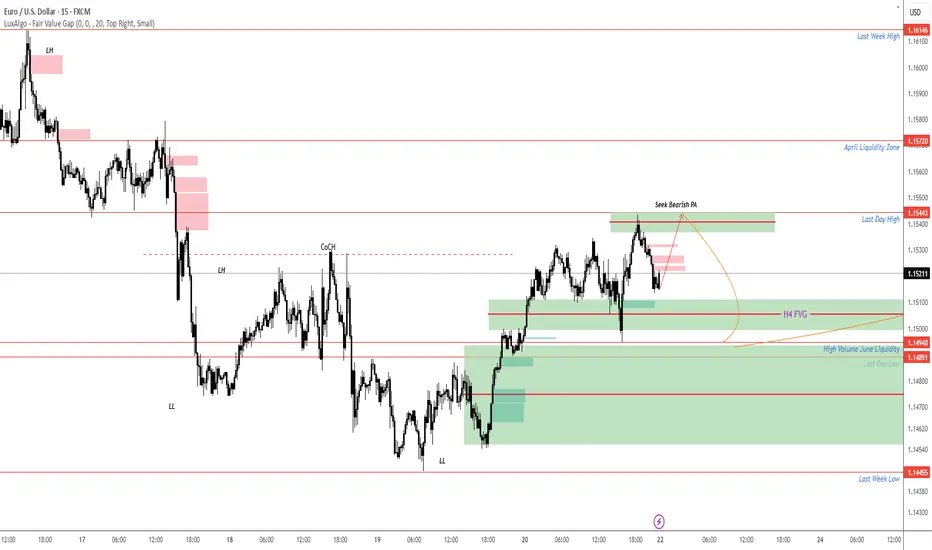
EURUSD -> Bullish Idea 22/06/2025(ICT x Volume Profile)OANDA:EURUSD 🎯 Bias: Bullish
🕒 Timeframe: H1 primary, H15 confirmation
Happy sunday traders!
Following President Trump’s strikes on Iran, I expect an initial bearish reaction in the Asian and London Sessions, then a bullish reaction in the NY sessions as sellers push the USD lower. However, the prevailing trend context remains bullish: the hourly chart has shifted structure (MSS) and broke structure to the upside. I anticipate a liquidity sweep below the recent lows, before a retracement into the 15-minute fair value gap (FVG) which aligns with the volume profile, then continuation higher to target the weak high and into the swing highs marked.
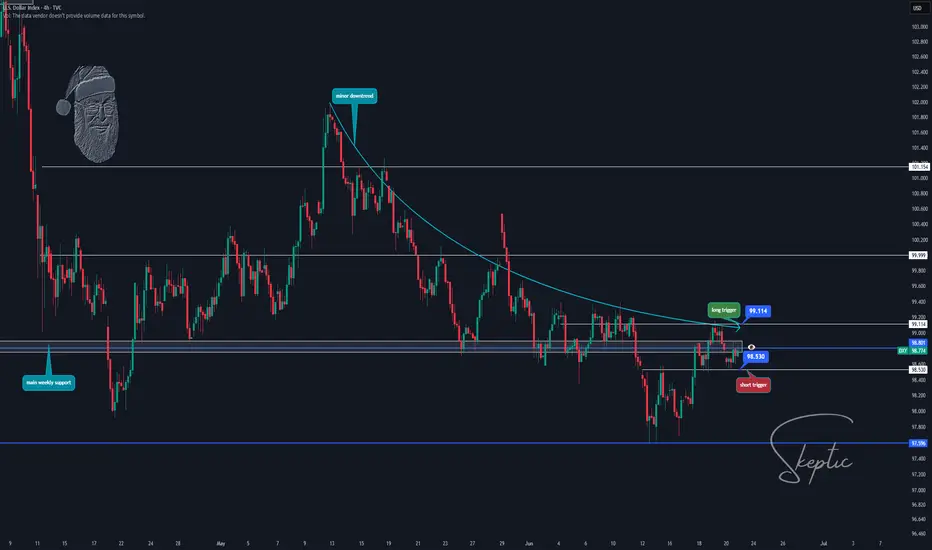
Skeptic | Weekly Watchlist Top Triggers for Forex, Gold & More!DXY: The Market’s Compass
Let’s kick it off with DXY—the Dollar Index every trader needs to watch to get the market’s big picture.
Daily Timeframe: After a failed break below the critical support at 98.801 , DXY dumped to 97.596 , then pulled back to test 98.801 . With rate cuts looking likely soon , I’m betting on more downside for DXY. The only wildcard? Rising Middle East tensions could spike inflation, push rates higher, and strengthen DXY, hammering crypto and CFD indices.
4-Hour Triggers:
Short: Break below 98.530 —a clean setup to ride down to 97.596 . I’m leaning heavier on this, pairing it with USD-based forex trades for max R/R. 😤
Long: Break above 99.114 —riskier against the trend, so keep stops tight and profits quick.
Pro Tip: Shorts are the safer play here, but watch geopolitical news for sudden reversals.
EURX: Uptrend Power
EURX is flexing some muscle.
Weekly Timeframe: The resistance at 1072.6 looks broken. If we avoid a fakeout and hold above this zone, I’m expecting the major uptrend to keep rolling.
Game Plan: No trigger needed—just confirm a few 4-hour candles above 1072.6, and I’m opening longs on EUR-based pairs. Patience for confirmation is key! 🙌
Pro Tip: Watch for fake breakouts—let the market prove itself before jumping in.
Commodities: Gold & Silver
XAU/USD (Gold)
My gold analysis from last week still holds ( check it if you missed it—it’s got Middle East war scenarios and Bitcoin insights too ). No need to repeat—go read it for the full scoop! 📚
XAG/USD (Silver)
Silver’s been on a wild ride after a massive pump.
4-Hour Timeframe : We’re now in a 4-hour range, which makes sense, and I expect it to linger into next week.
Triggers:
Long: Break above resistance at 37.31559 .
Short: Break below support at 35.56800 .
Pro Tip: If you’re holding my 33.68317 long from last week, don’t close yet—let it ride for more gains. If you’re not in, avoid FOMO and wait for the range break. 😎
Forex Pairs
EUR/USD: Ready to Pop
With EURX in an uptrend and DXY likely breaking support, I’m super bullish on EUR/USD next week.
4-Hour Triggers:
Long: Break above resistance at 1.15429 . No need for RSI or SMA confirmation—just a clean breakout, and we’re in. 🚀
Short: Break below 1.13566—only if EURX’s 1072.6 break turns out to be a fakeout.
Pro Tip: Longs are the play here—keep it simple and ride the breakout wave.
GBP/USD: Bearish Break
GBP/USD is looking spicy after a downward move.
Daily Timeframe: The upward channel broke to the downside. I cloned the channel and placed it below—support at 1.34090 is massive, with multiple reactions in the past.
4-Hour Trigger: Break below 1.34090 opens a bearish move with high R/R. I’m personally shorting this break. 😤
Pro Tip: This is a key level—set alerts and don’t miss it!
USD/JPY: Range Game
USD/JPY is stuck in a long 4-hour box range.
4-Hour Timeframe: Price keeps testing the ceiling but travels less toward the floor, showing traders want to break up, not down.
Triggers:
Long: Break above ceiling at 146.204.
Short: Break below the upward trendline, then support at 145.194 .
Pro Tip: Longs have more juice—watch for volume on the break.
EUR/CHF: Mirror of USD/JPY
EUR/CHF is vibing like USD/JPY—a 4-hour box range.
4-Hour Triggers:
Long: Break above resistance at 0.94293 .
Short: Break below channel floor at 0.92963 .
Pro Tip: Wait for a clean break—ranges can be choppy!
Final Vibe Check
That’s your Weekly Watchlist , fam! I’ll keep you updated daily as markets shift. Stay safe with capital management—max 1% risk per trade, no excuses. This week’s loaded with banger triggers, so sit down now, analyze, and set your alerts so you don’t miss a single move. Let’s make it a profitable week! 🚨
💬 Let’s Talk!
If this watchlist got you hyped, smash that boost—it means the world! 😊 Got a pair or setup you want me to hit next? Drop it in the comments. Thanks for rolling with me—keep trading sharp! ✌️
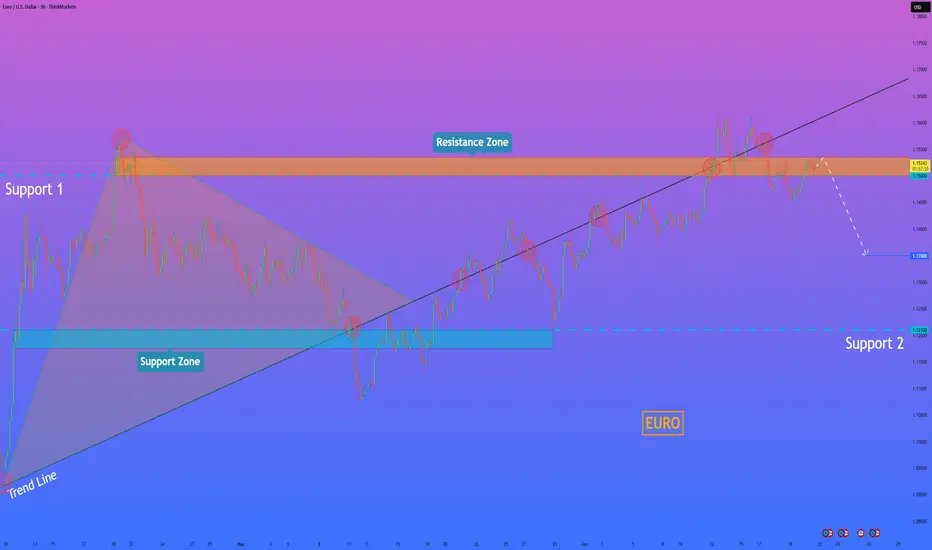
HelenP. I Euro will break resistance level and continue to fallHi folks today I'm prepared for you Euro analytics. On this chart, we can see how price initially moved inside a triangle formation, forming higher lows from the trend line and testing the resistance zone multiple times. Eventually, price broke out to the downside, falling sharply and breaking through the lower boundary of the triangle and also the trend line, signaling a shift in market sentiment. After touching the support zone and forming a temporary bottom, the pair started climbing back up, but this movement was more of a correction than a trend reversal. Price respected the trend line from below and followed it upward, but failed to break significantly higher. It managed to push above both support 2 and support 1 levels, which now act as resistance. Currently, EURUSD is trading inside the resistance zone, where previous reactions have led to strong bearish impulses. Given this behavior and the recent false breakout, I expect the price to rebound from this area and break back below support. My goal is set at 1.1350, anticipating further downside movement as the bearish structure remains valid. If you like my analytics you may support me with your like/comment ❤️
Disclaimer: As part of ThinkMarkets’ Influencer Program, I am sponsored to share and publish their charts in my analysis.
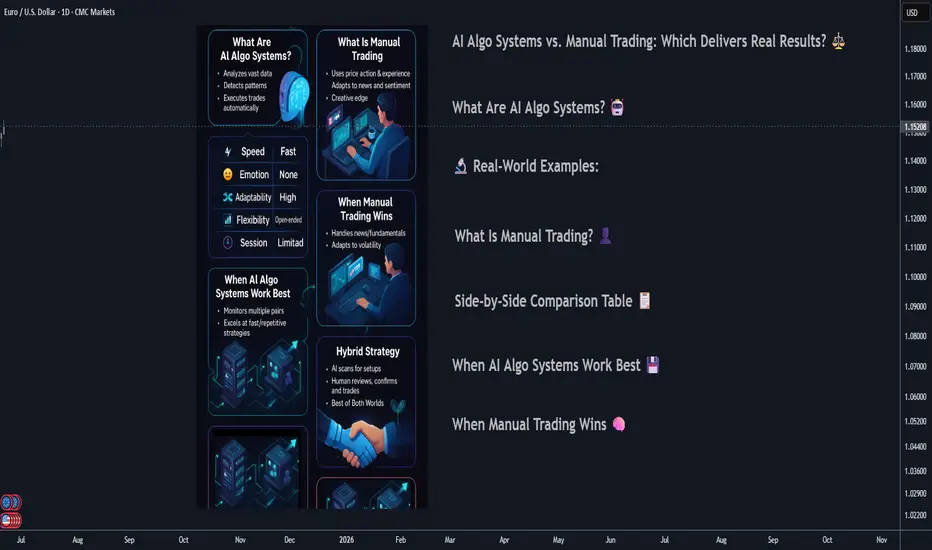
AI Algo Systems vs. Manual Trading: Which Delivers Real Results?AI Algo Systems vs. Manual Trading: Which Delivers Real Results? ⚖️
________________________________________
Introduction
With the explosive rise of artificial intelligence (AI) in financial markets, traders everywhere are asking the million-dollar question:
Should I trust my trades to automation, or keep my hands on the wheel? 🧠🤖
This guide offers a real-world, side-by-side comparison between AI-powered algorithmic trading systems and traditional manual trading. We’ll highlight where each method dominates, when they fail, and how you can combine both to build a system that outperforms the rest. 💡
What Are AI Algo Systems? 🤖
AI trading systems use advanced machine learning models to:
• Analyze huge volumes of historical and real-time data 📈
• Detect patterns and trading opportunities faster than any human
• Automatically execute trades using coded logic, without emotion
🔬 Real-World Examples:
• Neural networks (LSTM, CNN): Predicting EUR/USD direction based on years of tick data
• Reinforcement learning agents: Managing position sizing dynamically in crypto scalping
• Predictive classifiers: Spotting likely trend reversals on S&P 500 based on 20+ indicators
Key Benefits:
• 🔄 Emotionless execution: No fear, no greed, just rules
• ⏱️ Lightning-fast trades: React to price action instantly
• 📊 Pattern recognition: Finds subtle correlations people miss
________________________________________
What Is Manual Trading? 👤
Manual trading is powered by human intelligence and judgment. Traders use:
• Price action and SMC/ICT techniques (e.g., order blocks, BOS)
• Fundamental analysis: News, sentiment, macro reports
• Intuition and experience: Reading between the lines the way only humans can
🧑💼 Real-World Examples:
• A trader spots an untested order block on GBP/JPY and waits for liquidity sweep before entering
• Reading a dovish tone in FOMC minutes and fading the initial spike on DXY
• Using “market structure shifts” after a big news event to catch a reversal
Key Benefits:
• 🔍 Contextual awareness: Understand the full market story
• 🎯 Real-time adaptability: Adjust plans on the fly
• 🧠 Creative edge: Find setups no algorithm can code for
________________________________________
Side-by-Side Comparison Table 📋
Feature AI Algo Trading 🤖 Manual Trading 👤
Execution Speed Instant Slower, can lag
Emotions Involved None Prone to fear/greed
Adaptability Limited (needs retrain) High
Learning Curve High (coding/tech) Medium (market logic)
Strategy Flexibility Pre-coded only Unlimited creativity
Backtesting Automated Manual/semi-auto
Session Monitoring 24/5 via server Human-limited hours
________________________________________
When AI Algo Systems Work Best 💾
AI is unbeatable when you need:
• Scalability: Watching 10, 20, or even 100+ pairs 24/5
• High-frequency execution: Entering/exiting trades within milliseconds
• Repetitive strategies: Like mean reversion, breakout scalps, or arbitrage
📈 Example:
• Strategy: EUR/USD London open breakout
• Process: AI model detects volume and volatility spike, enters trade with 0.3% risk, targets FVG
• Results: 60% win rate, 1.8R average reward over 3 months
________________________________________
When Manual Trading Wins 🧠
Manual skills shine when you need:
• Discretionary entries: Especially with complex SMC/ICT structures
• Adapting to breaking news: Sudden CPI, FOMC shocks, geopolitical headlines
• Making sense of market narrative: When volatility is off the charts and AI gets confused
🗞️ Example:
• News: Surprise ECB rate hike
• Setup: Price sweeps liquidity and forms new order block
• Action: Trader enters based on confluence of structure, sentiment, and news
• Why AI fails: Model trained on normal volatility might get stopped out or miss entry entirely
________________________________________
Hybrid Strategy: The Best of Both Worlds 🌐
Elite traders combine the power of AI with human oversight.
Hybrid Workflow:
1. AI scans markets: Flags setups (order blocks, FVGs, volume spikes)
2. You review: Confirm bias with news, sentiment, or higher time frame
3. Entry:
o Manual (you pull the trigger)
o Semi-automated (AI suggests, you approve)
🔁 You save time, avoid missing setups, but keep critical discretion and control.
________________________________________
Risk Management: Algo vs. Manual 📊
AI:
• Stops, lot size, SL/TP are auto-calculated
• Consistent, never emotional
• Example: EA manages all USD pairs with 0.5% fixed risk per trade
Manual:
• Trader might override risk plan
• Discipline needed—easy to “revenge trade” after a loss
• Example: You up your risk size after a losing streak, breaking your rules
Best Practice:
📌 Let AI calculate risk size. Manually approve or override the entry. Double safety net.
________________________________________
Trader Case Study 👤
Name: Ray – $100K funded prop trader
Style: Hybrid (AI scanner + manual ICT confirmations)
Process:
• Sets HTF bias each morning
• AI scans for OB/BOS setups during NY session
• Manual review before entry
Performance:
• Win rate: 63%
• Avg R: 2.5
• Monthly gain: 9.7%
Ray’s Words:
“AI catches what I can’t see. I catch what it can’t understand.”
________________________________________
Mistakes to Avoid ❌
• 🚫 Blindly trusting black-box AI: Always verify signals
• 🚫 Micromanaging every tick: Let automation work, don’t over-interfere
• 🚫 Running AI during high-impact news: Most bots aren’t built for chaos
• 🚫 Ignoring psychology: Even if AI executes, your mindset impacts risk and management
________________________________________
Conclusion ✅
There’s no one-size-fits-all answer. The best traders in 2025 master both worlds. Here’s the winning formula:
• Harness AI’s speed and pattern recognition
• Lean on manual judgment for narrative and nuance
• Blend them with intention and structure for a trading system that’s fast, flexible, and resilient.
💥 Don’t pick sides. Master both.
That’s how the top 1% trade today—and win. 🚀⚙️📊
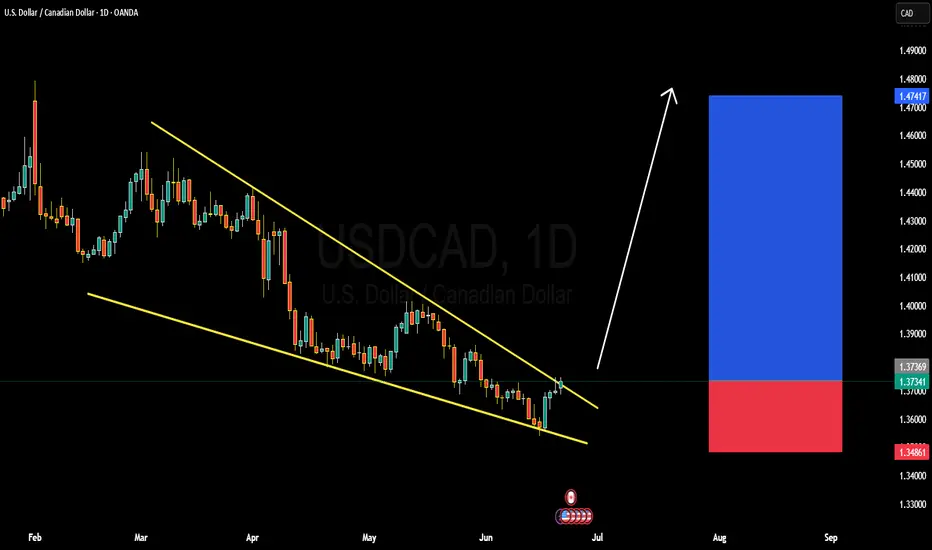
USDCAD DETAILED ANALYSISUSDCAD has formed a classic falling wedge pattern on the daily timeframe, with price currently pressing against the upper trendline resistance near 1.37300. This is a high-probability bullish reversal setup, and the pair is showing early signs of a potential breakout. The recent bullish momentum from the lows suggests buyers are stepping in aggressively, and if we get a strong daily close above the wedge, it could confirm the start of a new upward leg. My near-term target for this breakout is 1.47300, offering an excellent risk-reward profile.
From a fundamental perspective, the Canadian Dollar is currently under pressure due to weakening oil prices and softening domestic economic data. The Bank of Canada has recently signaled a dovish tilt following its latest rate cut in June, citing slower GDP growth and easing inflation. On the other hand, the US Dollar is finding renewed strength backed by sticky inflation and the Fed’s cautious stance on rate cuts. The divergence in monetary policy between the Fed and BoC is creating a favorable environment for USDCAD bulls.
Technically, the confluence of wedge resistance, bullish divergence on the RSI, and a clear higher low formation all point toward a breakout scenario. A break above 1.37600–1.38000 would unlock the next wave of bullish continuation, potentially accelerating momentum toward the 1.47 handle. This area also aligns with the previous March highs, making it a strong technical magnet.
I remain bullish on USDCAD and will be watching the breakout closely this week. If the pair holds above 1.36800 and breaks structure convincingly, I’ll be adding to longs on confirmation. The current setup presents a textbook breakout opportunity supported by strong fundamentals, technical structure, and market sentiment leaning in favor of the USD.
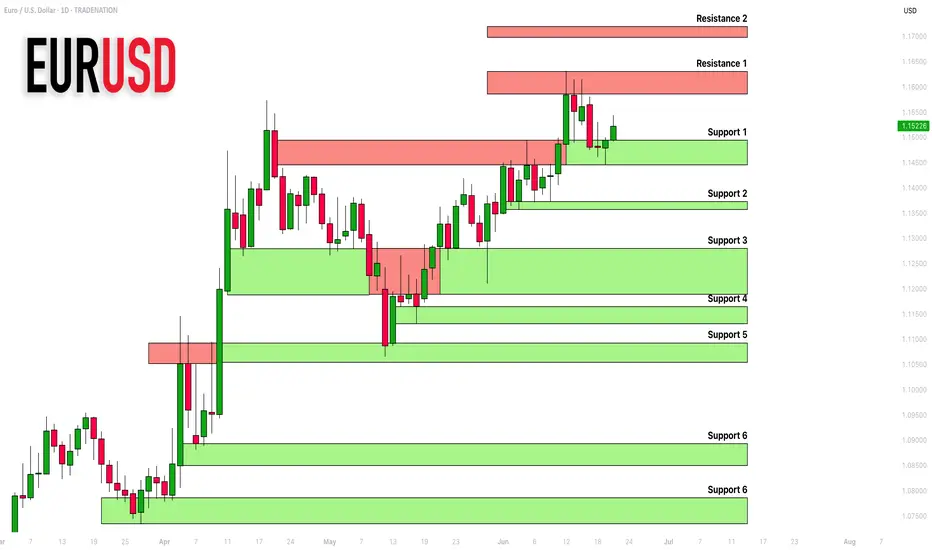
EURUSD: Important Supports & Resistances For Next Week 🇪🇺🇺🇸
Here is my latest structure analysis for EURUSD for next week.
Consider these supports and resistances for breakout/pullback trading.
❤️Please, support my work with like, thank you!❤️
I am part of Trade Nation's Influencer program and receive a monthly fee for using their TradingView charts in my analysis.
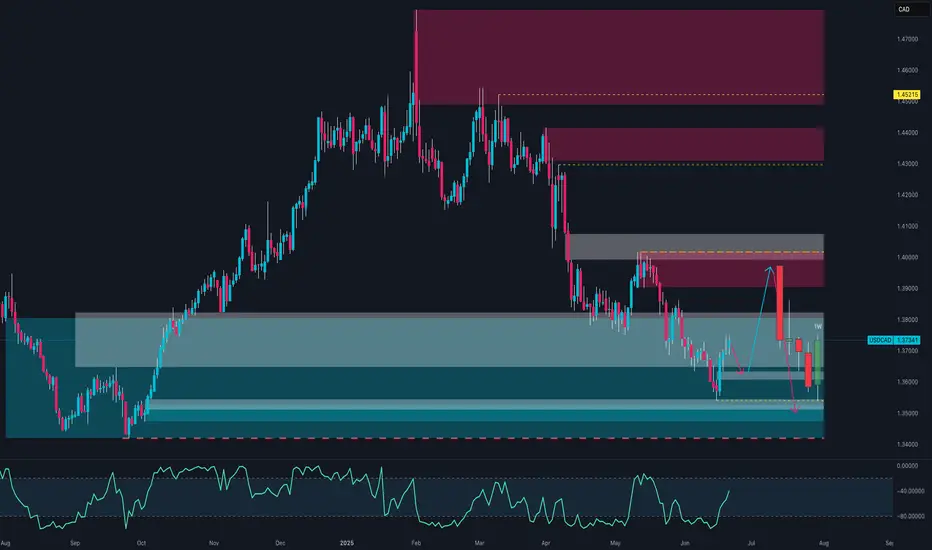
USD/CAD Trap in Progress? Smart Money Flips BearishUSD/CAD is currently in a rebalancing phase after the strong downside correction seen over recent weeks. Following a rejection in the 1.3900–1.4000 supply zone, price retraced down to a major demand area between 1.3500 and 1.3650, where it has shown a notable bullish reaction. The pair is now trading at 1.3734, and multi-frame data suggests we are in a transitional phase—not yet a confirmed bullish trend reversal.
COT Report – Institutional Positioning
The latest Commitments of Traders data (June 10th) reveals critical signals:
Commercials (hedgers and large institutions) have aggressively increased their long exposure on CAD, adding +27,999 contracts. This indicates strong expectations of Canadian dollar appreciation—bearish implications for USD/CAD in the medium term.
Non-Commercials (speculators) reduced their short CAD exposure by -14,319 contracts, signaling that speculative players are starting to unwind long USD/CAD positions.
Overall, the net shift shows institutional sentiment turning bearish on the pair, potentially pointing to a deeper downside once the current technical pullback completes.
USD Index COT – Dollar Momentum Weakening
On the USD Index, Non-Comms have added +1,279 long contracts, but positioning remains moderate. Commercials are flat, suggesting the dollar lacks strong bullish backing. This makes any sustained USD/CAD rally structurally fragile.
Retail Sentiment
Retail traders are 57% short and 43% long on USD/CAD. Although not extreme, this imbalance suggests confidence among retail participants in a bearish move—often preceding a short-term upward squeeze before an eventual trend continuation.
We could therefore see price move toward 1.3900 as a liquidity grab, setting the stage for a larger reversal.
Technical Analysis – Outlook
Key highlights:
A strong bullish reaction occurred from the 1.3500–1.3650 demand zone, previously well-respected.
The weekly RSI is still below the 50-level but is turning upward—momentum is improving.
Price structure shows room for a pullback to the 1.3900–1.4000 supply zone, which aligns with higher-timeframe order blocks.
This zone remains a critical resistance, and unless the macro and positioning context changes, a renewed bearish impulse is expected from this area.
Trading Outlook
The current picture presents a tactical short-term long opportunity, followed by a potential structural short setup.
📈 Scenario 1 – Bullish Pullback (in play):
With price above 1.3700 and consolidating, there’s space for a rally toward the 1.3900–1.4000 supply zone. Ideal for short-term targets.
📉 Scenario 2 – Structural Short (priority bias):
Should price reach 1.3950–1.4000 and show bearish confirmation (e.g., engulfing, doji, rejection on H4/H1), this would be a prime area to initiate swing shorts, targeting 1.3600 and eventually 1.3450.
✅ Final Bias: Structural Bearish – Corrective Bullish
Watch for potential false breakouts above 1.3800–1.3900 to liquidate retail shorts before a more meaningful downside move. The sharp increase in commercial net long CAD positions supports a bearish USD/CAD bias for the coming weeks.
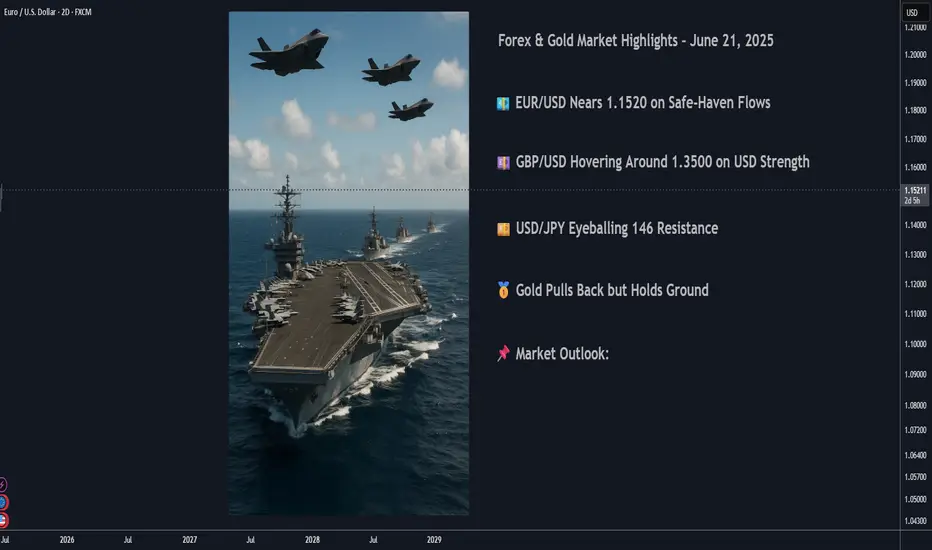
Forex and Gold Market Highlights June 21 2025Forex & Gold Market Highlights – June 21, 2025
🕒 Key Events This Week:
• 🏦 Fed officials signaling possible rate cuts vs. cautious economic tone
• 🌍 Escalating Israel–Iran tensions boosting safe-haven flows
• 🏭 Mixed U.S. macro data (retail sales, Philly Fed, housing) shaping Fed expectations
________________________________________
💶 EUR/USD Nears 1.1520 on Safe-Haven Flows
EUR/USD edged up to about 1.1520 amid weakness in the U.S. dollar, driven by global risk-off sentiment. Mixed signals from the Fed kept traders cautious.
________________________________________
💷 GBP/USD Hovering Around 1.3500 on USD Strength
GBP/USD remains near 1.3500, slipping slightly off highs after weaker UK retail data. The pair faces resistance in the 1.3550–1.3600 zone.
________________________________________
💴 USD/JPY Eyeballing 146 Resistance
USD/JPY climbed toward 146.00, driven by risk-averse USD demand and dovish BOJ stance. The pair is testing key retracement resistance near 146.76.
________________________________________
🥇 Gold Pulls Back but Holds Ground
Spot gold slid to around $3,334 3,381 this week, under pressure from a stronger dollar and diminished Fed rate-cut hopes. Still, geopolitical jitters kept it from falling hard.
• Weekly drop of ~2.5%, trading in a $3,330–$3,400 range.
________________________________________
📈 DXY Index Rallies on Risk Aversion
The U.S. Dollar Index rose ~0.45%, marking its strongest weekly gain in over a month due to heightened safe-haven flows amid Middle East tensions.
________________________________________
📌 Market Outlook:
• EUR/USD: Mixed bias. May test 1.1550–1.1600 if risk-off continues; downside risk near 1.1400 if U.S. data surprises.
• GBP/USD: Expected to stay in the 1.3450–1.3550 range; UK economic data and USD momentum will be key.
• USD/JPY: Bullish tilt remains toward 146.76, but any BOJ hints of policy tightening could shake it.
• Gold: Pressure from a firm dollar is likely to persist. Watch for geopolitical developments and upcoming Fed signals for reversal clues.
EURUSD POSSIBLE TRADE SETUP💶 Potential Trade Setup on EURUSD
Overview:
Since March, EURUSD has shown consistent bullish momentum, especially after breaking through the key 1.0600 supply zone.
The pair has maintained higher highs and higher lows, suggesting continued strength in the medium term.
That said, I am still quite anticipating for a possible continuation of the bullish momentum that started a long time ago, and moving forward, I will anticipate for a clear retest of the 50% fib at the 1.1425 region, then I go in for the kill.
Alternatively, there is a clear short opportunity, provided that, the bullish trendline is broken and the 1.1370 region is broken to the downside, this is a bit far a stretch, but it is in play. "IF" the DXY keeps the bullish momentum going.
🧭 Trading Plan:
✅ BUY Bias (Primary Plan):
Look for a retest of the 50% Fibonacci retracement zone around 1.1425. This aligns with the ongoing momentum on the 4H timeframe.
🔻 SELL Bias (Alternative Scenario):
If price breaks the bullish trendline and the 1.1370 support zone, a short opportunity opens up.
This is only valid if DXY continues to strengthen, shifting sentiment.
🎯 Targets & Risk Management: Targeting 1:2 R:R on both setups.
Ensure entries are backed by price action signals and confluences.
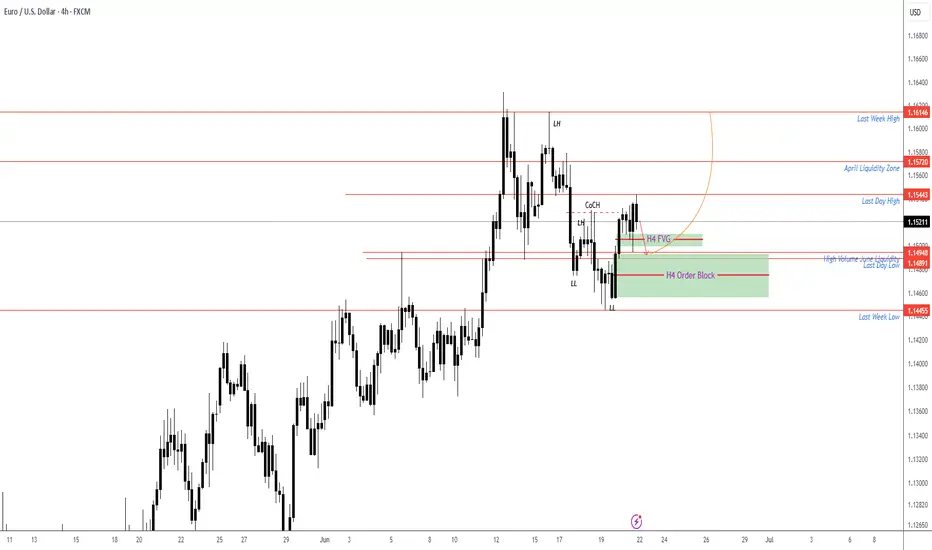
EURUSD M15 Forecast - Check related IdeaAs explained in previous post we are expecting a pull back down to our order block (H4) then a bullish reversal to retest last weeks highs (1.16) region. If price breaks and closes above the M15 supply zone will have to re-evaluate and potentially take a long position from a retest into a FVG.
EURUSD to Retest 1.16 regionWatching the 1.1490–1.1450 zone for a potential bullish reaction. This area includes a 4H Fair Value Gap and Order Block. If price gives a 15M CoCH within this range, I’ll look to enter long.
Targets: 1.1540, 1.1570, and 1.1610
Invalidation below 1.1440
Patience until price delivers a clear setup.
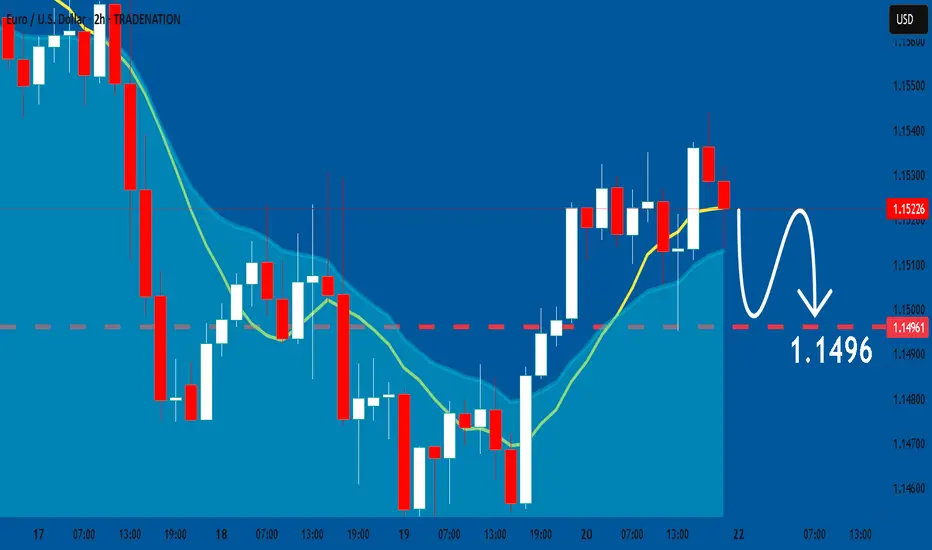
EURUSD: Bearish Continuation
Remember that we can not, and should not impose our will on the market but rather listen to its whims and make profit by following it. And thus shall be done today on the EURUSD pair which is likely to be pushed down by the bears so we will sell!
Disclosure: I am part of Trade Nation's Influencer program and receive a monthly fee for using their TradingView charts in my analysis.
❤️ Please, support our work with like & comment! ❤️
EURUSD Gearing Up for Next Leg Up – DXY Weakens After PPI MissToday, key U.S. economic indexes were released, providing fresh insights into inflationary pressures and the state of the labor market:
Core PPI m/m:
Actual: 0.1% | Forecast: 0.3% | Previous: -0.4%
Lower than expected – suggests weaker underlying producer inflation.
PPI m/m:
Actual: 0.1% | Forecast: 0.2% | Previous: -0.5%
Slight miss – overall inflation at the producer level remains soft.
Unemployment Claims:
Actual: 248K | Forecast: 242K | Previous: 247K
Slightly higher than forecast – signaling some cooling in the labor market.
Market Outlook :
These data releases point toward cooling inflation and softness in job growth, which may strengthen the dovish narrative around the Fed’s next move.
DXY Index ( TVC:DXY ) is under pressure, and EURUSD ( FX:EURUSD ) is showing signs of bullish momentum .
-----------------------------------------------------------
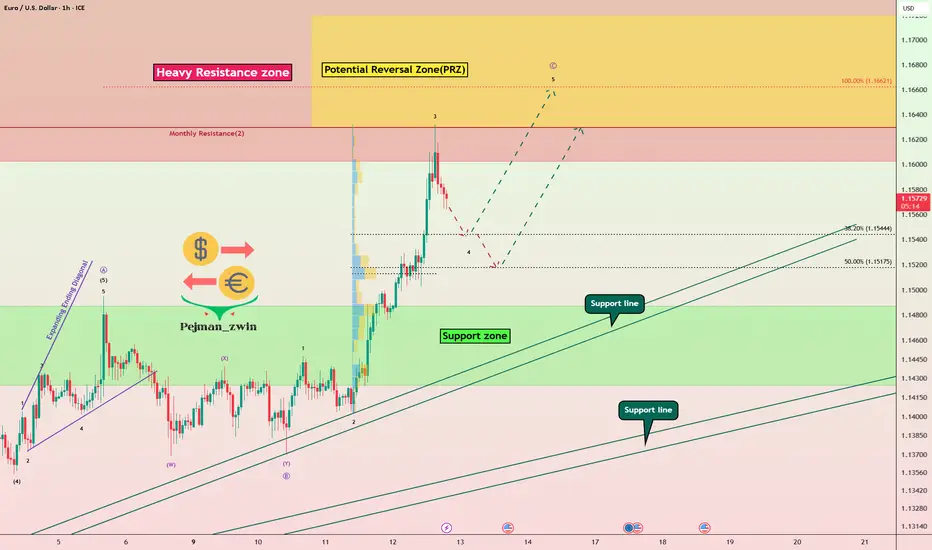
Now let's take a look at the EURUSD chart on the 1-hour time frame .
EURUSD is trading near the Heavy Resistance zone($1.182-$1.160) and Monthly Resistance(2) .
In terms of Elliott Wave theory , EURUSD appears to be completing microwave 4 . Microwave 4 could be completed at one of the Fibonacci levels .
I expect EURUSD to attack the Heavy Resistance zone($1.182-$1.160) at least once more after completing microwave 4 and could even rise to the Potential Reversal Zone(PRZ) .
Note: If EURUSD touches $1.1446 , we can expect more dump.
Please respect each other's ideas and express them politely if you agree or disagree.
Euro/U.S. Dollar Analyze (EURUSD), 1-hour time frame.
Be sure to follow the updated ideas.
Do not forget to put a Stop loss for your positions (For every position you want to open).
Please follow your strategy and updates; this is just my Idea, and I will gladly see your ideas in this post.
Please do not forget the ✅' like '✅ button 🙏😊 & Share it with your friends; thanks, and Trade safe.
EURUSD BEARISH SETUP
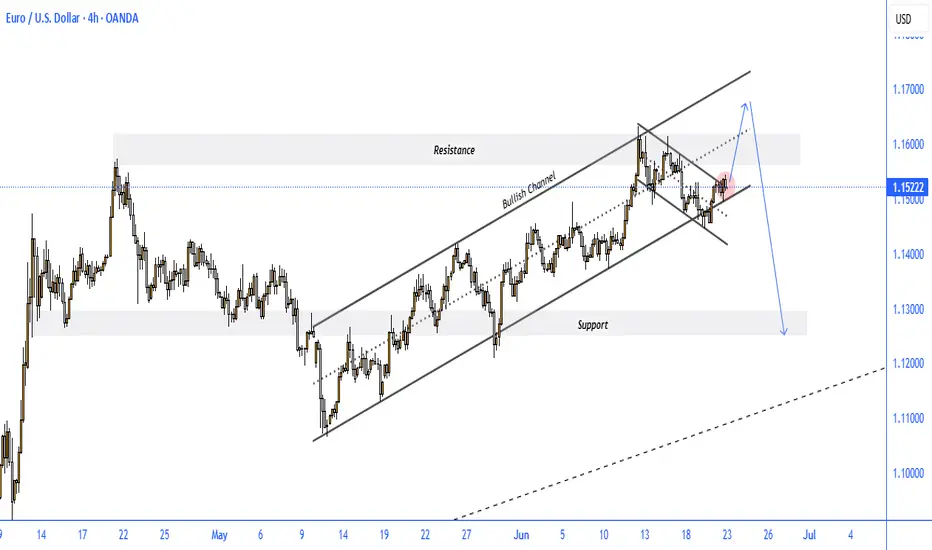
The EUR/USD 4-hour chart reflects a significant technical setup, showing price action within a bullish ascending channel that has recently broken to the downside, forming a falling wedge pattern—typically a bullish continuation signal.
Key Observations:
Bullish Channel Broken: The price broke below the ascending channel earlier this month, signaling initial weakness.
Falling Wedge Formation: A bullish falling wedge has developed, and the pair is now testing its upper boundary near 1.1522, attempting a breakout.
Resistance Zone: The price is approaching a key resistance area between 1.1550 – 1.1600, which aligns with previous highs and the wedge's upper edge.
Scenario Projection:
A temporary bullish breakout toward the resistance zone is expected.
If the pair gets rejected from this resistance, a sharp decline toward the major support area near 1.1300 is likely.
Bearish Confirmation: A clear rejection at the resistance zone followed by a break below the recent minor support (red zone) would confirm the bearish move.
Conclusion:
While short-term bullish momentum may push EUR/USD slightly higher, the confluence of resistance levels suggests a high probability of rejection. Traders should watch for reversal signals in the 1.1550–1.1600 zone, as failure to break higher could lead to a bearish move toward 1.1300 in the coming days.
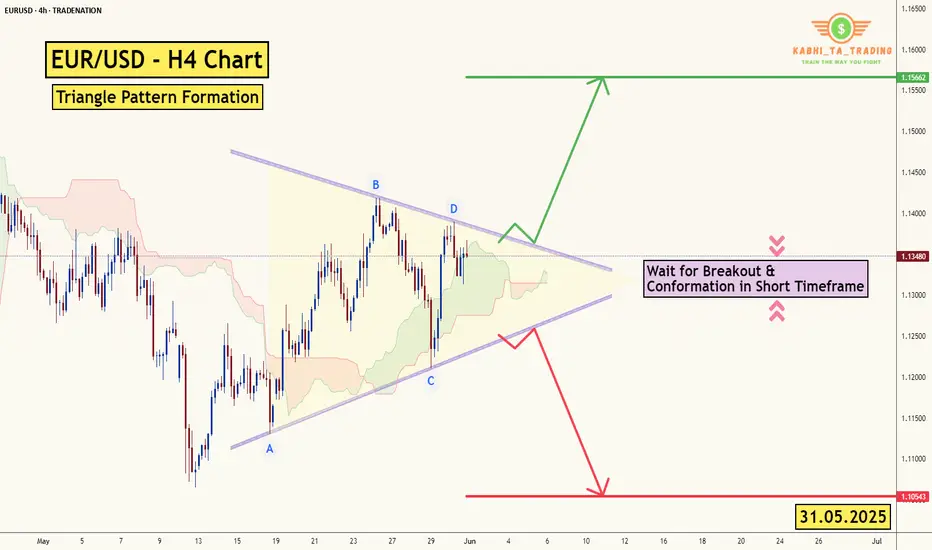
EUR/USD - H4 - Triangle Formation (31.05.2025)The EUR/USD pair on the H4 timeframe presents a recent Formation of a Triangle Pattern.
1. Wait for Breakout with Good Volume
2. Conformation in short Timeframe Must
🎁 Please hit the like button and
🎁 Leave a comment to support for My Post !
Fundamental Updates :
Dollar mixed on tariff uncertainty, U.S. President Donald Trump to battle a U.S. trade court ruling that blocked most of his proposed tariffs.
Your likes and comments are incredibly motivating and will encourage me to share more analysis with you.
Best Regards, KABHI_TA_TRADING
Thank you.
Disclosure: I am part of Trade Nation's Influencer program and receive a monthly fee for using their TradingView charts in my analysis.
EURUSD - 2nd potential entryEvening all
Here is a still screenshot of what I am looking for the market open on EURUSD come Sunday night after the spreads have died down on the pair.
My pending order will go directly on the FVG with my stops below the manipulation of the range.
If I get tagged in great. If I don't also great if we continue to move high I mill just manage the one position.
If I am tagged in I will give you and update with a new idea and then depending on how that idea plays out win or lose I will come back and re-visit it and break it down some more.
However I have high hopes for this trade to make it up to 1.16300
Have a great weekend
and I will speak to you all soon