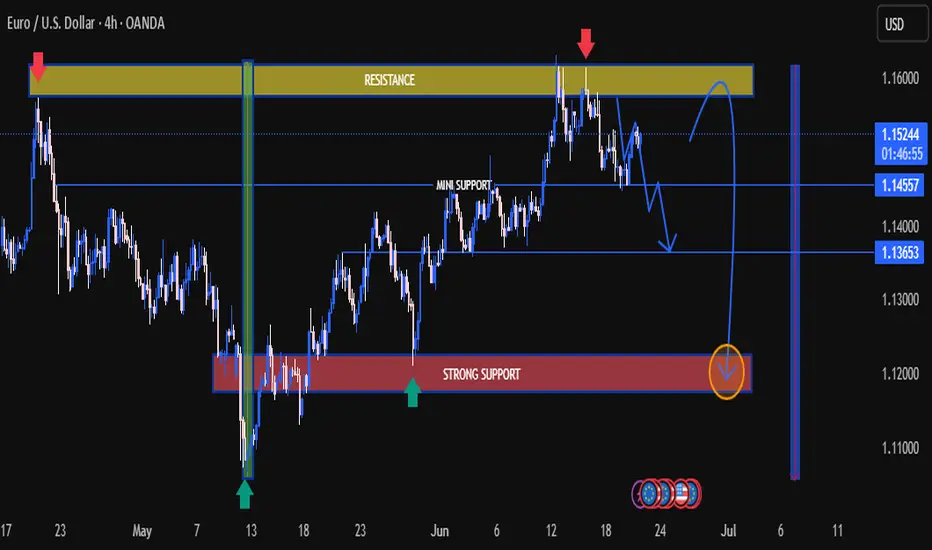
EUR/USD 4H Analysis – Bearish Outlook with Key Levels📉 EUR/USD 4H Analysis – Bearish Outlook with Key Levels 📊
🔍 Overview:
The EUR/USD pair on the 4-hour chart is showing signs of a potential bearish reversal after testing a strong resistance zone near 1.16000. Price action has rejected this area twice (🔴), confirming it as a significant supply zone. The chart now suggests a descending move toward the strong support zone around 1.12000.
🔑 Key Levels:
🟡 Resistance Zone: 1.15700 – 1.16000
Multiple rejections indicate strong selling pressure.
🟦 Mini Support: Around 1.14550
A minor level where price could react short-term, but not a major barrier.
🔻 Mid-Level Target: 1.13653
Potential bounce zone before continuation downward.
🟥 Strong Support Zone: 1.11500 – 1.12200
Previously held as a launch point for a major rally in May; likely to be tested again.
📈 Scenario Outlook:
Bearish Path Expected:
Price is forming a series of lower highs and appears to be losing bullish momentum.
Target Path (Blue Arrows):
A potential drop toward the 1.13653 level is expected, followed by a deeper drop toward the strong support.
Rebound Possibility:
If the strong support holds, we could see a strong bullish bounce 🔄, potentially creating a longer-term buying opportunity.
💡 Conclusion:
EUR/USD is currently in a correction phase. Traders should watch for a confirmed break below 1.14550 for bearish continuation 📉. A drop to the 1.12000 zone may offer a high-probability reversal setup 📊📍.
🔔 Trading Tip:
Use caution around mini support; aggressive sellers may enter on any weak bounce. Wait for confirmation before entering positions. 🧠📉
Eurusd-4
EURUSD Under Pressure! SELL!
My dear friends,
Please, find my technical outlook for EURUSD below:
The price is coiling around a solid key level - 1.1508
Bias - Bearish
Technical Indicators: Pivot Points Low anticipates a potential price reversal.
Super trend shows a clear sell, giving a perfect indicators' convergence.
Goal - 1.1488
About Used Indicators:
The pivot point itself is simply the average of the high, low and closing prices from the previous trading day.
Disclosure: I am part of Trade Nation's Influencer program and receive a monthly fee for using their TradingView charts in my analysis.
———————————
WISH YOU ALL LUCK
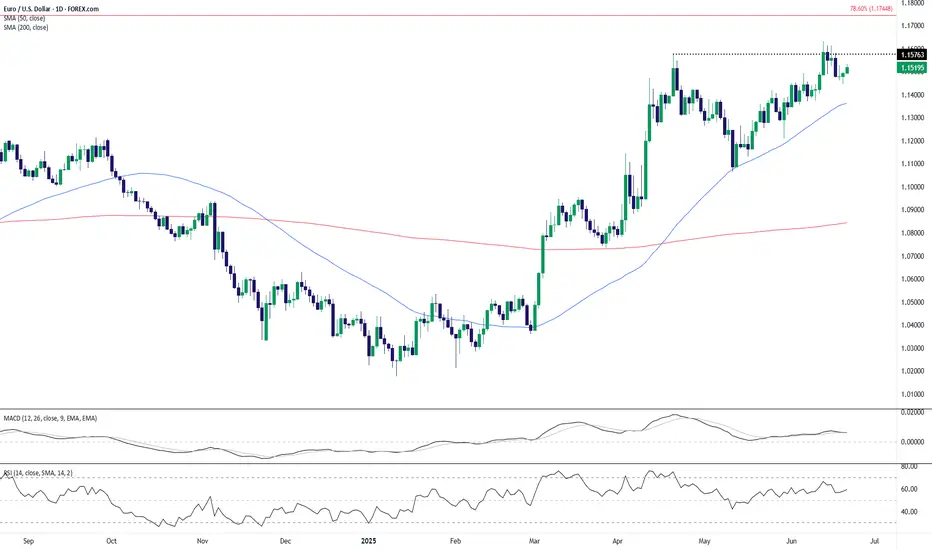
EUR/USD Approaching Key Resistance – Will Bulls Break Through?EUR/USD continues to trade within a strong uptrend, respecting the 50-day SMA while pressing against a key horizontal resistance level around 1.1576. The pair has recently pulled back modestly after testing this level but remains above the short-term moving average, suggesting buyers are still in control.
Technicals provide a mixed, but slightly bullish picture:
Trend Structure: Price action shows a series of higher highs and higher lows since mid-February, confirming a bullish trend.
Moving Averages: The 50-day SMA is above the 200-day SMA (golden cross), and price continues to close above both, reinforcing the bullish bias.
MACD: While flattening, it remains in positive territory – momentum is cooling but not reversing.
RSI: Currently near 59, suggesting bullish momentum without overbought conditions – a healthy zone for a potential continuation higher.
A breakout above the 1.1576 resistance could open the path toward the 78.6% Fibonacci retracement level near 1.1745. However, failure to clear this barrier may invite consolidation or a minor pullback toward the 50-day SMA.
Traders should watch for a daily close above 1.1576 or a bounce from the 50-day SMA to confirm the next directional move.
-MW
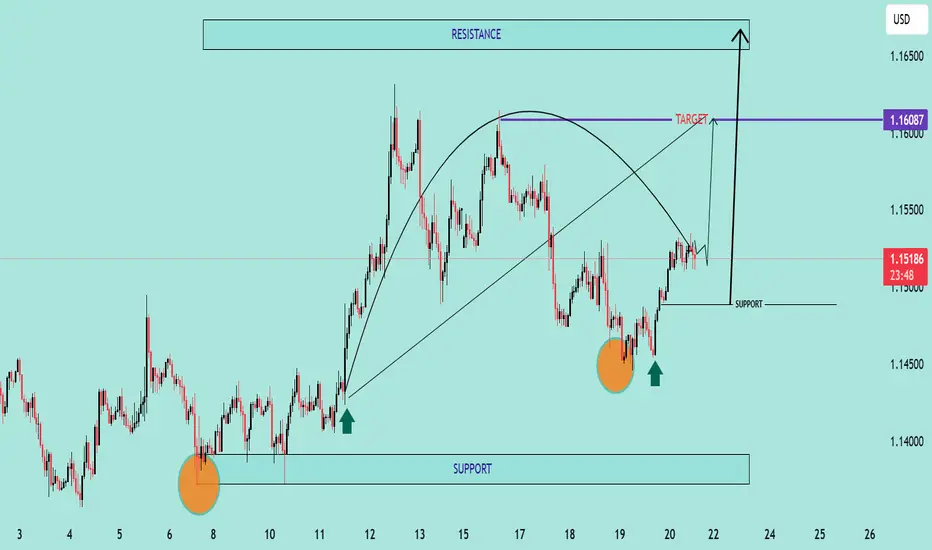
EUR/USD Bullish Reversal Breakout Pattern Technical Analysis Summary:
The chart illustrates a strong bullish reversal pattern forming on the EUR/USD pair:
🔹 Double Bottom Formation (🔶🔶):
Two clear bottom zones are marked with orange circles near the 1.14400–1.14500 area, indicating strong buying interest and support.
The second bottom confirms the double bottom pattern, often a precursor to an upward trend.
🔹 Support Zone (📉):
Firm support around 1.14450, as highlighted on the chart.
Price has respected this zone twice, bouncing back with bullish momentum each time.
🔹 Neckline Breakout (🔼):
Price is approaching the neckline zone at 1.16087, which acts as the bullish target.
A break and close above this neckline will confirm the reversal and open the way toward the resistance zone around 1.16500.
🔹 Projected Move (🎯):
If the neckline breaks, price is expected to surge towards 1.16500, aligning with the historical resistance.
This move completes the measured target projection from the double bottom structure.
🔹 Bullish Structure:
Higher lows and strong bullish candles are reinforcing the uptrend momentum.
Curved trajectory shows accumulation followed by a breakout phase.
📌 Key Levels to Watch:
Support: 1.14450 – 1.14500
Neckline/Target: 1.16087
Resistance: 1.16500
🛑 Invalidation:
A strong breakdown below support (1.14450) would invalidate this bullish setup.
EURUSD: Move Down Expected! Short!
My dear friends,
Today we will analyse EURUSD together☺️
The market is at an inflection zone and price has now reached an area around 1.15208 where previous reversals or breakouts have occurred.And a price reaction that we are seeing on multiple timeframes here could signal the next move down so we can enter on confirmation, and target the next key level of 1.15133..Stop-loss is recommended beyond the inflection zone.
❤️Sending you lots of Love and Hugs❤️
EUR/USD Slips as Fed Stays HawkishEUR/USD hovered near 1.1520 during Friday’s Asian session, extending gains for a third day as the US dollar weakened, likely due to a technical pullback. However, the greenback may rebound as safe-haven demand grows amid rising tensions between the US and Iran.
Citing senior US intelligence, The New York Times reported that Iran hasn’t yet decided to pursue nuclear weapons, despite having enriched uranium reserves. Meanwhile, the Senate Intelligence Committee Chair said President Trump is set to offer Iran one final window to negotiate before considering military action, potentially delaying any decisions for up to two weeks.
Markets are also awaiting Friday’s Monetary Policy Report from the Federal Reserve, which will provide fresh insights into the Fed’s stance. On the Euro side, the ECB’s hawkish outlook offered additional support, with President Christine Lagarde suggesting rate cuts may soon end as the central bank remains “well positioned” to handle persistent risks.
Resistance is located at 1.1530, while support is seen at 1.1450
DeGRAM | EURUSD reached the resistance level📊 Technical Analysis
● Bulls defended the rising-channel mid-line (≈1.1480), turning it into support and snapping the intraday falling wedge; hourly closes now print higher highs above the reclaimed 1.1520 pivot.
● A tight bull flag is forming against 1.1560; its 1.618 swing coincides with the upper rail / 1.1617 resistance, keeping the channel’s momentum bias pointed north.
💡 Fundamental Analysis
● Softer US housing starts and a slide in 2-yr yields pulled the DXY to two-week lows, while ECB’s Knot warned “premature cuts risk inflation flare-ups,” widening the short-rate gap in the euro’s favour.
✨ Summary
Long 1.1515-1.1530; flag break >1.1560 targets 1.1617, stretch 1.1670. Bias void on an H1 close below 1.1480.
-------------------
Share your opinion in the comments and support the idea with a like. Thanks for your support
EURUSD Breaks Structure: Bullish Continuation Opportunity💶 EUR/USD Analysis – Bullish Momentum Builds 📈
Taking a look at the EUR/USD on the daily chart, it’s clear the pair is currently in a strong bullish trend 🚀. Momentum has been building consistently, reflecting underlying euro strength and continued USD weakness.
🕓 On the 4H timeframe, we’ve now seen a clear shift in market structure to the upside, confirming bullish intent. Look for a continuation entry after a retracement back into equilibrium — ideally around the 50% level of the current price swing 🔄📐.
🎯 Trade Plan Idea:
Wait for price to pull back into equilibrium 🌀
Entry: Long from the discounted zone 🟩
Stop loss: Just below the recent swing low 🔻
Target: Previous high as a logical take-profit zone 🎯📊
⚠️ Disclaimer:
This content is for educational and informational purposes only and should not be considered financial advice. Always do your own research and consult with a qualified financial advisor before making any trading decisions. 📚💼

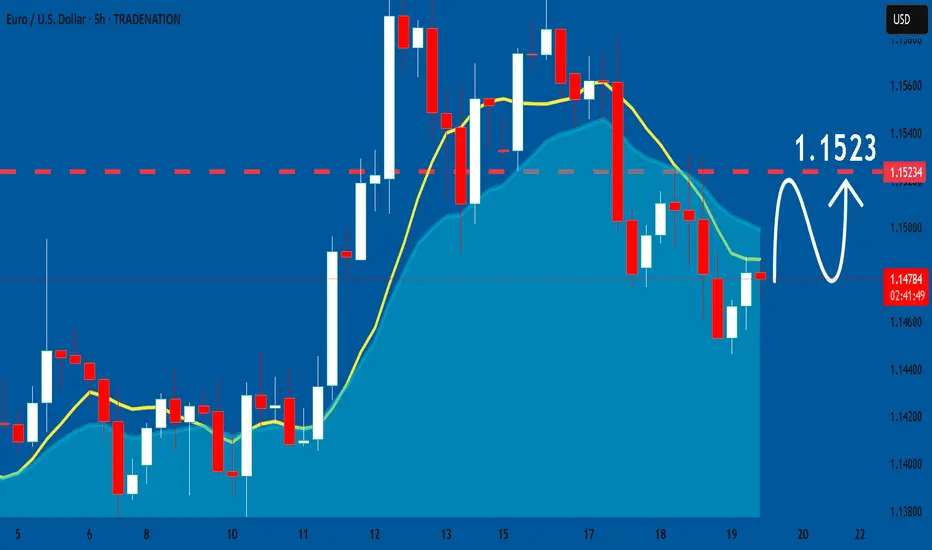
DeGRAM | EURUSD double bottom📊 Technical Analysis
● The price is currently testing the upper resistance of a descending wedge pattern after forming a clear double bottom formation. This double bottom occurred precisely at a confluence of support, where the long-term ascending support line intersects with the lower boundary of the wedge, indicating a strong potential for a bullish reversal from the 1.1450-1.1470 area.
● This recent bullish price action follows a prior "double top" pattern that initiated the corrective move downwards into the current wedge. A decisive breakout and hold above the wedge's resistance would invalidate the recent bearish pressure and confirm that buyers are taking control, with the first significant target being the horizontal resistance line near 1.1523.
💡 Fundamental Analysis
● Market attention is centered on the upcoming U.S. Federal Reserve policy meeting. While no rate change is expected, forward guidance is key. Current market sentiment, as noted by analysts at RoboForex and FreshForex, is pricing in the possibility of a Fed rate cut later this year, which could place downward pressure on the US Dollar.
● Conversely, the Euro is finding support from a comparatively hawkish European Central Bank (ECB). Recent reports indicate that the probability of an ECB rate cut has diminished, suggesting a policy divergence that favors EUR strength against the USD, underpinning the technical case for a move higher.
✨ Summary
Long entry on a confirmed 30-minute candle close above the descending wedge resistance (~1.1485); initial target 1.1523 → 1.1560. The bullish outlook is invalidated on a close below the double bottom support at 1.1450.
-------------------
Share your opinion in the comments and support the idea with a like. Thanks for your support
EURUSD Sell opportunity I see a sell opportunity on EURUSD
Entry: 1.15300
Sl: 1.15400
TP: 1.14500
Comment your opinion
For fund management. INBOX ME ON X @shajudeakinoba1

GBPUSD short!Classic Wyckoff upthrust, this is A+
We’ve got a clear AB=CD completion at C, tagging previous support-turned-resistance, while the volume on the climb is drying up (classic clue of passive buyers getting trapped). The channel top + Fibonacci confluence + previous swing zone adds weight.
🔻 Trade Idea:
Entry: 1.3477
Stop: 1.3521 (above wick highs and structure)
Target 1: 1.3401 (break structure)
Target 2: 1.3276 (full measured move / spring's origin)
Risk-Reward: ~3.5R
Volume divergence confirms exhaustion.
Ideal reaction would break through mid-line and sustain under 1.3401.
🔍 Watch For:
Bearish engulfing confirmation on 1h
Volume spike during breakdown = smart money selling
If price lingers above 1.3515, trap invalid

EURUSD SHORT FORECAST Q2 W25 D20 Y25EURUSD SHORT FORECAST Q2 W25 D20 Y25
Professional Risk Managers👋
Welcome back to another FRGNT chart update📈
Diving into some Forex setups using predominantly higher time frame order blocks alongside confirmation breaks of structure.
Let’s see what price action is telling us today!
💡Here are some trade confluences📝
✅Weekly order block rejection
✅15' order block
✅4 hour order block identified
✅Tokyo ranges to be filled
🔑 Remember, to participate in trading comes always with a degree of risk, therefore as professional risk managers it remains vital that we stick to our risk management plan as well as our trading strategies.
📈The rest, we leave to the balance of probabilities.
💡Fail to plan. Plan to fail.
🏆It has always been that simple.
❤️Good luck with your trading journey, I shall see you at the very top.
🎯Trade consistent, FRGNT X
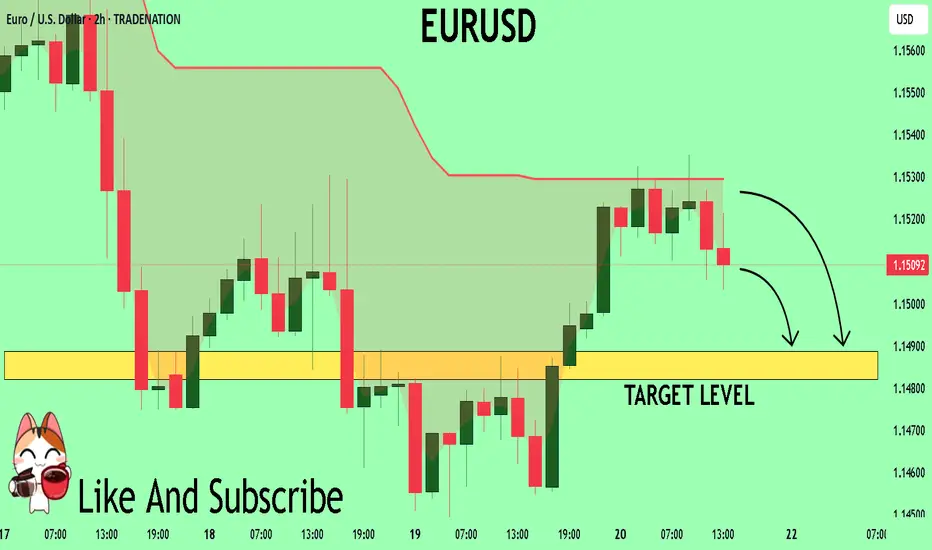
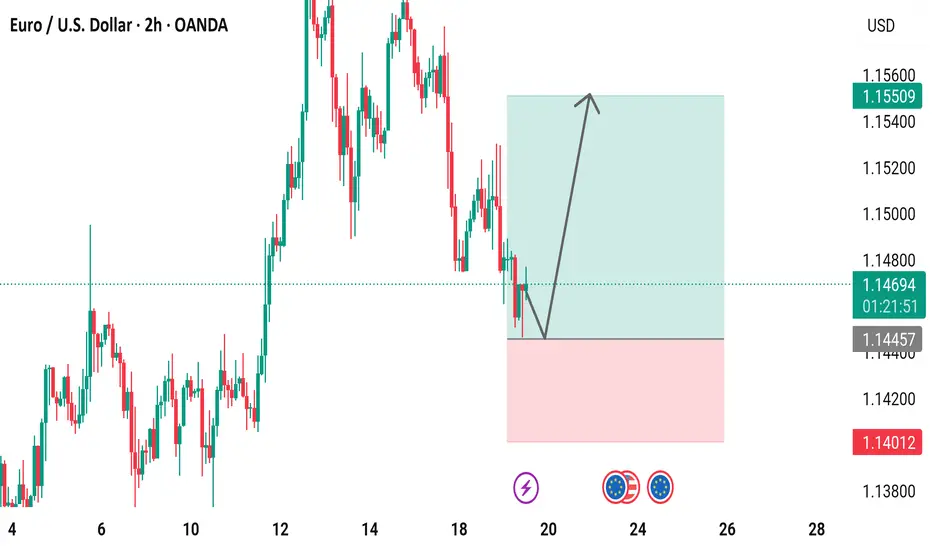
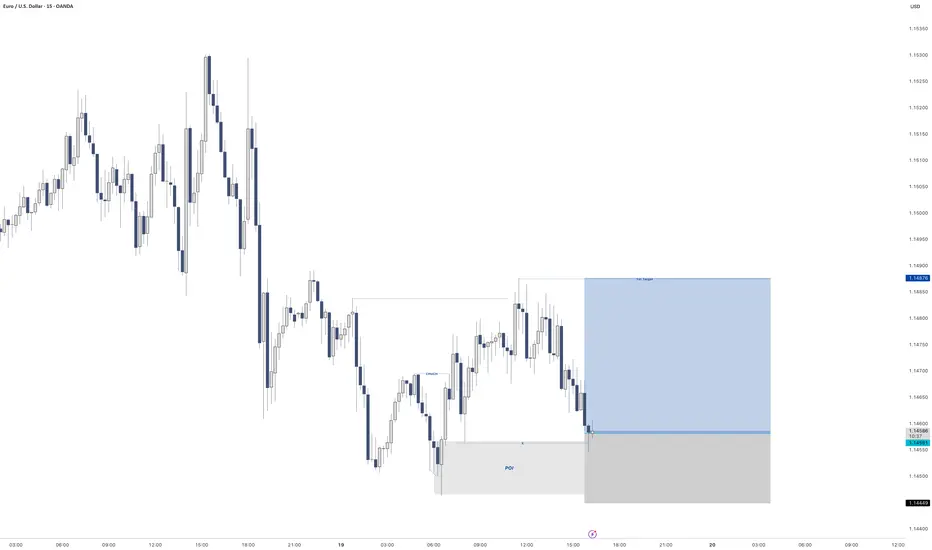
EUR/USD 2-Hour Chart Analysis2-hour performance of the Euro/U.S. Dollar (EUR/USD) currency pair, showing a recent decline with a change of -0.00134 (-0.12%) to a current value of 1.14676. The chart includes key levels such as a support zone around 1.14012-1.14457 and a resistance zone near 1.15000-1.15509. A breakout above the resistance could indicate a potential upward trend, as suggested by the highlighted area.
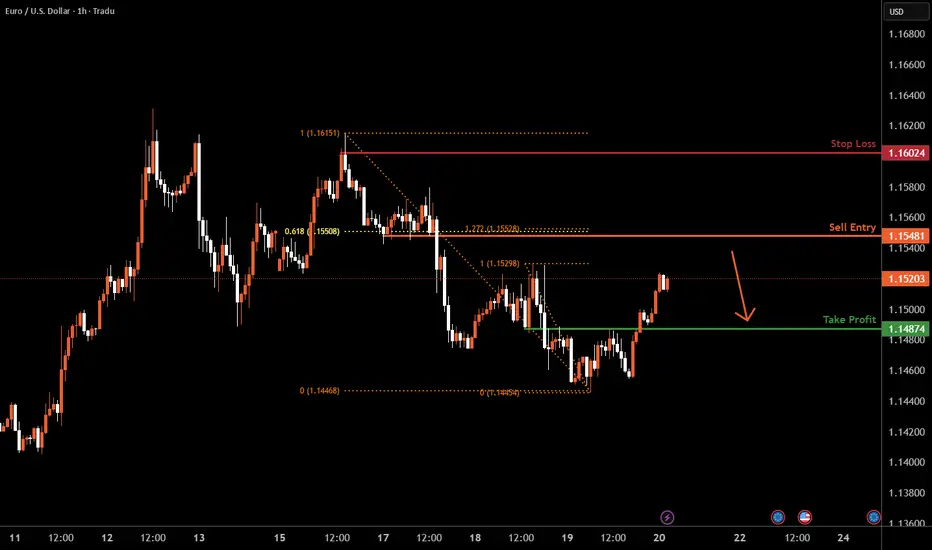
EURUSD H1 I Bearish Reversal Based on the H1 chart, the price is rising toward our sell entry level at 1.1548, a pullback resistance that aligns with the 50% Fib retracement and the 127.25 Fib extension, providing a significant level for a potential bearish reversal.
Our take profit is set at 1.1487, a pullback support.
The stop loss is set at 1.1602, a swing high resistance.
High Risk Investment Warning
Trading Forex/CFDs on margin carries a high level of risk and may not be suitable for all investors. Leverage can work against you.
Stratos Markets Limited (tradu.com ):
CFDs are complex instruments and come with a high risk of losing money rapidly due to leverage. 63% of retail investor accounts lose money when trading CFDs with this provider. You should consider whether you understand how CFDs work and whether you can afford to take the high risk of losing your money.
Stratos Europe Ltd (tradu.com ):
CFDs are complex instruments and come with a high risk of losing money rapidly due to leverage. 63% of retail investor accounts lose money when trading CFDs with this provider. You should consider whether you understand how CFDs work and whether you can afford to take the high risk of losing your money.
Stratos Global LLC (tradu.com ):
Losses can exceed deposits.
Please be advised that the information presented on TradingView is provided to Tradu (‘Company’, ‘we’) by a third-party provider (‘TFA Global Pte Ltd’). Please be reminded that you are solely responsible for the trading decisions on your account. There is a very high degree of risk involved in trading. Any information and/or content is intended entirely for research, educational and informational purposes only and does not constitute investment or consultation advice or investment strategy. The information is not tailored to the investment needs of any specific person and therefore does not involve a consideration of any of the investment objectives, financial situation or needs of any viewer that may receive it. Kindly also note that past performance is not a reliable indicator of future results. Actual results may differ materially from those anticipated in forward-looking or past performance statements. We assume no liability as to the accuracy or completeness of any of the information and/or content provided herein and the Company cannot be held responsible for any omission, mistake nor for any loss or damage including without limitation to any loss of profit which may arise from reliance on any information supplied by TFA Global Pte Ltd.
The speaker(s) is neither an employee, agent nor representative of Tradu and is therefore acting independently. The opinions given are their own, constitute general market commentary, and do not constitute the opinion or advice of Tradu or any form of personal or investment advice. Tradu neither endorses nor guarantees offerings of third-party speakers, nor is Tradu responsible for the content, veracity or opinions of third-party speakers, presenters or participants.
Bullish bounce off pullback support?The Fiber (EUR/USD) has bounced off the pivot and could rise to the 1st resistance.
Pivot: 1.1444
1st Support: 1.1369
1st Resistance: 1.1587
Risk Warning:
Trading Forex and CFDs carries a high level of risk to your capital and you should only trade with money you can afford to lose. Trading Forex and CFDs may not be suitable for all investors, so please ensure that you fully understand the risks involved and seek independent advice if necessary.
Disclaimer:
The above opinions given constitute general market commentary, and do not constitute the opinion or advice of IC Markets or any form of personal or investment advice.
Any opinions, news, research, analyses, prices, other information, or links to third-party sites contained on this website are provided on an "as-is" basis, are intended only to be informative, is not an advice nor a recommendation, nor research, or a record of our trading prices, or an offer of, or solicitation for a transaction in any financial instrument and thus should not be treated as such. The information provided does not involve any specific investment objectives, financial situation and needs of any specific person who may receive it. Please be aware, that past performance is not a reliable indicator of future performance and/or results. Past Performance or Forward-looking scenarios based upon the reasonable beliefs of the third-party provider are not a guarantee of future performance. Actual results may differ materially from those anticipated in forward-looking or past performance statements. IC Markets makes no representation or warranty and assumes no liability as to the accuracy or completeness of the information provided, nor any loss arising from any investment based on a recommendation, forecast or any information supplied by any third-party.

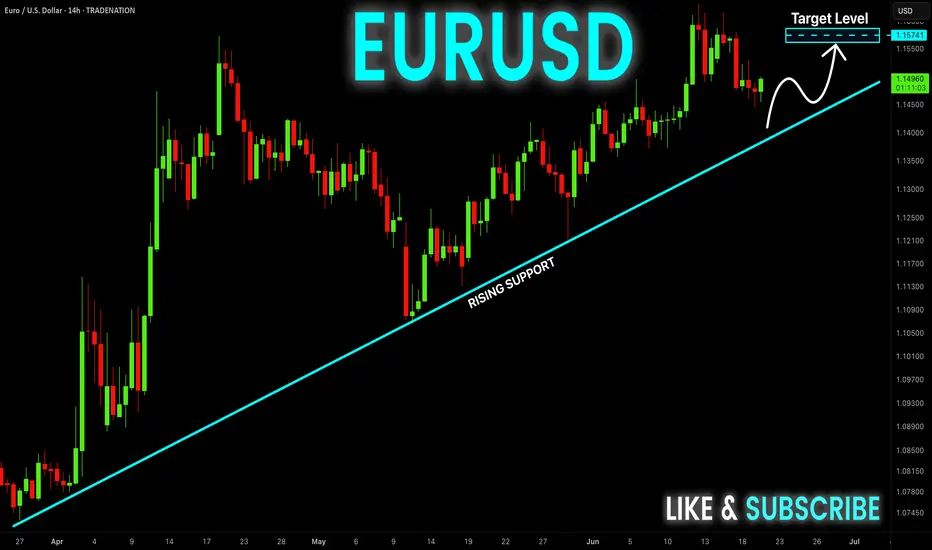
EUR-USD Will Keep Growing! Buy!
Hello,Traders!
EUR-USD is trading in an
Uptrend along the rising
Support and the pair will
Soon retest the support
From where we will be
Expecting a bullish rebound
And a bullish continuation
Buy!
Comment and subscribe to help us grow!
Check out other forecasts below too!
Disclosure: I am part of Trade Nation's Influencer program and receive a monthly fee for using their TradingView charts in my analysis.
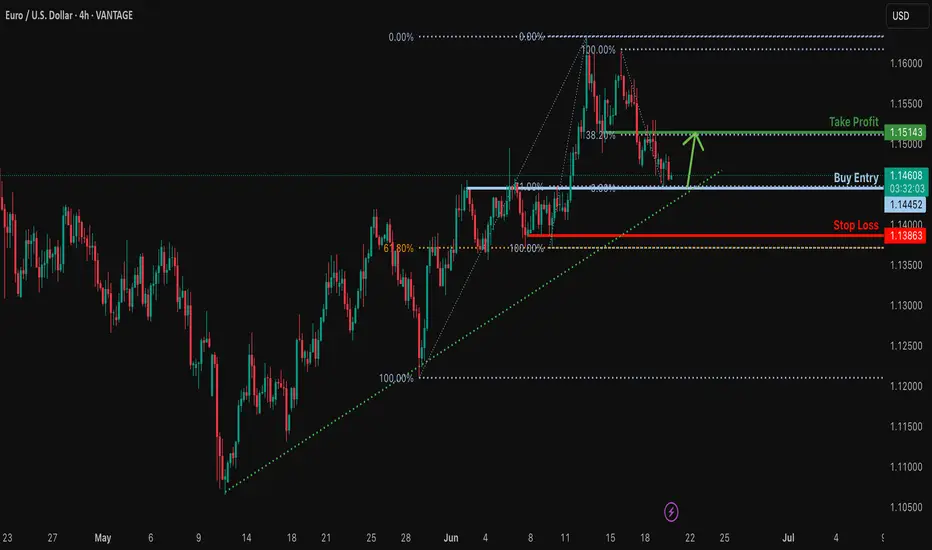
Bullish bounce?EUR/USD is falling towards the support level which is a pullback support that lines up with the 71% Fibonacci retracement and could rise from this level to our take profit.
Entry: 1.1445
Why we like it:
There is a pullback support level that aligns with the 71% Fibonacci retracement.
Stop loss: 1.1386
Why we like it:
There is a pullback support level that is slightly above the 61.8% Fibonacci retracement.
Take profit:1.1514
Why we like it:
There is an overlap resistance level that lines up with the 38.2% Fibonacci retracement.
Enjoying your TradingView experience? Review us!
Please be advised that the information presented on TradingView is provided to Vantage (‘Vantage Global Limited’, ‘we’) by a third-party provider (‘Everest Fortune Group’). Please be reminded that you are solely responsible for the trading decisions on your account. There is a very high degree of risk involved in trading. Any information and/or content is intended entirely for research, educational and informational purposes only and does not constitute investment or consultation advice or investment strategy. The information is not tailored to the investment needs of any specific person and therefore does not involve a consideration of any of the investment objectives, financial situation or needs of any viewer that may receive it. Kindly also note that past performance is not a reliable indicator of future results. Actual results may differ materially from those anticipated in forward-looking or past performance statements. We assume no liability as to the accuracy or completeness of any of the information and/or content provided herein and the Company cannot be held responsible for any omission, mistake nor for any loss or damage including without limitation to any loss of profit which may arise from reliance on any information supplied by Everest Fortune Group.
EURUSD - LongGreat set. Very close to Demand on the HTF to the left.
CHoCH on the 15min that left behind some liquidity.
Also created some liquidity to the right.
Very nice set up for me.
Triggered into the trade
Lets see how we go
EURUSD Under Pressure! SELL!
My dear friends,
Please, find my technical outlook for EURUSD below:
The instrument tests an important psychological level 1.1551
Bias - Bearish
Technical Indicators: Supper Trend gives a precise Bearish signal, while Pivot Point HL predicts price changes and potential reversals in the market.
Target - 1.1458
Recommended Stop Loss - 1.1608
About Used Indicators:
Super-trend indicator is more useful in trending markets where there are clear uptrends and downtrends in price.
Disclosure: I am part of Trade Nation's Influencer program and receive a monthly fee for using their TradingView charts in my analysis.
———————————
WISH YOU ALL LUCK
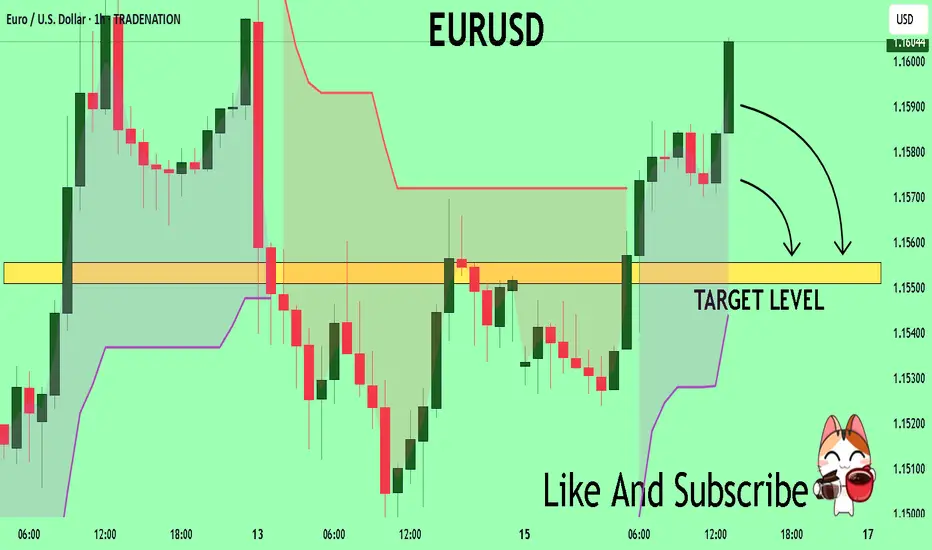
EURUSD The Target Is DOWN! SELL!
My dear subscribers,
This is my opinion on the EURUSD next move:
The instrument tests an important psychological level 1.1588
Bias - Bearish
Technical Indicators: Supper Trend gives a precise Bearish signal, while Pivot Point HL predicts price changes and potential reversals in the market.
Target - 1.1555
About Used Indicators:
On the subsequent day, trading above the pivot point is thought to indicate ongoing bullish sentiment, while trading below the pivot point indicates bearish sentiment.
Disclosure: I am part of Trade Nation's Influencer program and receive a monthly fee for using their TradingView charts in my analysis.
———————————
WISH YOU ALL LUCK
EURUSD: The Market Is Looking Up! Long!
My dear friends,
Today we will analyse EURUSD together☺️
The market is at an inflection zone and price has now reached an area around 1.14672 where previous reversals or breakouts have occurred.And a price reaction that we are seeing on multiple timeframes here could signal the next move up so we can enter on confirmation, and target the next key level of 1.14789.Stop-loss is recommended beyond the inflection zone.
❤️Sending you lots of Love and Hugs❤️

EURUSD: Market of Buyers
The charts are full of distraction, disturbance and are a graveyard of fear and greed which shall not cloud our judgement on the current state of affairs in the EURUSD pair price action which suggests a high likelihood of a coming move up.
Disclosure: I am part of Trade Nation's Influencer program and receive a monthly fee for using their TradingView charts in my analysis.
❤️ Please, support our work with like & comment! ❤️
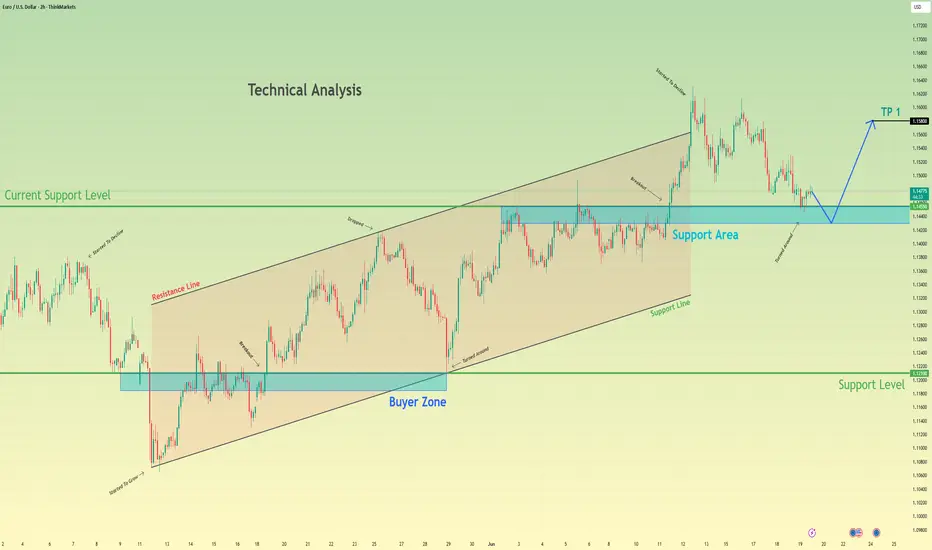
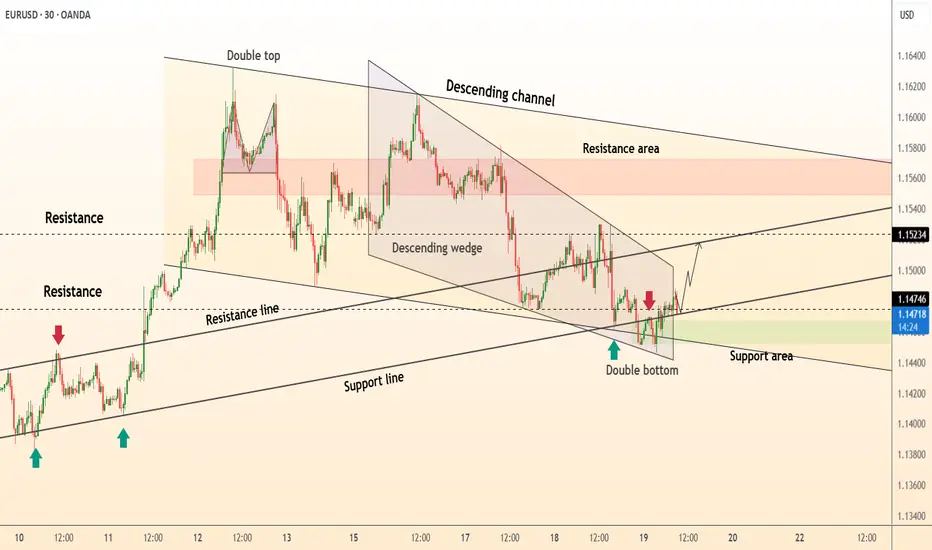
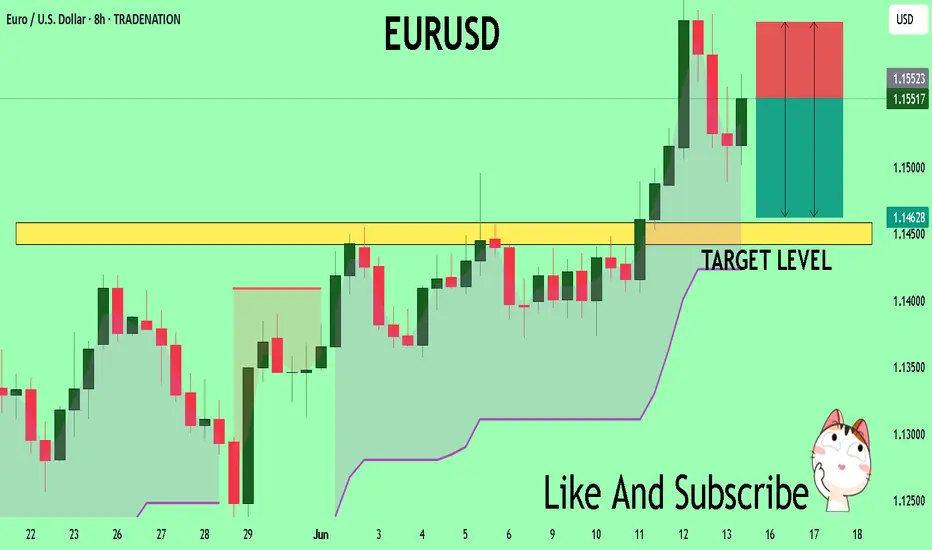
Euro can fall to support area and then rebound upHello traders, I want share with you my opinion about Euro. Observing this chart, we can see how the price, after a period of sideways trading, the price started to grow gradually and formed a consistent bullish structure. The trend was supported by regular bounces from the support line, confirming the bullish sentiment. At some point, price made a temporary drop below the support area, but this move was short-lived; bulls quickly stepped in, and the pair recovered. After that, EURUSD returned back into the channel and began forming higher highs and higher lows again, confirming the continuation of the trend. Right now, the price is declining slightly and approaching the support area again, which is located between 1.1455 and 1.1430. This zone has shown itself as a strong support during previous moves and is now being retested from above. Given the current structure and the upward channel in play, I expect the Euro to rebound from this support area and continue growing toward the 1.1580 points - that’s my current TP 1. Please share this idea with your friends and click Boost 🚀
Disclaimer: As part of ThinkMarkets’ Influencer Program, I am sponsored to share and publish their charts in my analysis.