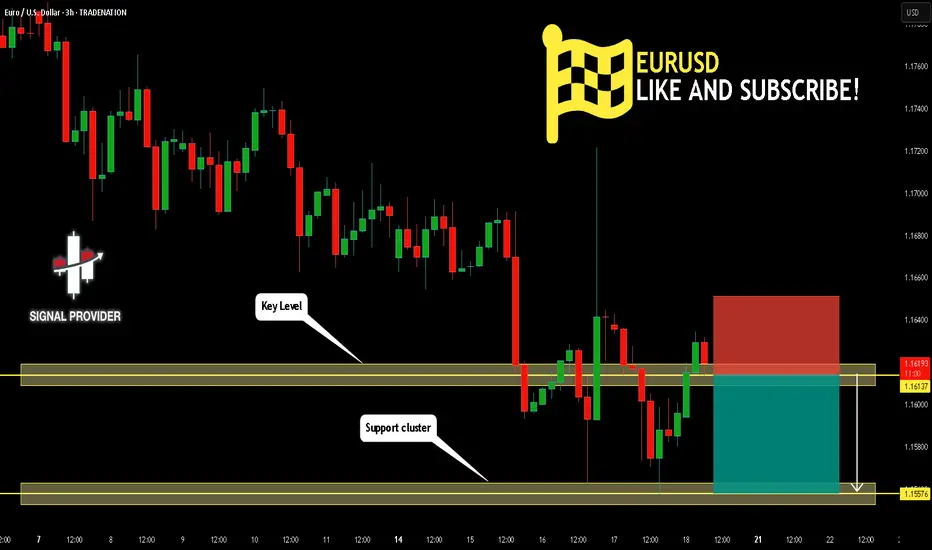
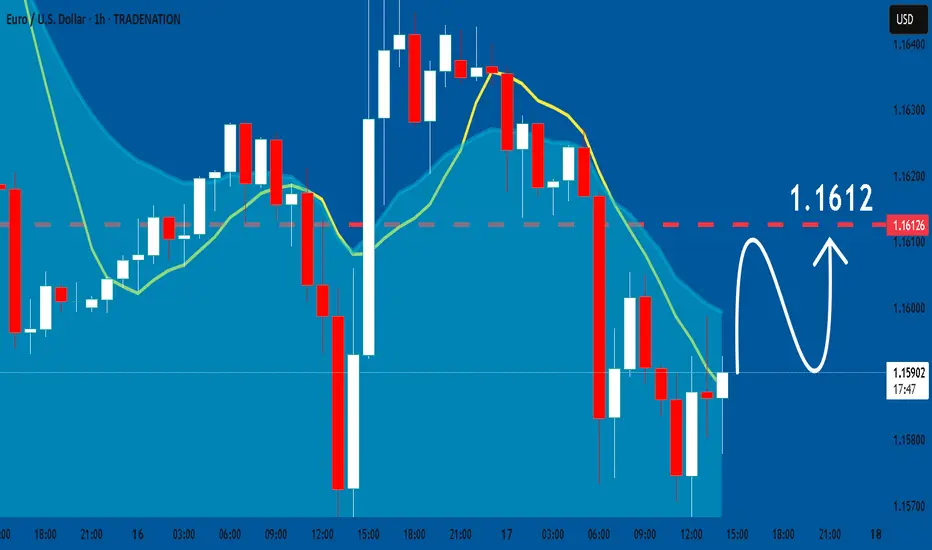
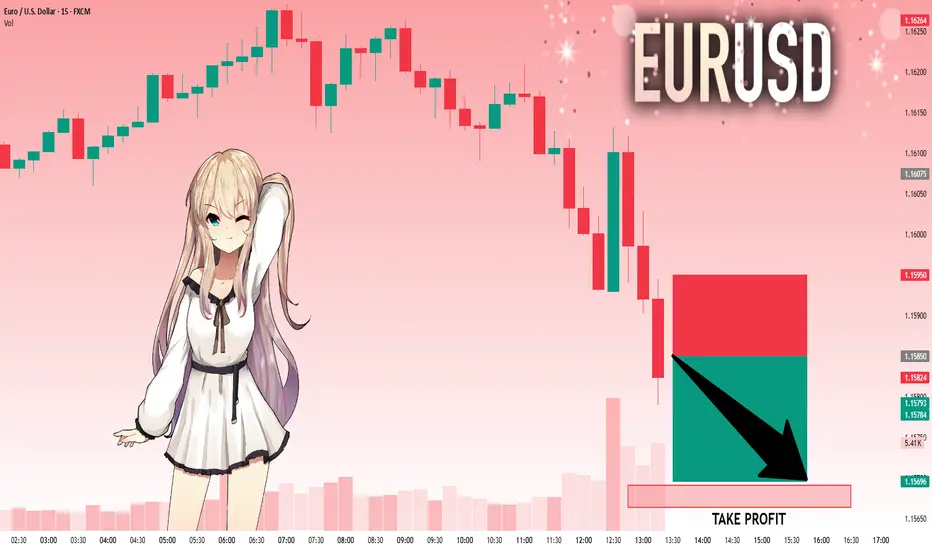
EURUSD Will Go Down! Short!
Please, check our technical outlook for EURUSD.
Time Frame: 3h
Current Trend: Bearish
Sentiment: Overbought (based on 7-period RSI)
Forecast: Bearish
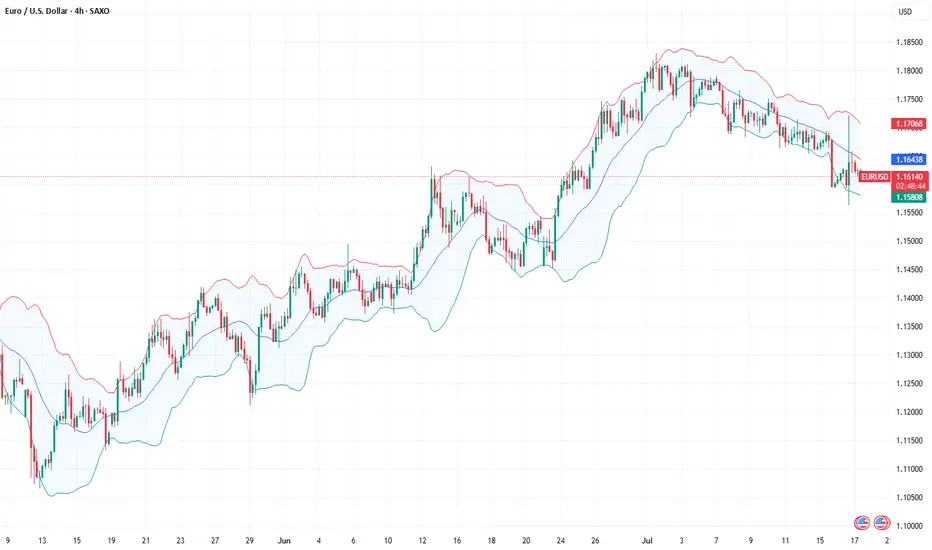
The price is testing a key resistance 1.161.
Taking into consideration the current market trend & overbought RSI, chances will be high to see a bearish movement to the downside at least to 1.155 level.
P.S
Please, note that an oversold/overbought condition can last for a long time, and therefore being oversold/overbought doesn't mean a price rally will come soon, or at all.
Disclosure: I am part of Trade Nation's Influencer program and receive a monthly fee for using their TradingView charts in my analysis.
Like and subscribe and comment my ideas if you enjoy them!
EURUSD
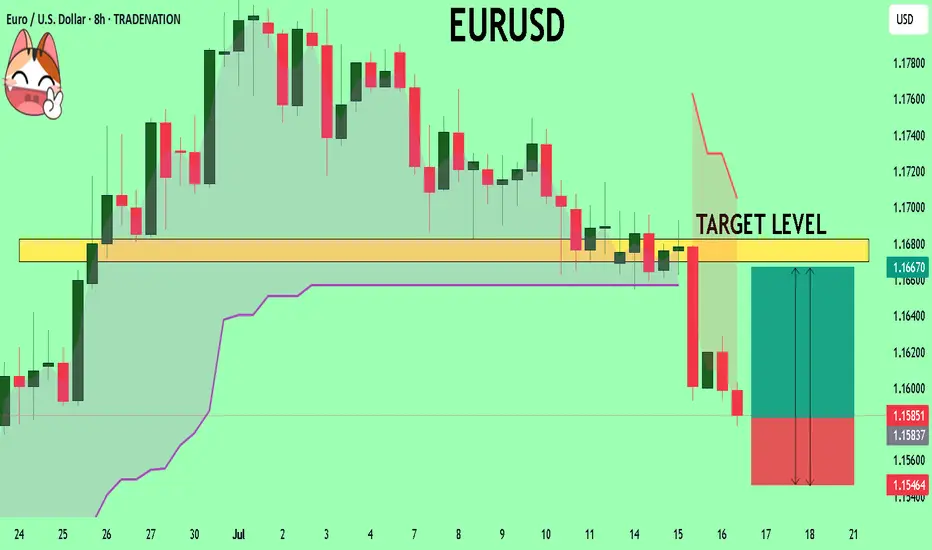
EURUSD Will Go Lower! Sell!
Here is our detailed technical review for EURUSD.
Time Frame: 4h
Current Trend: Bearish
Sentiment: Overbought (based on 7-period RSI)
Forecast: Bearish
The market is approaching a significant resistance area 1.168.
Due to the fact that we see a positive bearish reaction from the underlined area, I strongly believe that sellers will manage to push the price all the way down to 1.159 level.
P.S
Please, note that an oversold/overbought condition can last for a long time, and therefore being oversold/overbought doesn't mean a price rally will come soon, or at all.
Disclosure: I am part of Trade Nation's Influencer program and receive a monthly fee for using their TradingView charts in my analysis.
Like and subscribe and comment my ideas if you enjoy them!

EURUSD H1 I Bearish Reversal Based on the H1 chart, the price is approaching our sell entry level at 1.1641,an overlap resistance.
Our take profit is set at 1.1601, a pullback support.
The stop loss is set at 1.1670, a swing high resistance.
High Risk Investment Warning
Trading Forex/CFDs on margin carries a high level of risk and may not be suitable for all investors. Leverage can work against you.
Stratos Markets Limited (tradu.com ):
CFDs are complex instruments and come with a high risk of losing money rapidly due to leverage. 66% of retail investor accounts lose money when trading CFDs with this provider. You should consider whether you understand how CFDs work and whether you can afford to take the high risk of losing your money.
Stratos Europe Ltd (tradu.com ):
CFDs are complex instruments and come with a high risk of losing money rapidly due to leverage. 66% of retail investor accounts lose money when trading CFDs with this provider. You should consider whether you understand how CFDs work and whether you can afford to take the high risk of losing your money.
Stratos Global LLC (tradu.com ):
Losses can exceed deposits.
Please be advised that the information presented on TradingView is provided to Tradu (‘Company’, ‘we’) by a third-party provider (‘TFA Global Pte Ltd’). Please be reminded that you are solely responsible for the trading decisions on your account. There is a very high degree of risk involved in trading. Any information and/or content is intended entirely for research, educational and informational purposes only and does not constitute investment or consultation advice or investment strategy. The information is not tailored to the investment needs of any specific person and therefore does not involve a consideration of any of the investment objectives, financial situation or needs of any viewer that may receive it. Kindly also note that past performance is not a reliable indicator of future results. Actual results may differ materially from those anticipated in forward-looking or past performance statements. We assume no liability as to the accuracy or completeness of any of the information and/or content provided herein and the Company cannot be held responsible for any omission, mistake nor for any loss or damage including without limitation to any loss of profit which may arise from reliance on any information supplied by TFA Global Pte Ltd.
The speaker(s) is neither an employee, agent nor representative of Tradu and is therefore acting independently. The opinions given are their own, constitute general market commentary, and do not constitute the opinion or advice of Tradu or any form of personal or investment advice. Tradu neither endorses nor guarantees offerings of third-party speakers, nor is Tradu responsible for the content, veracity or opinions of third-party speakers, presenters or participants.

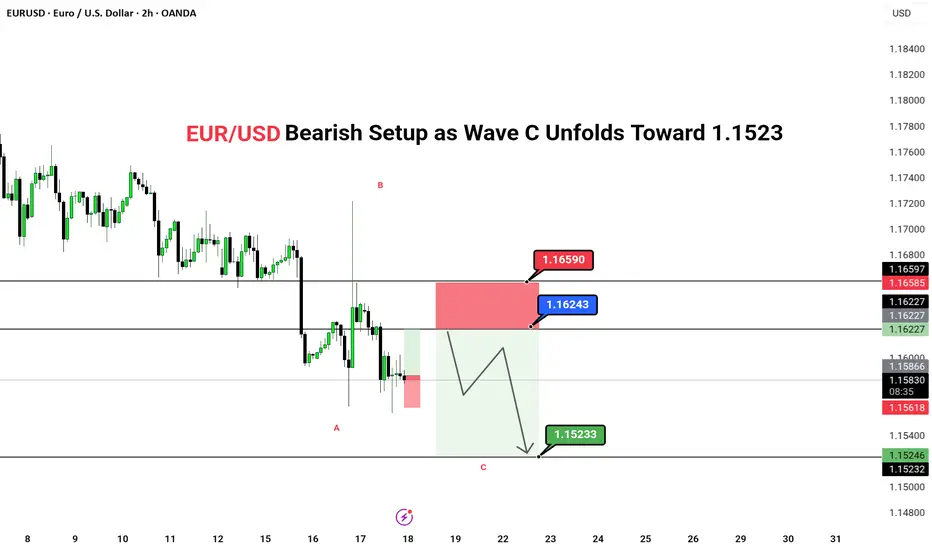
EUR/USD Bearish Setup as Wave C Unfolds Toward 1.1523EUR/USD Bearish Setup as Wave C Unfolds Toward 1.1523
🔴 SHORT BIAS
📅 Updated: July 18
---
🔍 Description
EUR/USD appears to be unfolding a classic ABC corrective structure, with Wave B now likely completed below the key 1.1624–1.1659 resistance zone. The price action has shown clear rejection in this supply area, opening room for Wave C to extend lower toward the 1.1523 target.
This setup aligns with a broader correction within a downtrend, with technicals and short-term flows pointing toward further downside pressure. The 2H timeframe offers swing traders a favorable risk-reward scenario, with invalidation clearly above 1.1659.
---
📊 Technical Structure (2H)
✅ Wave A completed
✅ Wave B rejected at resistance
✅ Wave C expected to unfold
📌 Downside Target
First & Final: 1.15233
🔻 Invalidation Zone
Above: 1.16590 (Break invalidates short bias)
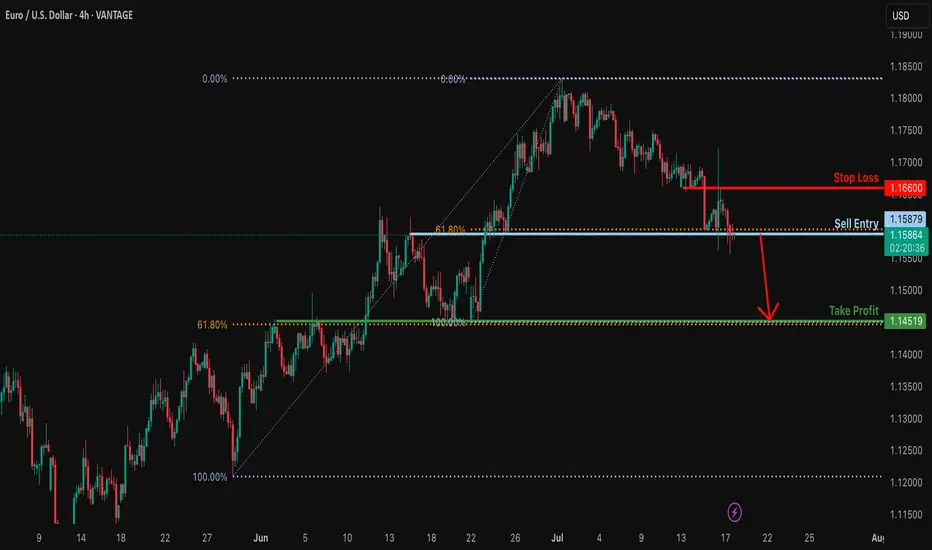
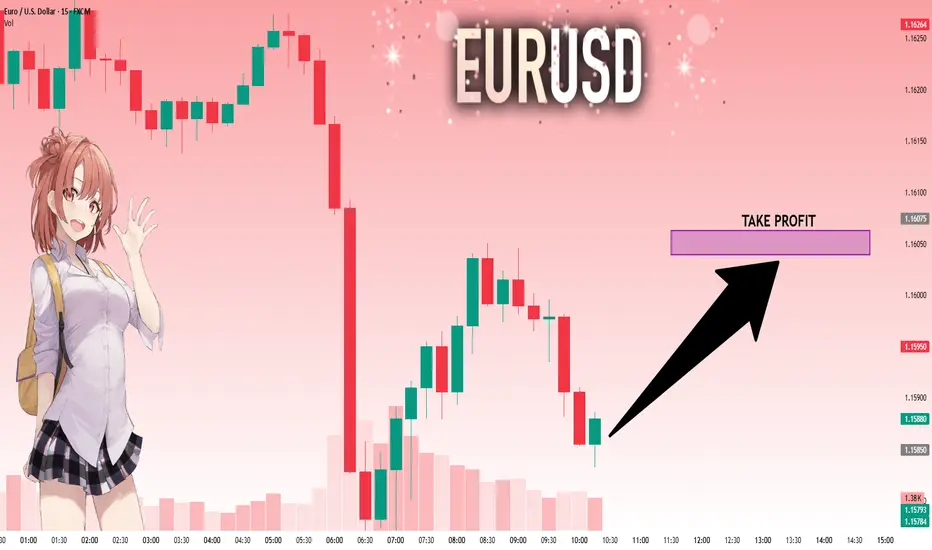
Bearish breakout off major support?EUR/USD is reacting off the support level which is an overlap support that lines up with the 61.8% Fibonacci retracement and a breakout of this level could lead the price to drop from this level to our take profit.
Entry: 1.1587
Why we like it:
There is an overlap support level that lines up with the 61.8% Fibonacci retracement.
Stop loss: 1.1666
Why we like it:
There is an overlap resistance.
Take profit: 1.1451
Why we like it:
There is an overlap support level that lines up with the 61.8% Fibonacci retracement.
Enjoying your TradingView experience? Review us!
Please be advised that the information presented on TradingView is provided to Vantage (‘Vantage Global Limited’, ‘we’) by a third-party provider (‘Everest Fortune Group’). Please be reminded that you are solely responsible for the trading decisions on your account. There is a very high degree of risk involved in trading. Any information and/or content is intended entirely for research, educational and informational purposes only and does not constitute investment or consultation advice or investment strategy. The information is not tailored to the investment needs of any specific person and therefore does not involve a consideration of any of the investment objectives, financial situation or needs of any viewer that may receive it. Kindly also note that past performance is not a reliable indicator of future results. Actual results may differ materially from those anticipated in forward-looking or past performance statements. We assume no liability as to the accuracy or completeness of any of the information and/or content provided herein and the Company cannot be held responsible for any omission, mistake nor for any loss or damage including without limitation to any loss of profit which may arise from reliance on any information supplied by Everest Fortune Group.
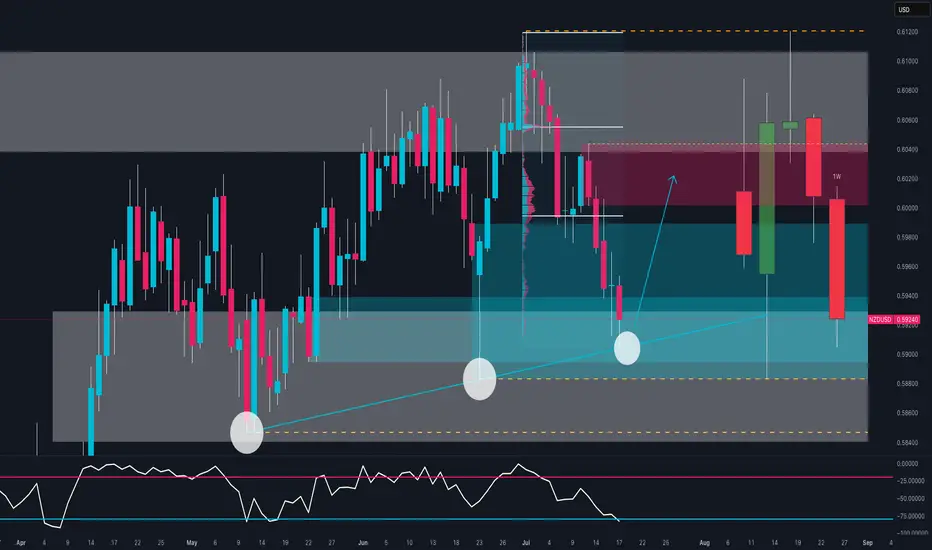
NZD/USD Ready to Explode? The Smart Money Is Making a MoveBias: Bullish Bounce from Key Demand Zone
NZD/USD is testing a strong confluence zone:
Long-term ascending trendline support
Weekly demand area between 0.5890 and 0.5940
Bullish RSI divergence near oversold conditions
The triple rejection wicks signal strong demand around 0.5900, suggesting a possible reversal toward the 0.6020–0.6050 resistance area.
🧠 COT Insight:
NZD: Non-commercial traders added +669 long contracts and reduced shorts by -102 → net bullish shift
USD: Net short exposure increases; total non-commercial shorts now exceed longs by ~4000 contracts
Implication: institutions are rotating into NZD while trimming USD exposure
📊 Sentiment:
86% of retail traders are long NZD/USD → retail sentiment is heavily skewed
This could delay or limit upside as smart money often moves counter to retail positions
📅 Seasonality (July):
July has historically been a bullish month for NZD/USD across all reference windows (20Y, 15Y, 10Y, 5Y, 2Y)
Average July return consistently positive → adds conviction to bullish thesis
🗺 Outlook:
If the zone at 0.5880–0.5920 holds, price may bounce toward 0.6020–0.6050.
Break below would invalidate structure and expose 0.5850 and then 0.5780.
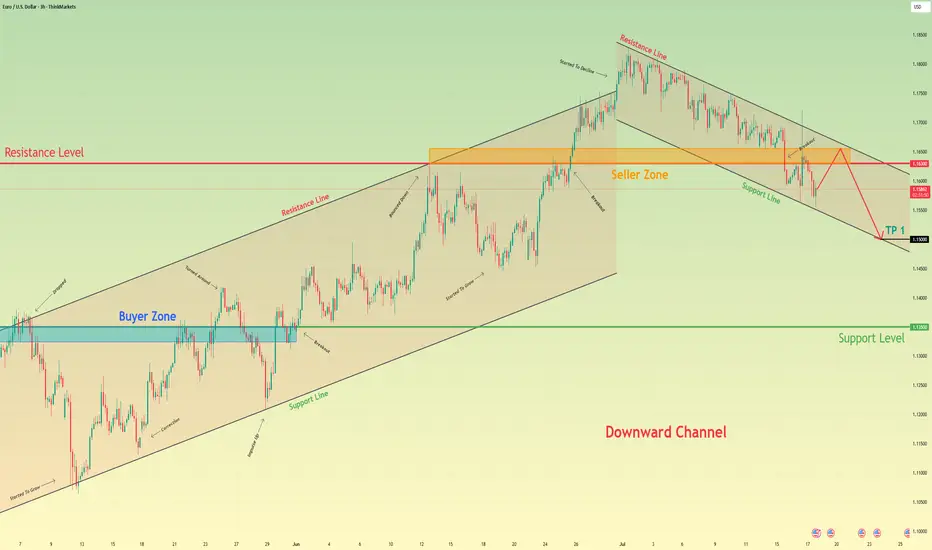
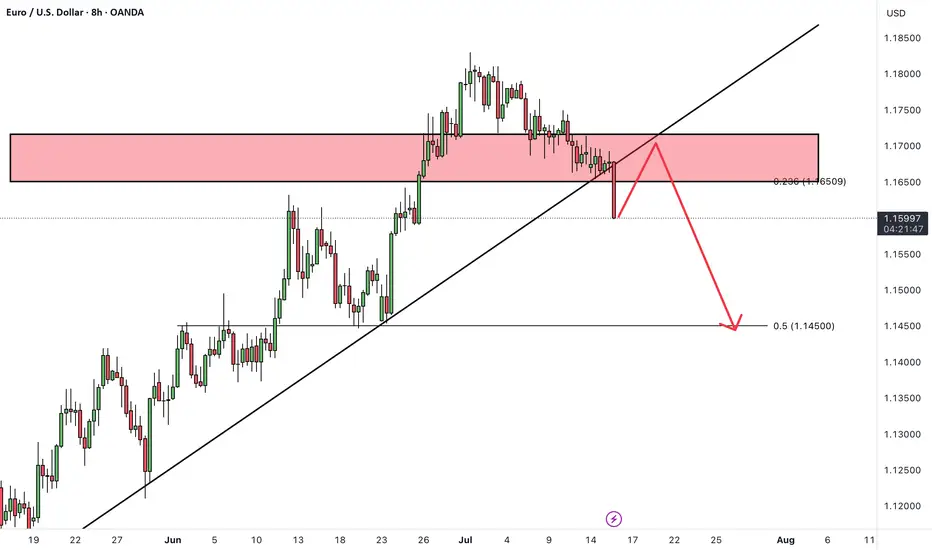
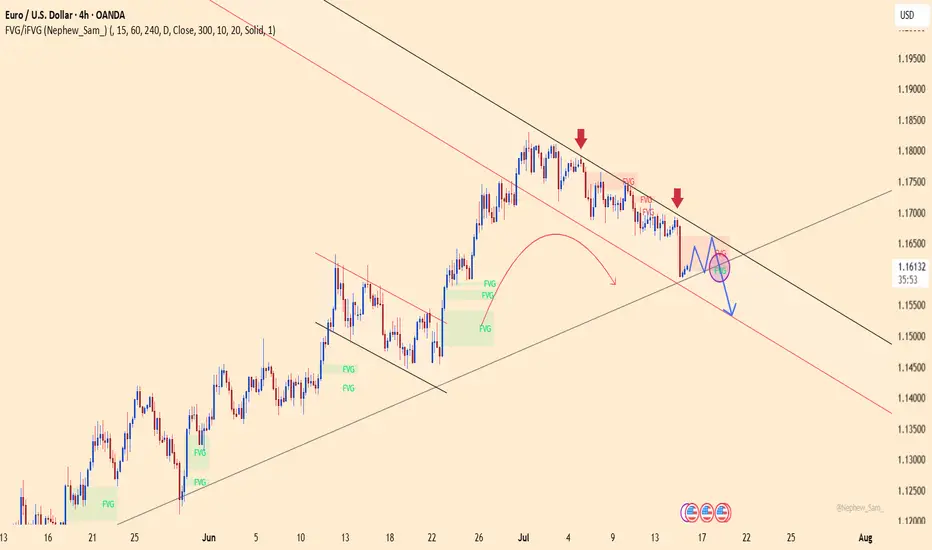
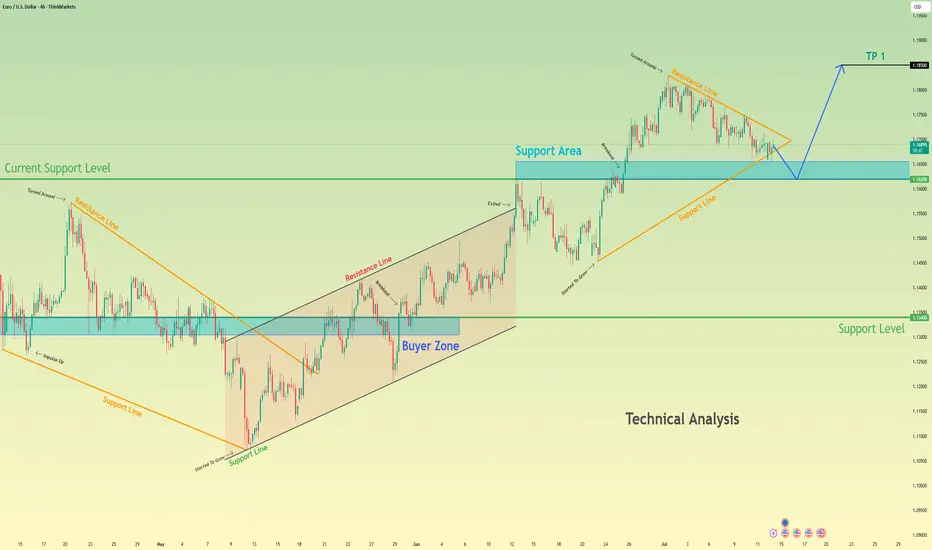
Euro may reach seller zone and then continue to fall in channelHello traders, I want share with you my opinion about Euro. The price pair has recently shifted its market structure, establishing a clear downward channel after breaking its previous uptrend. Before this breakdown, the price was consistently trading within an Upward Channel, repeatedly finding support in the buyer zone (1.1325–1.1350) and reversing upward. The bullish momentum eventually faded when the price failed to break the major horizontal resistance level at 1.1630. This failure triggered a strong bearish impulse, leading to a decisive breakout below the channel's support line and confirming a trend reversal. Currently, the price is making a corrective move up inside the newly formed downward channel, which appears to be a classic retest of the broken structure from below. I expect this upward move to stall as it approaches the heavy confluence of resistance formed by the channel's upper Resistance Line and the horizontal seller zone at 1.1630–1.1655. After testing this area, I anticipate a rejection and the beginning of a new bearish leg down. That's why I've set my TP at the 1.1500 level — it aligns perfectly with the support line of the current downward channel, making it a logical target for sellers. Please share this idea with your friends and click Boost 🚀
Disclaimer: As part of ThinkMarkets’ Influencer Program, I am sponsored to share and publish their charts in my analysis.
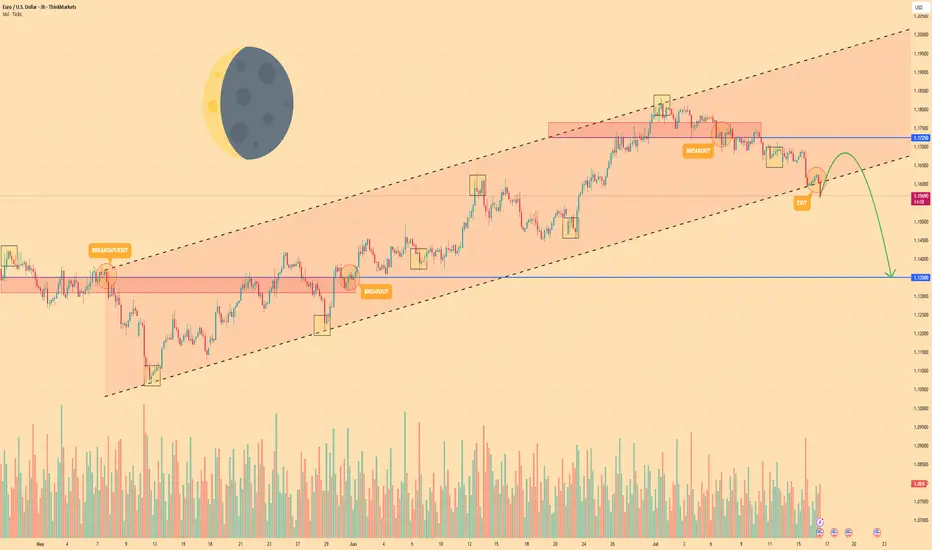
EURO - Price may drop to $1.1350 support level Hi guys, this is my overview for EURUSD, feel free to check it and write your feedback in comments👊
Euro began its journey by breaking into a rising channel off the swing low near $1.1080, establishing a clear uptrend.
Within this channel, price carved out steady support along the lower trendline, touching $1.1350 before buyers stepped.
Mid-channel, two breakout attempts at $1.1550 and $1.1725 highlighted bullish conviction, yet both retreated back below resistance.
Simultaneously, two exit signals appeared near the upper trendline around $1.1765, showing that upward momentum was losing steam at key inflection points.
Currently, EUR is holding just below the channel base after a minor bounce, consolidating as traders weigh the next move.
I foresee a brief climb toward near $1.1670 before a renewed bearish thrust drives price back down to test $1.1350 level.
If this post is useful to you, you can support me with like/boost and advice in comments❤️
Disclaimer: As part of ThinkMarkets’ Influencer Program, I am sponsored to share and publish their charts in my analysis.
EURUSD: Bulls Will Push
Balance of buyers and sellers on the EURUSD pair, that is best felt when all the timeframes are analyzed properly is shifting in favor of the buyers, therefore is it only natural that we go long on the pair.
Disclosure: I am part of Trade Nation's Influencer program and receive a monthly fee for using their TradingView charts in my analysis.
❤️ Please, support our work with like & comment! ❤️
EURUSDHello Traders! 👋
What are your thoughts on EURUSD?
EURUSD has broken support level and its ascending trendline, indicating a possible shift in short-term market structure and growing bearish pressure.
In the short term, we expect a pullback toward the broken support/trendline zone.
If price fails to reclaim this level, a continued move lower toward the next identified support zone is likely.
As long as price remains below the broken structure, the short-term outlook stays bearish.
Don’t forget to like and share your thoughts in the comments! ❤️
EURUSD: Target Is Up! Long!
My dear friends,
Today we will analyse EURUSD together☺️
The recent price action suggests a shift in mid-term momentum. A break above the current local range around 1.15850 will confirm the new direction upwards with the target being the next key level of 1.16039 and a reconvened placement of a stop-loss beyond the range.
❤️Sending you lots of Love and Hugs❤️
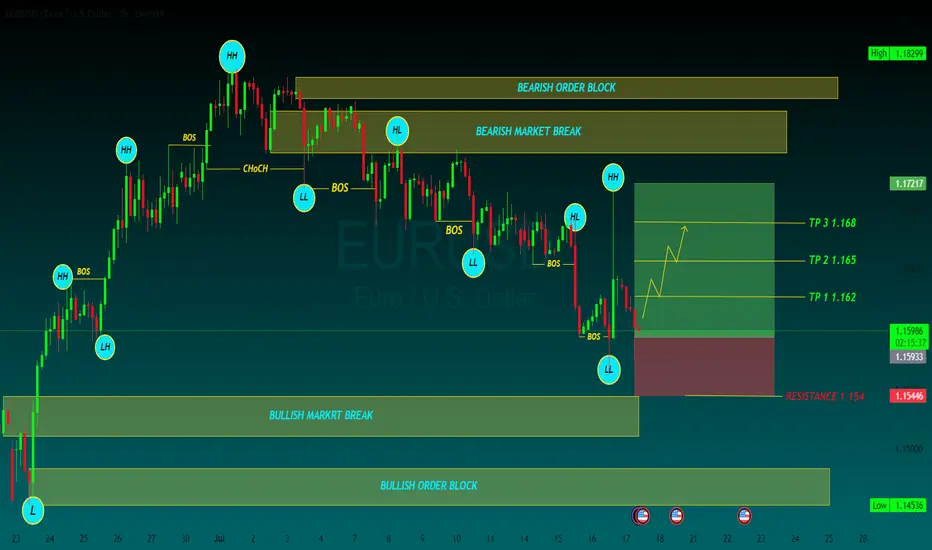
EURUSD BUYThe EUR/USD pair edged lower in the past week, settling a handful of pips below the 1.1700 mark, further retreating from the multi-year peak posted early in July at 1.1830. Financial markets kept revolving around the United States (US) President Donald Trump's targets. With geopolitical woes cooling down, Trump’s focus returned to tariffs, and the Federal Reserve’s (Fed) wait-and-see stance on monetary policy.
Trump fixated on tariffs and Powell
Since the week started, speculative interest kept their eyes on the July 9 tariffs deadline. Trump announced massive retaliatory levies on over 180 trading partners in May, quickly establishing a 90-day grace period afterwards. His goal was to clinch better trade deals with all these nations. But as the date loomed, deals were scarce. The US made some trade arrangements with some minor economies, such as Vietnam, but there were none with major counterparts, nor, of course, with China
TP 1 1.162
TP 2 1.165
TP 3 1.168
RESISTANCE 1.154
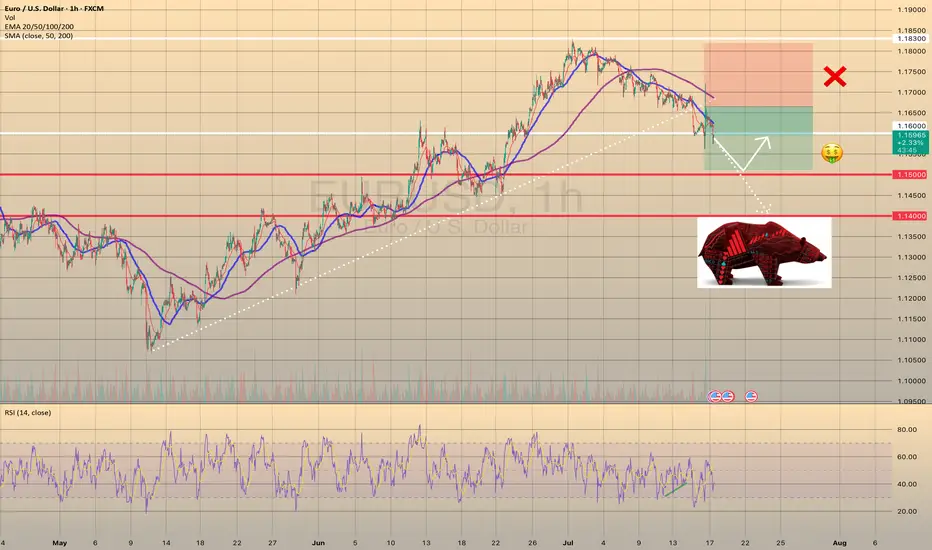
EURUSD - BEARISH TREND CONTINUESEURUSD - BEARISH TREND CONTINUES📉
On Tuesday, despite the bullish divergence (highlighted as green on RSI), the price broke through the trendline, formed since the beginning of May. Yesterday this trendline got retested on Bloomberg's rumor that Powell may resign. Currently the price is going through the support level of 1.16000.
I see the major way is to go towards 1.15000 support level with a further rebound and possible target of 1.16000. Another option is to go straight towards 1.14000. Will see.
Fundamental Market Analysis for July 17, 2025 EURUSDThe euro is edging back toward the 1.16 – 1.17 range highs after headlines suggesting former U.S. president Donald Trump might try to dismiss Fed Chair Jerome Powell and a softer-than-expected U.S. Producer Price Index (PPI) print pressured the dollar. Political noise around the Fed’s independence, coupled with a cooling inflation pulse, has pushed market pricing toward a longer policy pause; the pair is hovering near 1.16250 at the time of writing.
Fundamental support also stems from the upcoming 24 July ECB meeting. Governing-Council commentary reveals a split between hawks and would-be doves, yet consensus that euro-area inflation remains above target makes an aggressive rate cut unlikely for now. Meanwhile, subdued U.S. Treasury yields—futures price a 95 % probability of no change this month and only 50 bp of total easing over 12 months—help narrow the U.S.–German 10-year spread to about 150 bp.
Against a backdrop of ongoing U.S. trade tensions and steady inflows into euro-area assets, that narrower spread leaves room for EURUSD to grind toward the 1.1680 target if sentiment stays risk-positive.
Trading recommendation: BUY 1.16250, SL 1.15950, TP 1.16800
EURUSD Forming Bullish Continuation SetupEURUSD is currently retesting a key breakout zone that previously acted as resistance and is now serving as strong support around the 1.1620–1.1630 area. After a healthy bullish impulse in recent weeks, the pair is pulling back in a controlled manner, likely forming a bullish continuation setup. I entered from earlier levels and remain confident in a further upward move, with the structure showing signs of a new bullish wave forming.
From a fundamental perspective, the euro is gaining strength as the European Central Bank (ECB) continues to signal a more cautious stance on rate cuts compared to the Federal Reserve. US inflation data released last week came in softer than expected, increasing speculation that the Fed could start its rate-cutting cycle as early as September. This shift in monetary policy outlook has weighed on the US dollar, opening up room for EURUSD to push higher.
Additionally, eurozone macro data is showing early signs of recovery, especially in Germany, where industrial production and sentiment indicators are slowly improving. As inflation in Europe trends lower but remains sticky, the ECB has fewer reasons to rush into easing, which adds strength to the euro over the medium term. This divergence is a critical driver of the current bullish sentiment in EURUSD.
Technically, the market is respecting a clean demand zone, with momentum indicators starting to flatten after the recent correction. With the trend structure intact and fundamentals aligned, I'm targeting the 1.2180–1.2200 zone as the next leg of this bullish cycle. Price action remains favorable, and the broader sentiment on TradingView is also increasingly bullish, confirming my conviction in this setup.

EURUSD – Weakness emerges at descending channel resistanceEURUSD remains within a well-defined descending channel and was recently rejected at the upper trendline – a key dynamic resistance zone. Price action shows the recovery is limited around 1.16600, with multiple FVG (Fair Value Gap) zones reinforcing the potential for further downside.
On the news front, the euro remains under pressure as Eurozone inflation data brought no surprises, while the US dollar is supported by June’s PPI rising exactly as expected at 0.2%. This combination leaves EURUSD with little momentum to break higher, making a move back toward the 1.15300 support area a scenario to watch.
If the price fails to break above 1.16600 and forms a lower high, the bearish trend will be further confirmed. Keep an eye on price behavior around the FVG zones to identify optimal entry points.
GOLD Set for Big Move? | Key Zones + CPI Impact Explained !Gold Analysis – Key Levels + CPI Outlook!
In this video, I broke down the recent rejection from the $3366–$3369 resistance zone, the drop to $3346, and current price action around $3357.
We’ll also look ahead at what to expect with the upcoming CPI report — and how it could shape gold’s next big move.
📌 I’ve covered both bullish and bearish scenarios, shared key demand/supply zones, and outlined possible targets.
👉 For full context and trading strategy, make sure to watch the video till the end — and don’t forget to drop your opinion in the comments:
Do you think gold will break $3380 next, or are we headed for another pullback?
THE MAIN ANALYSIS :

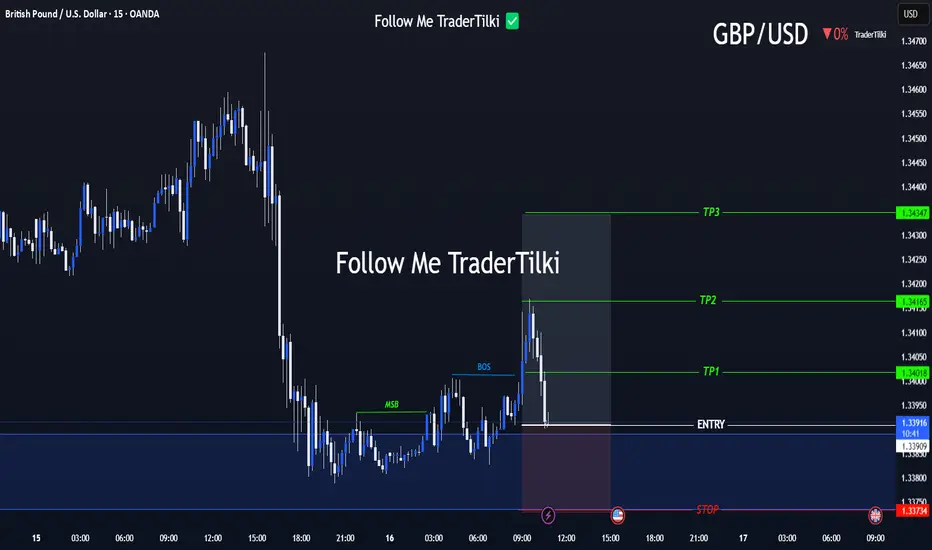
Strategic Entry, Clear Targets: The GBPUSD Game Plan Is Set📢 Hello Guys,
I've prepared a fresh GBPUSD signal for you:
🟢 Entry Level: 1.33918
🔴 Stop Loss: 1.33734
🎯 TP1: 1.34018
🎯 TP2: 1.34165
🎯 TP3: 1.34347
📈 Risk/Reward Ratio: 2,40
------
Your likes and support are what keep me motivated to share these analyses consistently.
Huge thanks to everyone who shows love and appreciation! 🙏
EURUSD Under Pressure After Hot CPI – More Downside Ahead?Today, the US released key inflation figures :
Core CPI m/m: 0.2% (vs 0.3% forecast)
CPI m/m: 0.3% (as expected)
CPI y/y: 2.7% (vs 2.6% forecast, up from 2.4%)
Fundamental Analysis ( EURUSD ):
The slightly lower Core CPI suggests some easing in underlying inflation pressures. However, the headline CPI y/y came in hotter than expected at 2.7%, reinforcing the idea that the Fed is not yet ready to ease policy aggressively.
This combination supports the US dollar, as sticky inflation could delay rate cuts.
EURUSD is likely to remain under pressure in the short term unless the ECB signals a more hawkish stance or US data starts showing broader weakness.
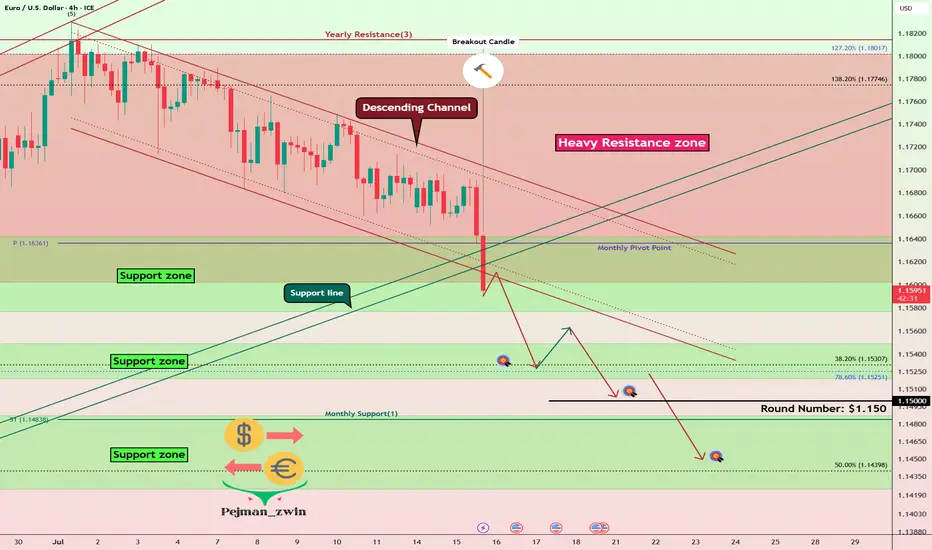
Now let's move on to the technical analysis of EURUSD ( FX:EURUSD ) on the 4-hour timeframe .
EURUSD is trading in a Heavy Resistance zone($1.1802-$1.1602) , having simultaneously managed to break the Support lines and the lower line of the Descending Channel , and is also trying to break the Support zone($1.1642-$1.1578) .
I expect EURUSD to continue its downtrend and decline to the Support zone($1.1549-$1.1520) at the first target .
Second target : $1.15043
Third target : $1.1464
Note: Stop Loss(SL)= $1.1660
Please respect each other's ideas and express them politely if you agree or disagree.
Euro/U.S. Dollar Analyze (EURUSD), 1-hour time frame.
Be sure to follow the updated ideas.
Do not forget to put a Stop loss for your positions (For every position you want to open).
Please follow your strategy and updates; this is just my Idea, and I will gladly see your ideas in this post.
Please do not forget the ✅' like '✅ button 🙏😊 & Share it with your friends; thanks, and Trade safe.
Market Outlook - Trump Questions Powell’s Job - Gold RalliesNordKern active market outlook, reacting to the latest news.
Market Alert | Trump Questions Powell’s Job - Gold Rallies, Dollar Slips
Jul 16 2025 16:56:19 CET: CBS CITING SOURCES:
TRUMP ASKED REPUBLICAN LAWMAKERS IF HE SHOULD FIRE FED'S POWELL
Market Reaction:
OANDA:XAUUSD +$45/oz intraday, currently trading near session highs.
Safe-haven demand and inflation hedge as Fed credibility is questioned.
TVC:DXY Weakens notably against both the TVC:EXY and the TVC:JXY
Markets pricing in higher political risk premium, potential dovish tilt under Trump.
Volatility: Spiking across FX and commodities. VIX and MOVE indexes also showing upward pressure.
Context Matters:
While the Fed Chair cannot be dismissed without cause, even the suggestion of removal injects significant uncertainty into the macro backdrop. Historically, markets react negatively to perceived threats to Fed autonomy (see: Nixon-Burns, Trump-Powell 2018). This development comes just months before the U.S. election, adding a new layer of complexity for macro traders.
What to Watch:
- Fed Speakers: Any defense of Powell or pushback could stabilize markets. Or not.
- Trump Campaign Statements: Will he double down or walk it back?
- Upcoming Data: A dovish-leaning CPI/Jobs print could supercharge gold and further weigh on the dollar.
- Volatility: Traders should adjust position sizing and risk accordingly.
Increased geopolitical and monetary risk are back on the table. Traders should remain nimble, reduce leverage where appropriate, and stay alert to headline risk. Gold and FX are likely to remain reactive into the US session.
NordKern
Euro may fall to support area and then start to growHello traders, I want share with you my opinion about Euro. The price previously moved inside a wedge formation, where it tested the buyer zone and showed a strong reaction from this area. After that, the pair broke out upward and started to trade inside an upward channel, building momentum and forming a clear bullish structure. Later, the price created a pennant pattern, often considered a continuation signal. But before continuing the upward trend, I expect the Euro to first exit from the pennant and decline toward the support area. This zone was previously resistantce, and now it may turn into a strong support. Now the price is trading near the pennant resistance, but I don’t expect a breakout right away. The market needs to correct before it resumes the uptrend. Once the price reaches the current support level or slightly lower, it may find demand again and bounce. That’s why I expect the Euro to retest the support zone and then grow further toward TP 1 - 1.1850 points. This target aligns with the upper border of the upward channel and would complete the continuation move after the pennant breakout. Given the previous structure, bullish momentum, and patterns on the chart, I remain bullish after the correction and expect the price to rise from the support zone. Please share this idea with your friends and click Boost 🚀
Disclaimer: As part of ThinkMarkets’ Influencer Program, I am sponsored to share and publish their charts in my analysis.
EURUSD: The Market Is Looking Down! Short!
My dear friends,
Today we will analyse EURUSD together☺️
The in-trend continuation seems likely as the current long-term trend appears to be strong, and price is holding below a key level of 1.15850 So a bearish continuation seems plausible, targeting the next low. We should enter on confirmation, and place a stop-loss beyond the recent swing level.
❤️Sending you lots of Love and Hugs❤️
EURUSD My Opinion! BUY!
My dear friends,
Please, find my technical outlook for EURUSD below:
The price is coiling around a solid key level - 1.1584
Bias - Bullish
Technical Indicators: Pivot Points Low anticipates a potential price reversal.
Super trend shows a clear buy, giving a perfect indicators' convergence.
Goal - 1.1670
Safe Stop Loss - 1.1546
About Used Indicators:
The pivot point itself is simply the average of the high, low and closing prices from the previous trading day.
Disclosure: I am part of Trade Nation's Influencer program and receive a monthly fee for using their TradingView charts in my analysis.
———————————
WISH YOU ALL LUCK