EURUSD Remains Under Pressure Following CPIThis morning, after the US CPI report was released at 8:30 AM EDT, EUR/USD surged briefly due to a slightly weaker-than-expected inflation reading. Despite this, signs of rising inflation persisted, leading EUR/USD to rise sharply before quickly retreating.
EUR/USD has seen an intermediate top at 1.1830 since early July. The euro is under pressure due to looming US tariffs (30% on EU imports, effective August 1) and mixed economic signals, like Eurozone industrial production rising 1.7% in May (vs. 0.9% expected). The pound (GBP) and other currencies are also reacting to tariff concerns.
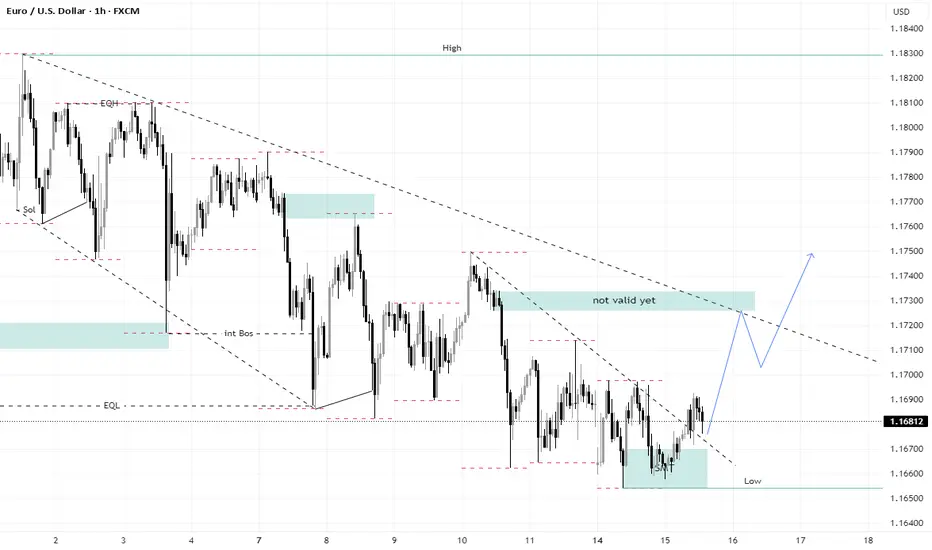
Taking a look at the 1hour chart, you can see we are still trading below a descending trendline. Taking everything into consideration, I'm positioning short sells whenever we get bounce higher.
That's it - That's all - Trade Safe
EURUSD

GBP/USD could be gearing up for a 200-pip move?Start: We jump in at 1.3601 if it’s going up or filling the gap, or 1.3599 if it might drop.
Goal: We aim for 1.3800 if it goes up, or 1.3404 if it goes down.
Safety Stop: Like a safety net, we stop if it drops to 1.3544 (up plan) or rises to 1.3650 (down plan).
Chance: These are best guesses based on the chart’s clues!

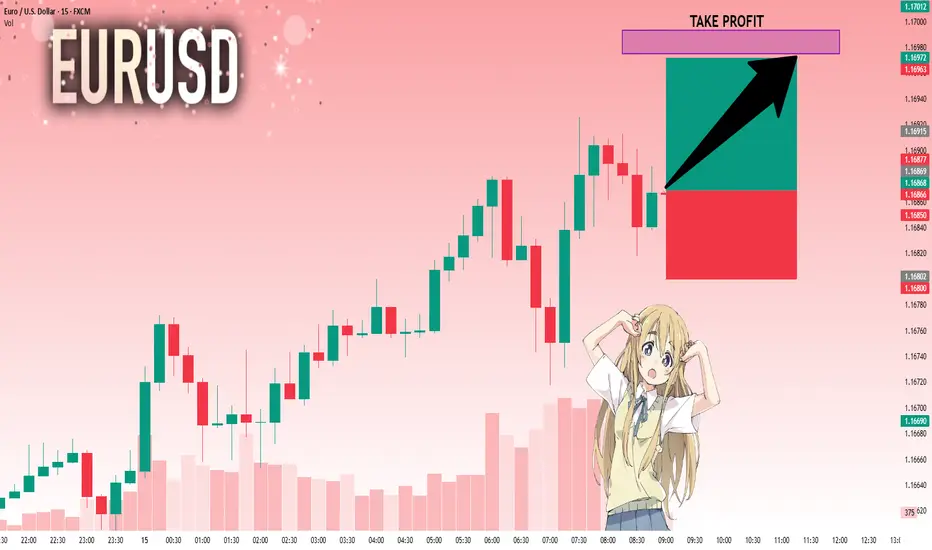
EURUSD Good buy opportunityTime to buy EURUSD with CPI
EURUSD has broken the Trend Line liquidity and is ready to continue the upward trend.
EURUSD Bullish continuation supported 1.1640The EURUSD currency pair continues to exhibit a bullish price action bias, supported by a sustained rising trend. Recent intraday movement reflects a sideways consolidation breakout, suggesting potential continuation of the broader uptrend.
Key Technical Level: 1.1640
This level marks the prior consolidation range and now acts as pivotal support. A corrective pullback toward 1.1640 followed by a bullish rejection would reinforce the bullish trend, targeting the next resistance levels at:
1.1830 – Near-term resistance
1.1900 – Minor swing high
1.1940 – Longer-term bullish objective
On the other hand, a decisive daily close below 1.1640 would invalidate the bullish setup, shifting the outlook to bearish in the short term. This could trigger a deeper retracement toward:
1.1590 – Initial support
1.1530 – Key downside target
Conclusion:
As long as 1.1640 holds as support, the technical outlook remains bullish, favoring long positions on dips. A confirmed break below this level would signal a shift in sentiment and open the door to a corrective pullback phase.
This communication is for informational purposes only and should not be viewed as any form of recommendation as to a particular course of action or as investment advice. It is not intended as an offer or solicitation for the purchase or sale of any financial instrument or as an official confirmation of any transaction. Opinions, estimates and assumptions expressed herein are made as of the date of this communication and are subject to change without notice. This communication has been prepared based upon information, including market prices, data and other information, believed to be reliable; however, Trade Nation does not warrant its completeness or accuracy. All market prices and market data contained in or attached to this communication are indicative and subject to change without notice.

EURUSD: Move Up Expected! Long!
My dear friends,
Today we will analyse EURUSD together☺️
The market is at an inflection zone and price has now reached an area around 1.16869 where previous reversals or breakouts have occurred.And a price reaction that we are seeing on multiple timeframes here could signal the next move up so we can enter on confirmation, and target the next key level of 1.16975.Stop-loss is recommended beyond the inflection zone.
❤️Sending you lots of Love and Hugs❤️
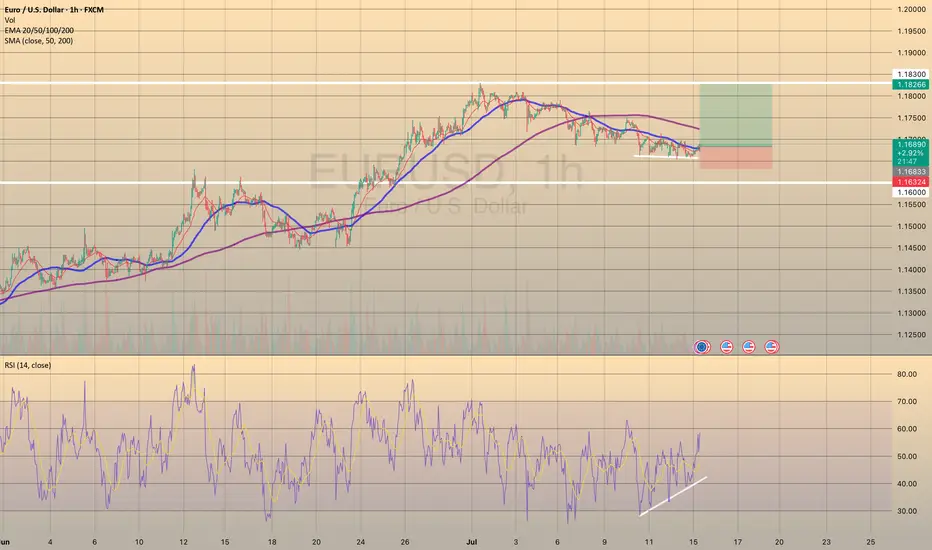
EURUSD SEEMS TO FIND SUPPORT
TRADING IDEA UPDATE - EURUSD SEEMS TO FIND SUPPORT🦾
EURUSD seems to find support on a trendline and shows us divergence on RSI on 1-h timeframe. So, I decided to close my trade in advance before my stop loss gets triggered and open long position with a
🔼 a market buy order at 1.16833 with
❌a stop loss at 1.16324 and
🤑a take profit at 1.18266
Additionally, today is the U.S. CPI report data coming out. Market expects the annual inflation to be around 2.7%. Me, personally, think that actual June inflation will be a bit lower, which may provide some fundamental support to the EURUSD. Will see.
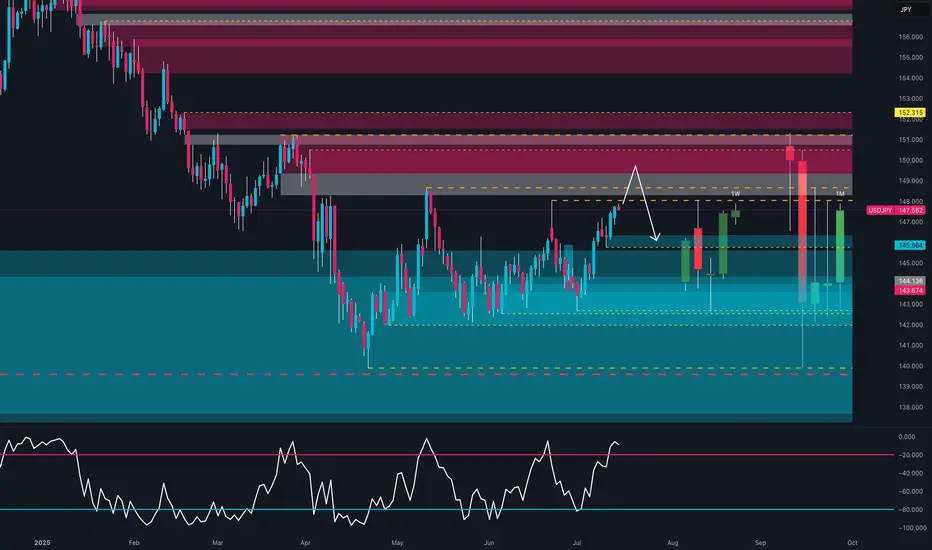
USDJPY – Tactical Short in Weekly Supply or Bullish Breakout?COT & MACRO FLOW (Commitment of Traders)
USD INDEX
Non-commercials still biased short: Longs 16,208 vs Shorts 20,194 (slightly improved, but still negative).
Commercials remain net long, but the open interest is declining → no strong conviction from smart money.
JPY
Non-commercials added significantly to their short exposure (+6,751), while cutting longs (-4,432).
Commercials also cut long exposure heavily (-20,405).
The structure shows institutional bias is clearly bearish on JPY.
Conclusion: JPY weakness confirmed by both commercial and non-commercial flows. USD slightly weaker, but JPY is weaker → supports USDJPY bullish bias.
SEASONALITY (JULY)
USD/JPY tends to be weak in July across most historical averages (5y, 10y, 15y, 20y).
July is historically bearish for USDJPY, especially in the second half of the month.
This seasonality contrasts with COT flows → mixed bias.
RETAIL SENTIMENT
60% of retail traders are SHORT → supports contrarian long view.
Retail volume shows imbalance in positioning, another contrarian bullish signal.
📈 TECHNICAL ANALYSIS (DAILY CHART)
Price is testing a key weekly FVG zone between 148.4 and 149.2.
RSI has re-entered the overbought region, suggesting potential exhaustion.
Price bounced from the monthly bullish order block (143.5–144.0).
A clear move above 149.50 could invalidate short setups.
🧩 TRADE IDEA (SETUP)
Watch for price to retest 148.4–149.50 zone and react.
RSI divergence + seasonality could offer a short opportunity with confirmation (e.g. engulfing on Daily/H4).
If price breaks above 149.5 with volume → look for continuation to 152.00.
✅ FINAL BIAS
Macro and institutional flows remain in favor of USDJPY longs, but:
Seasonality turns bearish in the second half of July
Price is reaching strong resistance
Retail sentiment supports the long thesis
→ Tactical Short from 149-150 only with confirmation. Otherwise, long continuation above 150.
EURUSD – Bearish Pressure Mounts Ahead of Triangle Breakout EURUSD is trading within a contracting triangle and currently leans toward a bearish bias. After several failed attempts to break the upper boundary, momentum is weakening, and the pair is showing signs of a potential breakdown toward lower support levels.
With several key events ahead, the euro may face additional pressure if upcoming Eurozone inflation data disappoints or if the Fed maintains a hawkish tone through upcoming speeches by U.S. officials. Unless there is a strong bullish catalyst, EURUSD is likely to correct further to the downside.
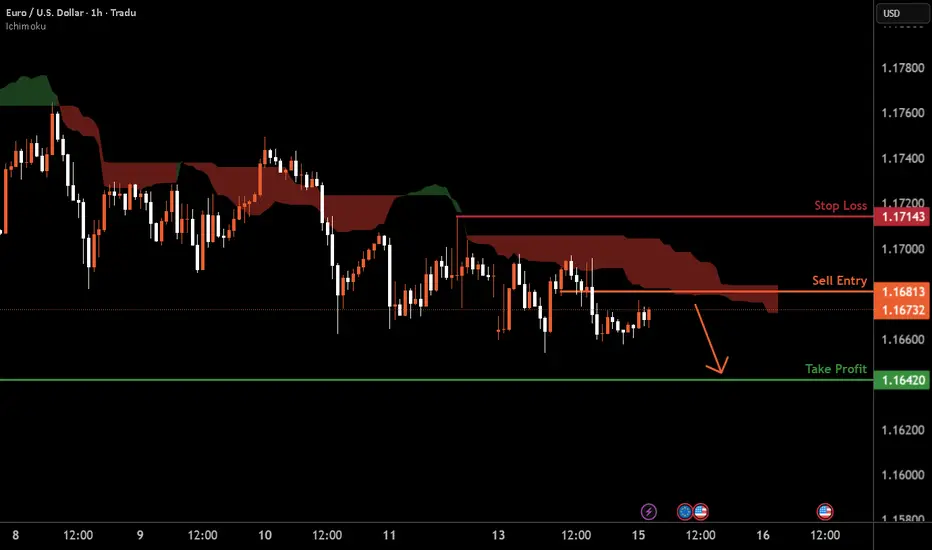
EURUSD H1 I Bearish Reversal Based on the H1 chart analysis, we can see that the price is rising toward our sell entry at 1.1681, which is a pullback resistance.
Our take profit will be at .1642, an overlap support level.
The stop loss will be placed at 1.1714, a swing-high resistance level.
High Risk Investment Warning
Trading Forex/CFDs on margin carries a high level of risk and may not be suitable for all investors. Leverage can work against you.
Stratos Markets Limited (tradu.com ):
CFDs are complex instruments and come with a high risk of losing money rapidly due to leverage. 63% of retail investor accounts lose money when trading CFDs with this provider. You should consider whether you understand how CFDs work and whether you can afford to take the high risk of losing your money.
Stratos Europe Ltd (tradu.com ):
CFDs are complex instruments and come with a high risk of losing money rapidly due to leverage. 63% of retail investor accounts lose money when trading CFDs with this provider. You should consider whether you understand how CFDs work and whether you can afford to take the high risk of losing your money.
Stratos Global LLC (tradu.com ):
Losses can exceed deposits.
Please be advised that the information presented on TradingView is provided to Tradu (‘Company’, ‘we’) by a third-party provider (‘TFA Global Pte Ltd’). Please be reminded that you are solely responsible for the trading decisions on your account. There is a very high degree of risk involved in trading. Any information and/or content is intended entirely for research, educational and informational purposes only and does not constitute investment or consultation advice or investment strategy. The information is not tailored to the investment needs of any specific person and therefore does not involve a consideration of any of the investment objectives, financial situation or needs of any viewer that may receive it. Kindly also note that past performance is not a reliable indicator of future results. Actual results may differ materially from those anticipated in forward-looking or past performance statements. We assume no liability as to the accuracy or completeness of any of the information and/or content provided herein and the Company cannot be held responsible for any omission, mistake nor for any loss or damage including without limitation to any loss of profit which may arise from reliance on any information supplied by TFA Global Pte Ltd.
The speaker(s) is neither an employee, agent nor representative of Tradu and is therefore acting independently. The opinions given are their own, constitute general market commentary, and do not constitute the opinion or advice of Tradu or any form of personal or investment advice. Tradu neither endorses nor guarantees offerings of third-party speakers, nor is Tradu responsible for the content, veracity or opinions of third-party speakers, presenters or participants.
Market Watch UPDATES! FOREX Major PairsWelcome to the Market Watch Updates for Monday, July 14th.
In this video, we will give the forecast updates for the following markets:
USD Index, EURUSD, GBPUSD, AUDUSD, NZDUSD, USDCAD, USDCHF and USDJPY.
Enjoy!
May profits be upon you.
Leave any questions or comments in the comment section.
I appreciate any feedback from my viewers!
Like and/or subscribe if you want more accurate analysis.
Thank you so much!
Disclaimer:
I do not provide personal investment advice and I am not a qualified licensed investment advisor.
All information found here, including any ideas, opinions, views, predictions, forecasts, commentaries, suggestions, expressed or implied herein, are for informational, entertainment or educational purposes only and should not be construed as personal investment advice. While the information provided is believed to be accurate, it may include errors or inaccuracies.
I will not and cannot be held liable for any actions you take as a result of anything you read here.
Conduct your own due diligence, or consult a licensed financial advisor or broker before making any and all investment decisions. Any investments, trades, speculations, or decisions made on the basis of any information found on this channel, expressed or implied herein, are committed at your own risk, financial or otherwise.

LONG | EUR/USD | 1DCurrent Level: ~1.1662
Revised Entry Zone: 🔄 Buy the dip around 1.1660–1.1670
This aligns with 50-day EMA and daily/4H pivot (~1.1630–1.1670) acting as support.
Stop Loss: 1.1630 (just below 50 EMA & recent low)
Target: 1.1750 → 1.1800 (range high/resistance)
Risk:Reward: ~1:3.8
✅ Institutional Rationale:
Momentum remains bullish, though momentum indicators are cooling—price retesting structural support (mid-BB, pivot zone).
Weekly outlook still favors bulls while above 1.1637–1.1670—suggesting accumulated buy orders in this zone.
Event risk: U.S. employment and Fed speakers imminent—creates ideal buy-on-dip opportunities with tight stops.
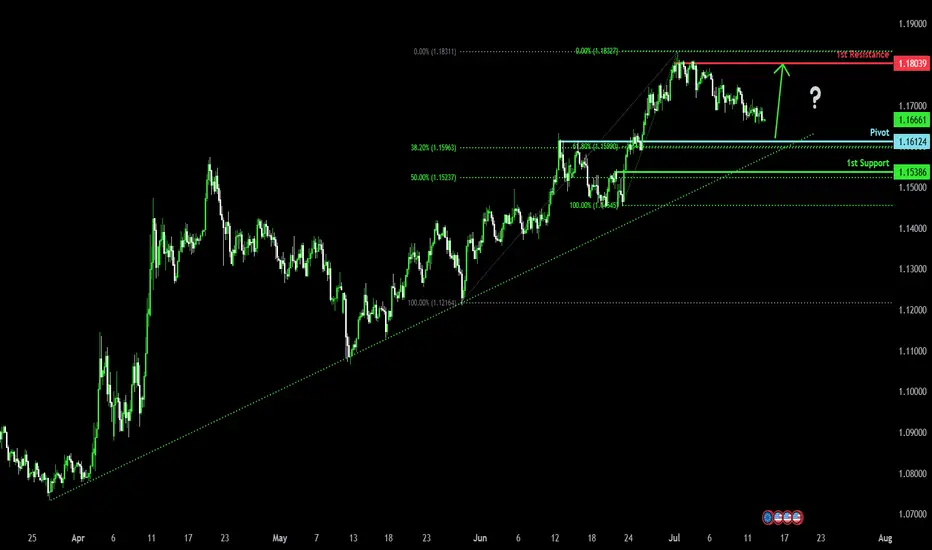
Bullish bounce for the Fiber?The price is falling towards the pivot, which acts as a pullback support and could bounce to the 1st resistance, a swing high resistance.
Pivot: 1.1612
1st Support: 1.1538
1st Resistance: 1.1803
Risk Warning:
Trading Forex and CFDs carries a high level of risk to your capital and you should only trade with money you can afford to lose. Trading Forex and CFDs may not be suitable for all investors, so please ensure that you fully understand the risks involved and seek independent advice if necessary.
Disclaimer:
The above opinions given constitute general market commentary, and do not constitute the opinion or advice of IC Markets or any form of personal or investment advice.
Any opinions, news, research, analyses, prices, other information, or links to third-party sites contained on this website are provided on an "as-is" basis, are intended only to be informative, is not an advice nor a recommendation, nor research, or a record of our trading prices, or an offer of, or solicitation for a transaction in any financial instrument and thus should not be treated as such. The information provided does not involve any specific investment objectives, financial situation and needs of any specific person who may receive it. Please be aware, that past performance is not a reliable indicator of future performance and/or results. Past Performance or Forward-looking scenarios based upon the reasonable beliefs of the third-party provider are not a guarantee of future performance. Actual results may differ materially from those anticipated in forward-looking or past performance statements. IC Markets makes no representation or warranty and assumes no liability as to the accuracy or completeness of the information provided, nor any loss arising from any investment based on a recommendation, forecast or any information supplied by any third-party.
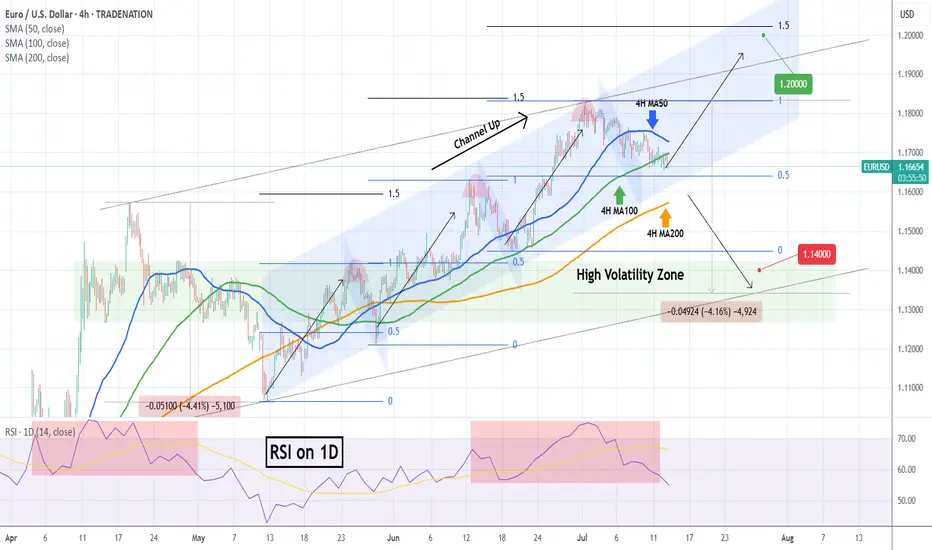
EURUSD The 4H MA200 distinguishes bullish from bearish.The EURUSD pair has been trading within a (blue) 2-month Channel Up since the May 12 Low and it just broke below its 4H MA100 (green trend-line). The previous two Bearish Legs of this pattern bottomed (made a Higher Low) on or just above the 0.5 Fibonacci retracement level.
As a result, the price is very close to the most optimal buy level of this pattern and as long as it holds, we expect to start the new Bullish Leg and target the 1.5 Fibonacci extension (1.20000 our Target just below), which is in line with the previous two Bullish Legs.
If however the 4H MA200 (orange trend-line) breaks, we will take the loss on that long and go short as technically the price should seek the bottom of the (dotted) wider Channel Up. Our Target on that occasion will be 1.14000, right at the top of the High Volatility Zone.
-------------------------------------------------------------------------------
** Please LIKE 👍, FOLLOW ✅, SHARE 🙌 and COMMENT ✍ if you enjoy this idea! Also share your ideas and charts in the comments section below! This is best way to keep it relevant, support us, keep the content here free and allow the idea to reach as many people as possible. **
-------------------------------------------------------------------------------
Disclosure: I am part of Trade Nation's Influencer program and receive a monthly fee for using their TradingView charts in my analysis.
💸💸💸💸💸💸
👇 👇 👇 👇 👇 👇
EURUSD Sellers In Panic! BUY!
My dear followers,
This is my opinion on the EURUSD next move:
The asset is approaching an important pivot point 1.1684
Bias - Bullish
Safe Stop Loss - 1.1633
Technical Indicators: Supper Trend generates a clear long signal while Pivot Point HL is currently determining the overall Bullish trend of the market.
Goal - 1.1776
About Used Indicators:
For more efficient signals, super-trend is used in combination with other indicators like Pivot Points.
Disclosure: I am part of Trade Nation's Influencer program and receive a monthly fee for using their TradingView charts in my analysis.
———————————
WISH YOU ALL LUCK
EURUSD: Will Go Down! Short!
My dear friends,
Today we will analyse EURUSD together☺️
The recent price action suggests a shift in mid-term momentum. A break below the current local range around 1.16802 will confirm the new direction downwards with the target being the next key level of 1.16684.and a reconvened placement of a stop-loss beyond the range.
❤️Sending you lots of Love and Hugs❤️
Long Opportunity for EURUSDEURUSD is currently in a retracement within a bullish trend with clear Bullish market structures in place.
Price is currently approaching the break and retest level at 1,16285... a potential pivot point which acted as a resistance level in the past. On the 4-hour timeframe, price is trading below the 21 and 50 SMA due to the slow nature of the retracement and we are seeing bearish momentum on the RSI.
Need to see the Bulls stepping in with clean bullish momentum on the 4 hour chart to confirm the bullish market directionality before looking to take a long position. will also be observing the bearish trendline break as an additional point of confluence to take the long trade
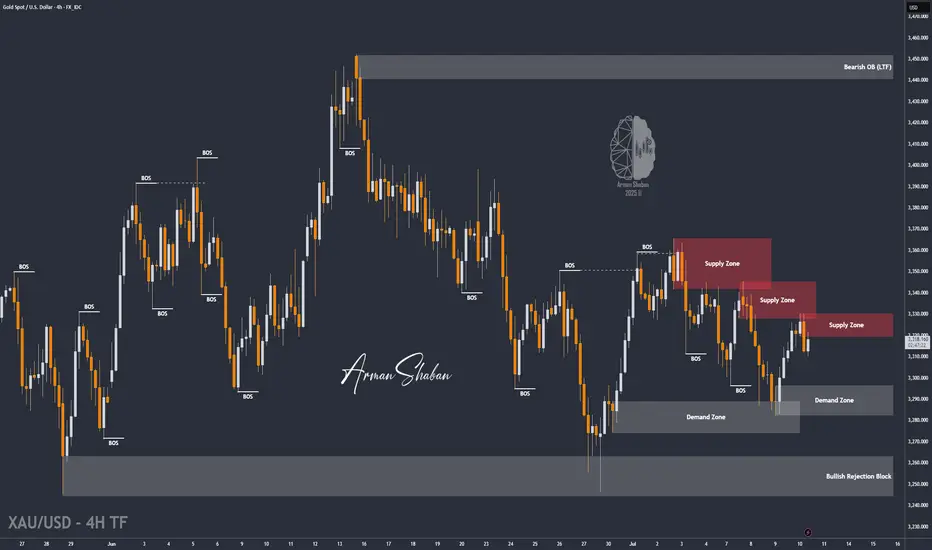
XAU/USD : Gold at a Turning Point – Rejection or Breakout Ahead?By analyzing the TVC:GOLD (XAUUSD) chart on the 4-hour timeframe, we can see that price climbed to $3330 today, entering a key supply zone, which triggered a pullback down to $3310. Gold is now trading around $3317, and I’m watching several potential setups closely.
Scenario 1:
If gold stabilizes below $3320, we could see a bearish move toward $3296.
Scenario 2:
If price breaks above the $3333 resistance, it may enter the next supply zone between $3341 and $3351, which could trigger a strong rejection—potentially offering a 100 to 400 pip move.
Now let’s break down the key levels to watch:
Supply zones: $3320, $3333, $3342, $3358
Demand zones: $3303, $3296, $3289, $3278
Monitor how price reacts to each of these zones — they may provide excellent opportunities.
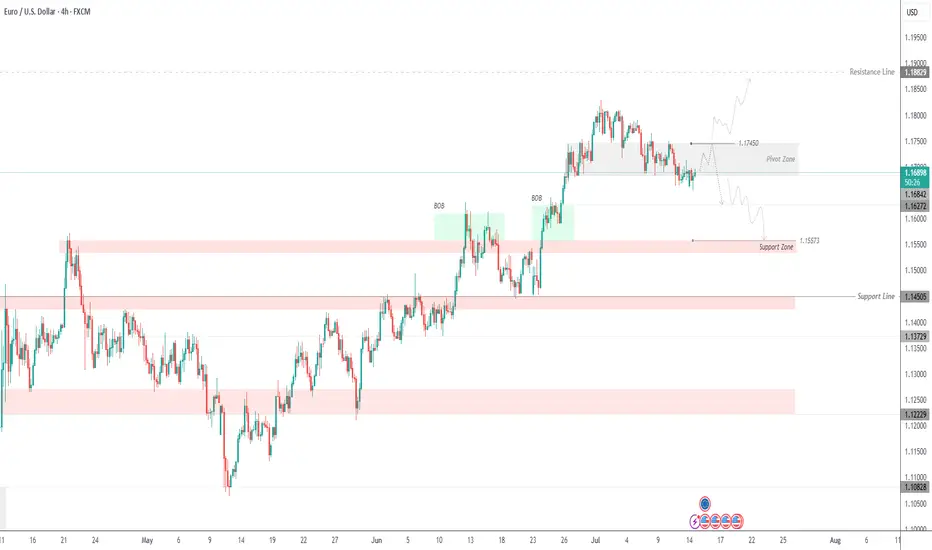
EURUSD Testing Patience – Bearish Trend Not Over YetEURUSD – Overview
EURUSD continues to trade under pressure amid bearish momentum, respecting key technical levels.
The price maintains bearish momentum as long as it trades below 1.1745, with downside targets at 1.1627 and 1.1557.
A retest of 1.1745 is possible and considered normal in this structure. However, if the price stabilizes below 1.1684, it will likely continue dropping toward the support targets.
To shift back to a bullish bias, the pair must break and hold above 1.1745.
Pivot Line: 1.1695
Support Levels: 1.1627 – 1.1557
Resistance Levels: 1.1745 – 1.1810
previous idea:
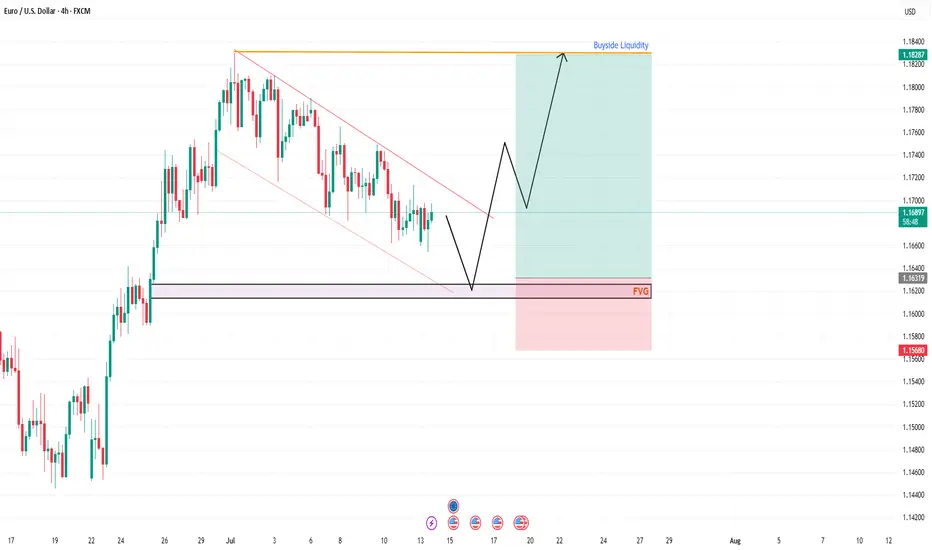
EURUSD POTENTIAL BUY SETUP 4HLooking at EURUSD, Price is moving in a descending channel. EU on the high timeframe is bullish as Dollar is weak. I am expecting EU to fall into the marked FVG to clear the lows and take internal liquidity from the marked FVG before moving higher and take the Buyside Liquidity as marked.
Potential Entry= 1.6350
Stop loss= 1.15650
Take Profit = 1.18250
Please wait for price to come into the marked potential area to take this trade and manage your risk accordingly. Follow me for more updates and trades.
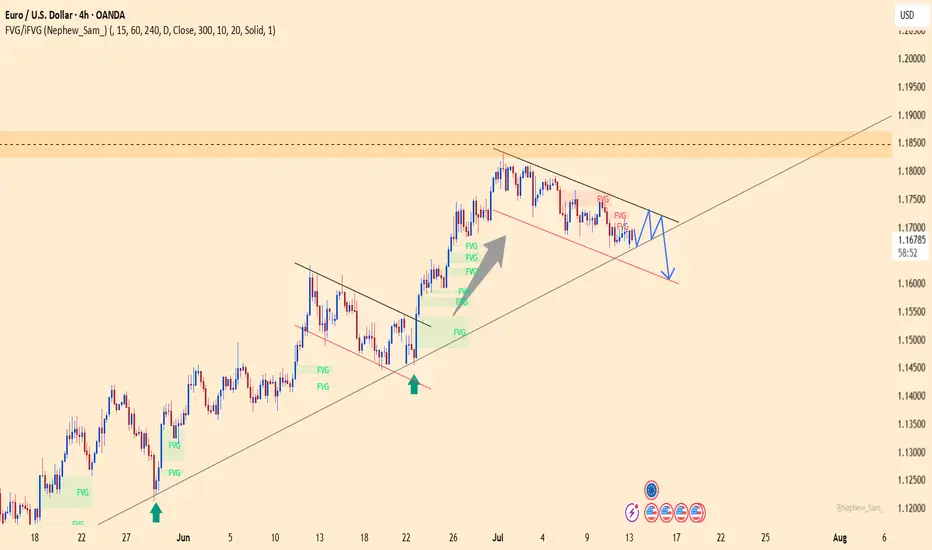
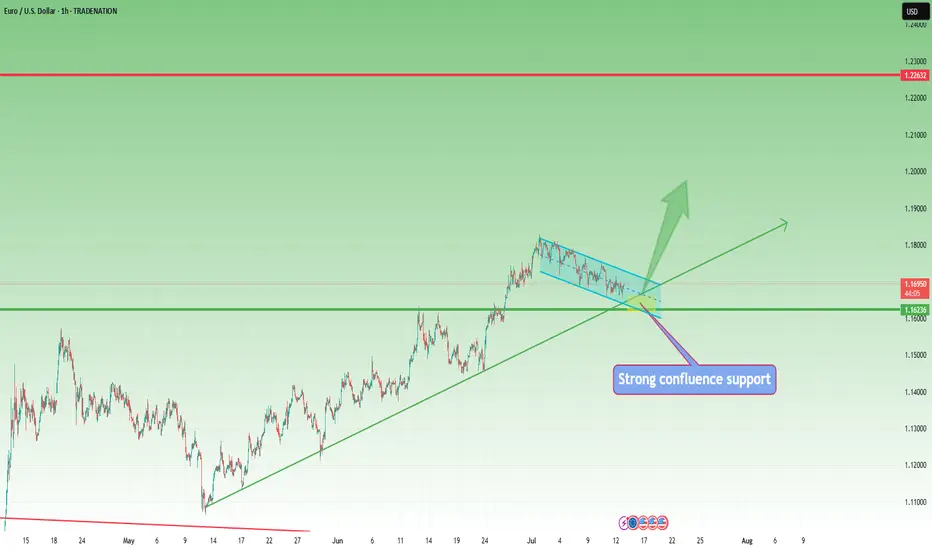
EUR/USD –Bullish Flag After Long Term Trend Shift: Is 1.20 Next?📌 In my previous EUR/USD analysis, I mentioned that the long-term trend likely reversed, and we could see a move toward the 1.23 zone in the medium to longer term.
That view is playing out.
Recently, the pair printed a new local high above 1.18, confirming the trend change.
📉 After this rise, EUR/USD pulled back –but the structure is clearly corrective: overlapping and a classic bullish flag formation.
What's next?
This correction looks close to completion, and bulls may soon return to push toward the key 1.20 level.
Trading Plan:
The 1.1620–1.1650 area stands out as a strong confluence zone – ideal for looking for buying opportunities.
The trend has changed. The setup is forming. Now it’s about timing.
Disclosure: I am part of TradeNation's Influencer program and receive a monthly fee for using their TradingView charts in my analyses and educational articles.
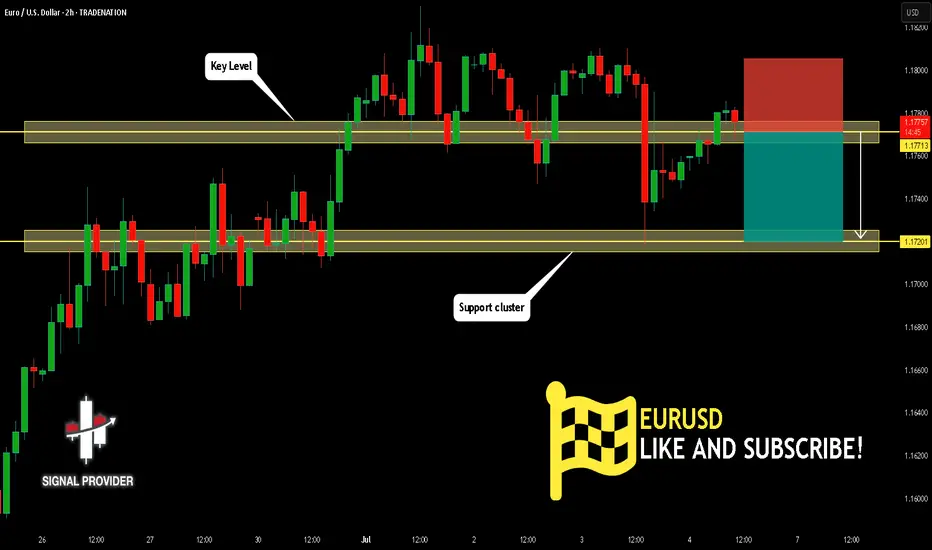
EURUSD Will Go Down From Resistance! Short!
Here is our detailed technical review for EURUSD.
Time Frame: 2h
Current Trend: Bearish
Sentiment: Overbought (based on 7-period RSI)
Forecast: Bearish
The market is trading around a solid horizontal structure 1.177.
The above observations make me that the market will inevitably achieve 1.172 level.
P.S
We determine oversold/overbought condition with RSI indicator.
When it drops below 30 - the market is considered to be oversold.
When it bounces above 70 - the market is considered to be overbought.
Disclosure: I am part of Trade Nation's Influencer program and receive a monthly fee for using their TradingView charts in my analysis.
Like and subscribe and comment my ideas if you enjoy them!
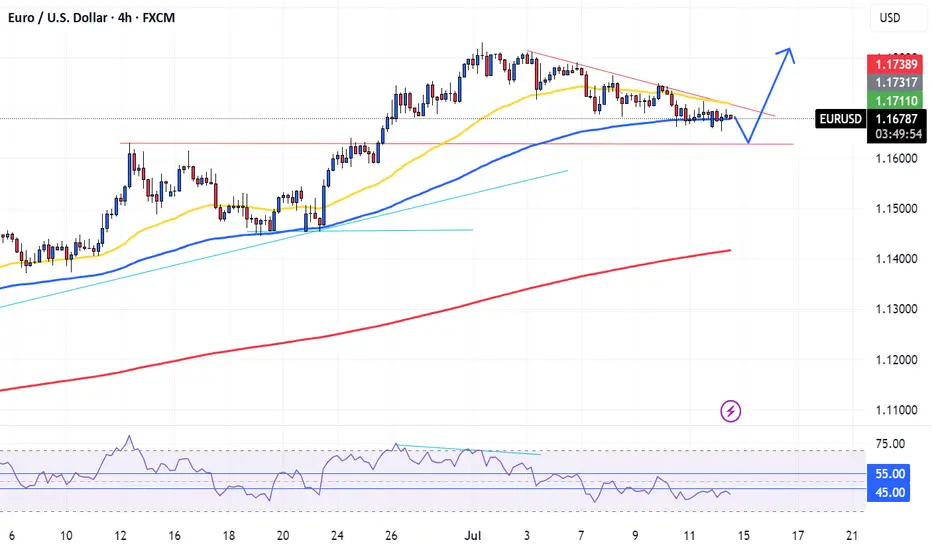
EURUSD and GBPUSD are preparing to continue the upward trendAfter a significant rise in the EURUSD and GBPUSD, they have formed a descending price channel, and it is expected that this channel will be broken to complete the upward trend, because there is no sign of weakness yet, and the Main Lows have not yet been broken.

Which Way to GoHello students and traders, let us jump into a quick top down analysis of the EURUSD.
On the Monthly, we see that price is in a down swing. We have seen price recently go bullish, all the way into the Monthly zone, from where it has begun to reverse bearish. We expect price to hold bearish and continue to melt towards our Monthly liquidity target.
Weekly & Daily:
On the weekly and daily Time frames, we have a bullish setup. This bullish setup is what has helped in driving prices all the way up and into the Monthly refined reversal zone. The weekly timeframe is curently seeing a bearish reversal. With the price hitting the monthly zone, there is a low likelihood of price continuing bullish. The bearishness might just continue for a while.
4 hour and 1 Hour
On the smaler timeframes of the 1 and 4 hour timeframe, market is in a bearish swing. We see prices making lower highs and lower lows, a clear sign of a downtrend. We expect this bearishness to hold. Where that happens, we will see market in the longrun and on the lower time frames experience bearish reversals, with price untimately targetting the Monthly liquidity target.
