BTC - Last Push: Consolidation, Manipulation & DistributionMarket Context
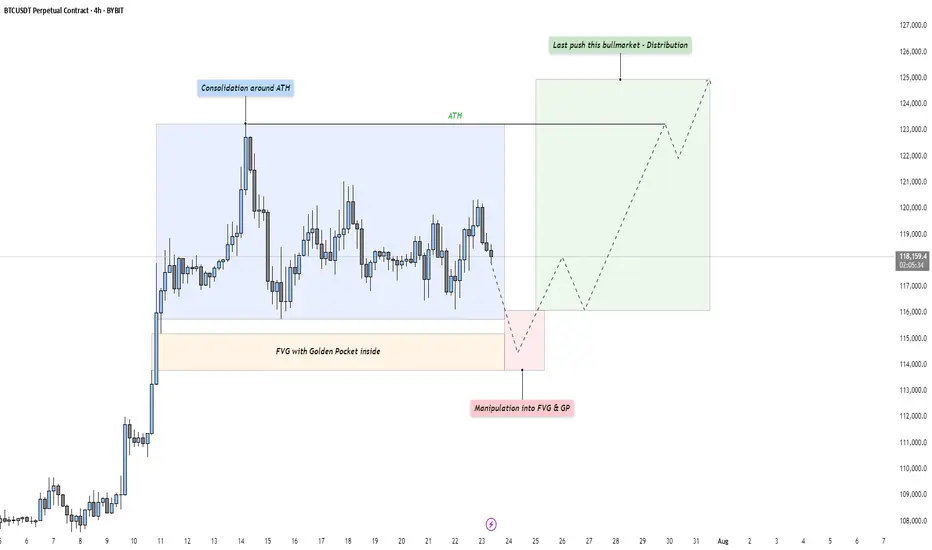
After a strong upward impulse, Bitcoin has entered a mid-term consolidation phase just below its all-time high. This kind of price action is typical as the market digests recent gains and larger participants prepare for the next move. These pauses in momentum often precede either trend continuation or a reversal — and the structure here suggests we might be witnessing the former, but not without a final shakeout.
Phase 1: Consolidation Around the All-Time High
The first phase is defined by a tight range just beneath the all-time high, where price moves sideways in a balanced struggle between buyers and sellers. This is often where retail participants become overly bullish, anticipating a breakout. However, the lack of a sustained move higher indicates that smart money may be waiting for better entries — or preparing to engineer liquidity to fuel the next move.
Phase 2: Manipulation Into the Fair Value Gap and Golden Pocket
Directly below the range lies a clean Fair Value Gap, with a Golden Pocket retracement nestled inside it. This zone represents a strong area of interest. A sharp move into this area would likely sweep late long positions and trigger stop-losses from range traders — a classic manipulation pattern. This phase serves two purposes: collect liquidity and offer favorable pricing for larger players looking to position themselves before expansion. Watch for signs of absorption or reversal as price enters this zone.
Phase 3: Expansion – The Last Push of the Bull Market?
Following the liquidity sweep and reaction from the Fair Value Gap and Golden Pocket zone, we could see a renewed expansion toward higher highs. This is the phase where volume returns, sentiment shifts, and price accelerates. If this plays out, it could mark the final leg of this bull cycle — potentially driving Bitcoin to new all-time highs with strength.
Execution Thoughts
If you're looking to participate, it's wise to wait for a confirmation signal on a lower timeframe — like the 5-minute or 15-minute chart — once price enters the Fair Value Gap and Golden Pocket zone. Watch for a strong bullish reaction, break of structure, or shift in order flow to signal that buyers are stepping back in.
Final Thoughts
Let the market come to your level and don’t chase moves without context. These three phases — consolidation, manipulation, and expansion — are timeless patterns seen across all markets. Stay patient, stay objective, and react with clarity.
If this breakdown helped you see the setup more clearly, a like would mean a lot — and I’d love to hear your thoughts in the comments! Are you watching the same zone, or do you see something different?
EURUSD
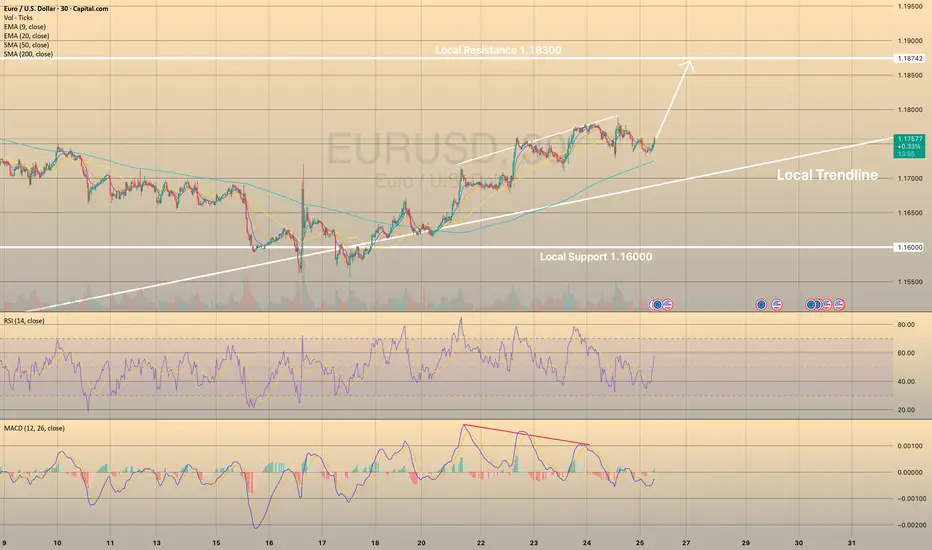
EURUSD HOLDS BULLISH MOMENTUMEURUSD HOLDS BULLISH MOMENTUM📈
24 July I wrote about bearish divergence in EURUSD. Now we see that this resulted into decline towards sma200 on 30-m chart. Currently the price is rebounding from this moving average.
What is the sma200?
The sma200 is a technical indicator that calculates the average closing price of a forex pair or crypto over the past 200 trading periods. It’s used to identify long-term trends, smooth out short-term price fluctuations, and determine potential support or resistance levels.
There is high possibility that the price will continue its way towards local resistance of 1.18300.
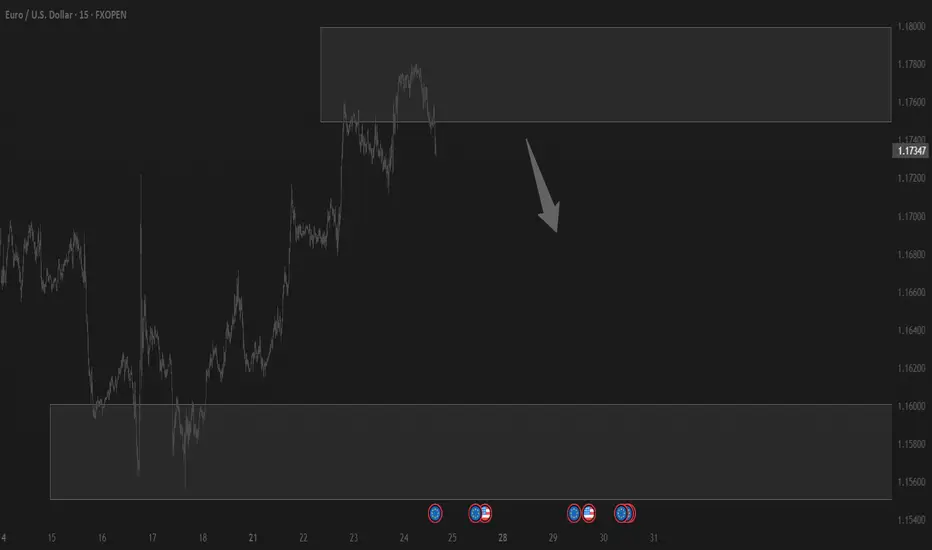
Fundamental Market Analysis for July 25, 2025 EURUSDThe euro remains under pressure as the bond yield gap is once again widening in favor of the dollar following comments from Fed Chair Powell about the need to “keep policy tight for longer” to counteract the inflationary effects of new US tariffs. Additional support for the dollar came from the increase in June retail sales and a decline in jobless claims, which confirms the resilience of the US economy and pushes expectations for the first rate cut toward the year-end.
From the European side, euro support is undermined by signs of slowing activity: the GfK consumer confidence index in Germany remains below its historical average, and preliminary July eurozone PMIs, despite some improvement, still indicate an uneven recovery of the real sector. Further pressure comes from ongoing uncertainty around EU–US trade talks; Washington is still discussing the possibility of 15% tariffs, which threatens the bloc’s export prospects and fuels demand for the safe-haven dollar.
With monetary policy divergence and tariff escalation risks persisting, the pair is likely to continue correcting toward 1.17. Investors are awaiting tomorrow’s US PCE data, which could reinforce expectations of the Fed maintaining a “hawkish” stance and cement the downward trend.
Trade recommendation: SELL 1.17350, SL 1.17550, TP 1.16350
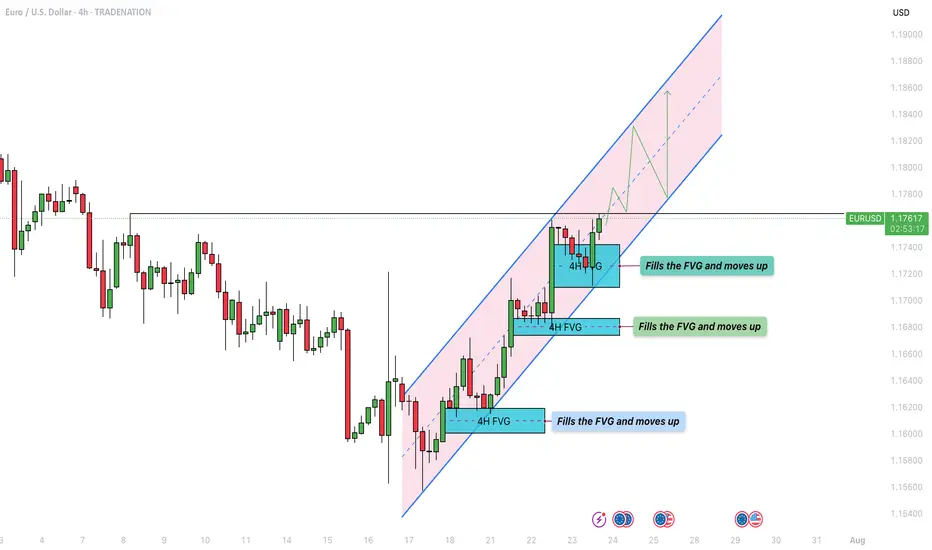
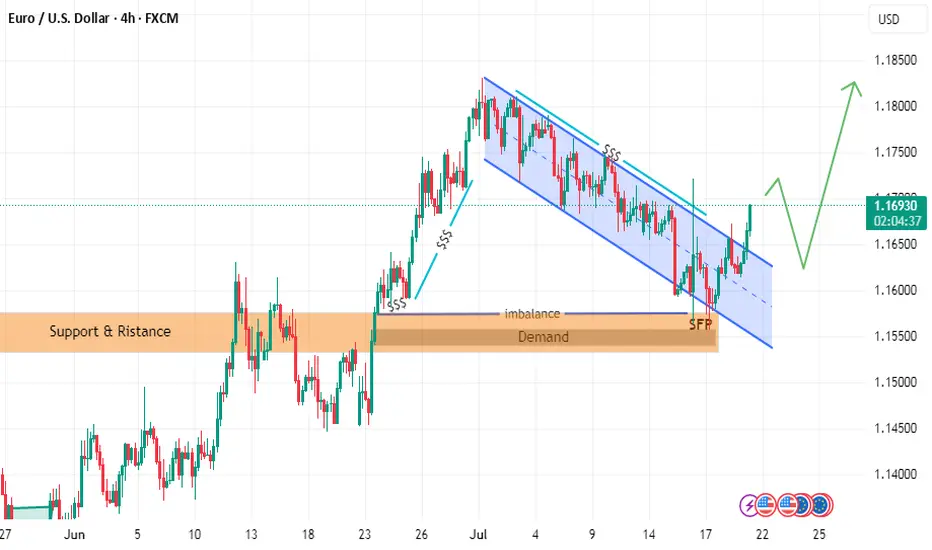
EUR/USD - Bullish parallel channel formation!The EUR/USD currency pair is currently exhibiting a bullish market structure on the 4-hour timeframe, moving steadily within a well-defined ascending parallel channel. Price action has consistently bounced between the lower and upper boundaries of the channel, with each dip finding support at the lower trendline and each rally meeting resistance near the upper trendline. This ongoing pattern suggests a strong and orderly bullish trend as the pair continues to make higher highs and higher lows within the channel.
The Market’s Upward Momentum
One notable feature of this trend is the recurring formation of 4-hour Fair Value Gaps (FVGs) during each upward leg. These FVGs act as temporary inefficiencies in the price movement, which the market consistently returns to fill before resuming its bullish momentum. As shown in the chart, the EUR/USD has filled multiple FVGs over the past week. Today, the pair once again retraced to fill a newly formed 4H FVG and has since continued its move higher. This repeated behavior reinforces the strength of the uptrend, as the market efficiently corrects itself and then propels further in the direction of the overall trend.
Bullish Outlook
From a bullish perspective, the key level to watch is the horizontal resistance zone around 1.1766. A confirmed break and hold above this level would signal a strong continuation of the current uptrend. Should the price sustain itself above this level, it could initiate a renewed push toward the upper boundary of the ascending channel, potentially targeting levels near 1.1820 and beyond. This scenario would confirm market confidence and open the door for further gains.
Bearish Risk
On the flip side, the bearish case would involve a false breakout above the 1.1766 resistance level, followed by a sharp rejection and a break below the rising lower trendline of the channel. Such a move would invalidate the current structure and shift the bias to the downside. In that case, the 4-hour FVG located between approximately 1.1710 and 1.1740 will act as a critical support zone. If this area fails to hold, it could trigger a deeper retracement and potentially lead to a more prolonged bearish correction.
Final thoughts
In summary, the EUR/USD is currently respecting a bullish parallel channel on the 4-hour timeframe, with upward moves consistently leaving and then filling 4H FVGs before continuing higher. The 1.1766 level is pivotal, a sustained break above it favors continued bullish momentum, while a rejection and breakdown from the channel could signal a bearish reversal. Traders should closely monitor price behavior around this key level and the integrity of the ascending channel to anticipate the next significant move.
-------------------------
Disclosure: I am part of Trade Nation's Influencer program and receive a monthly fee for using their TradingView charts in my analysis.
Thanks for your support. If you enjoyed this analysis, make sure to follow me so you don't miss the next one. And if you found it helpful, feel free to drop a like 👍 and leave a comment 💬, I’d love to hear your thoughts!
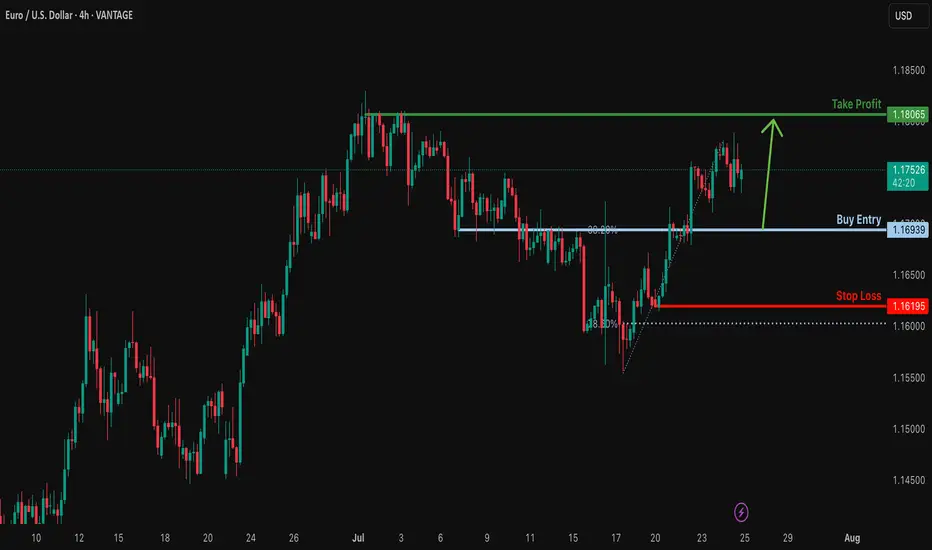
EURUSD I Bullish Bounce Off Based on the H4 chart analysis, the price is falling toward our buy entry level at 1.1699, a pullback support that aligns with the 38.2% Fib retracement.
Our take profit is set at 1.1745, a pullback resistance.
The stop loss is placed at 1.1638, below the 61.8% Fib retracement.
High Risk Investment Warning
Trading Forex/CFDs on margin carries a high level of risk and may not be suitable for all investors. Leverage can work against you.
Stratos Markets Limited (tradu.com ):
CFDs are complex instruments and come with a high risk of losing money rapidly due to leverage. 63% of retail investor accounts lose money when trading CFDs with this provider. You should consider whether you understand how CFDs work and whether you can afford to take the high risk of losing your money.
Stratos Europe Ltd (tradu.com ):
CFDs are complex instruments and come with a high risk of losing money rapidly due to leverage. 63% of retail investor accounts lose money when trading CFDs with this provider. You should consider whether you understand how CFDs work and whether you can afford to take the high risk of losing your money.
Stratos Global LLC (tradu.com ):
Losses can exceed deposits.
Please be advised that the information presented on TradingView is provided to Tradu (‘Company’, ‘we’) by a third-party provider (‘TFA Global Pte Ltd’). Please be reminded that you are solely responsible for the trading decisions on your account. There is a very high degree of risk involved in trading. Any information and/or content is intended entirely for research, educational and informational purposes only and does not constitute investment or consultation advice or investment strategy. The information is not tailored to the investment needs of any specific person and therefore does not involve a consideration of any of the investment objectives, financial situation or needs of any viewer that may receive it. Kindly also note that past performance is not a reliable indicator of future results. Actual results may differ materially from those anticipated in forward-looking or past performance statements. We assume no liability as to the accuracy or completeness of any of the information and/or content provided herein and the Company cannot be held responsible for any omission, mistake nor for any loss or damage including without limitation to any loss of profit which may arise from reliance on any information supplied by TFA Global Pte Ltd.
The speaker(s) is neither an employee, agent nor representative of Tradu and is therefore acting independently. The opinions given are their own, constitute general market commentary, and do not constitute the opinion or advice of Tradu or any form of personal or investment advice. Tradu neither endorses nor guarantees offerings of third-party speakers, nor is Tradu responsible for the content, veracity or opinions of third-party speakers, presenters or participants.

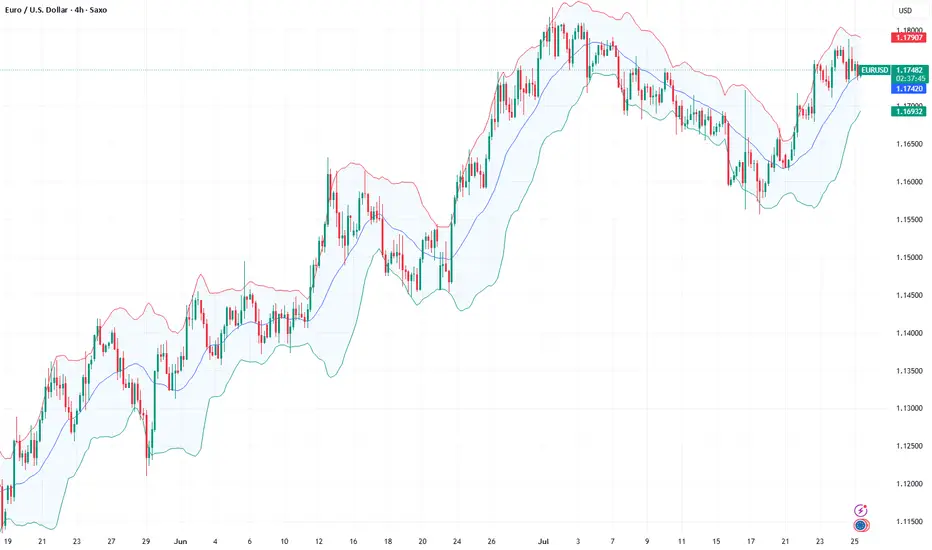
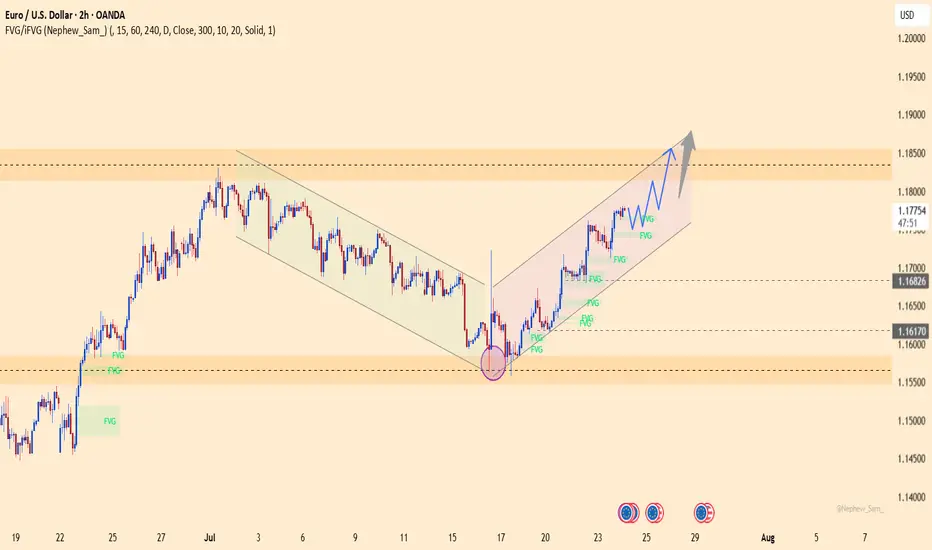
EURUSD – The Comeback is Real! After weeks trapped in a descending channel, EURUSD has broken out in style, launching into a clean bullish channel. Price is now carving a staircase of FVG zones, with momentum clearly favoring the bulls.
What’s fueling the fire?
Flash Manufacturing PMI from Europe beat forecasts
Eurozone consumer confidence improved
Markets pricing in dovish Fed as jobless claims dropped but inflation expectations stall
As long as price stays above 1.1750 and respects the ascending channel, the 1.1850 zone is well within reach.
Strategy: Buy the dips inside the bullish channel. FVGs act as stepping stones for further upside.
Bullish bounce off overlap support?EUR/USD is falling towards the support level, which is an overlap support that aligns with the 38.2% Fibonacci retracement and could bounce from this level to our take profit.
Entry: 1.1693
Why we like it:
There is an overlap support that lines up with the 38.2% Fibonacci retracement.
Stop loss: 1.1619
Why we like it:
There is a pullback support that is slightly above the 78.6% Fibonacci retracement.
Take profit: 1.1806
Why we like it:
There is a swing high resistance.
Enjoying your TradingView experience? Review us!
Please be advised that the information presented on TradingView is provided to Vantage (‘Vantage Global Limited’, ‘we’) by a third-party provider (‘Everest Fortune Group’). Please be reminded that you are solely responsible for the trading decisions on your account. There is a very high degree of risk involved in trading. Any information and/or content is intended entirely for research, educational and informational purposes only and does not constitute investment or consultation advice or investment strategy. The information is not tailored to the investment needs of any specific person and therefore does not involve a consideration of any of the investment objectives, financial situation or needs of any viewer that may receive it. Kindly also note that past performance is not a reliable indicator of future results. Actual results may differ materially from those anticipated in forward-looking or past performance statements. We assume no liability as to the accuracy or completeness of any of the information and/or content provided herein and the Company cannot be held responsible for any omission, mistake nor for any loss or damage including without limitation to any loss of profit which may arise from reliance on any information supplied by Everest Fortune Group.
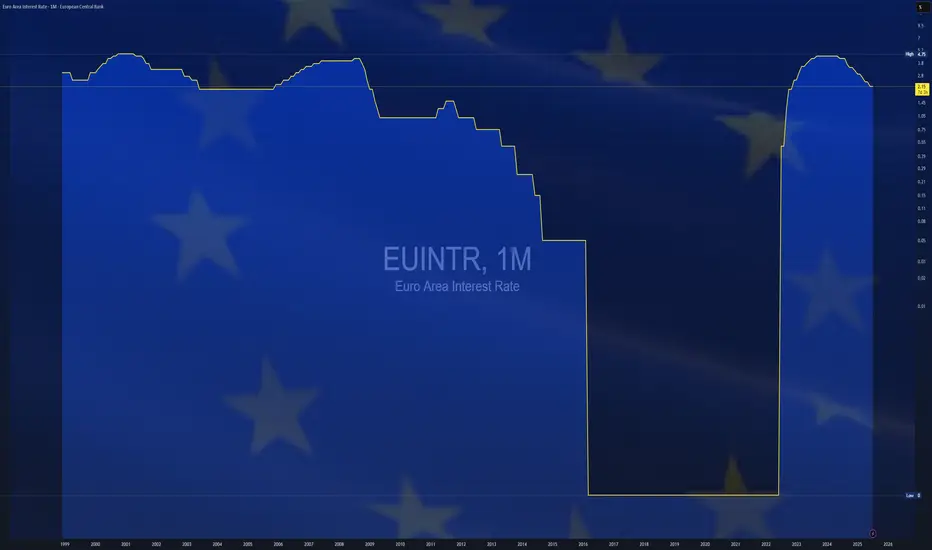
$EUINTR - Europe Interest Rates (July/2025)ECONOMICS:EUINTR
July/2025
source: European Central Bank
- The ECB kept interest rates unchanged in July, effectively marking the end of its current easing cycle after eight cuts over the past year that brought borrowing costs to their lowest levels since November 2022.
The main refinancing rate remains at 2.15%, while the deposit facility rate holds at 2.0%. Policymakers struck a wait-and-see stance, as they evaluate the impact of lingering trade uncertainty and the potential fallout from proposed US tariffs on economic growth and inflation.
Inflation hit the ECB’s 2% target in June, adding to the case for a pause in policy adjustments. Speaking at the ECB press conference, President Lagarde said the central bank is “in a good place” but acknowledged the difficulty in assessing how tariffs will affect price outlooks, given the mix of both inflationary and disinflationary pressures.
On the recent euro appreciation, Lagarde reiterated that the ECB does not target exchange rates directly but considers them when forecasting inflation.
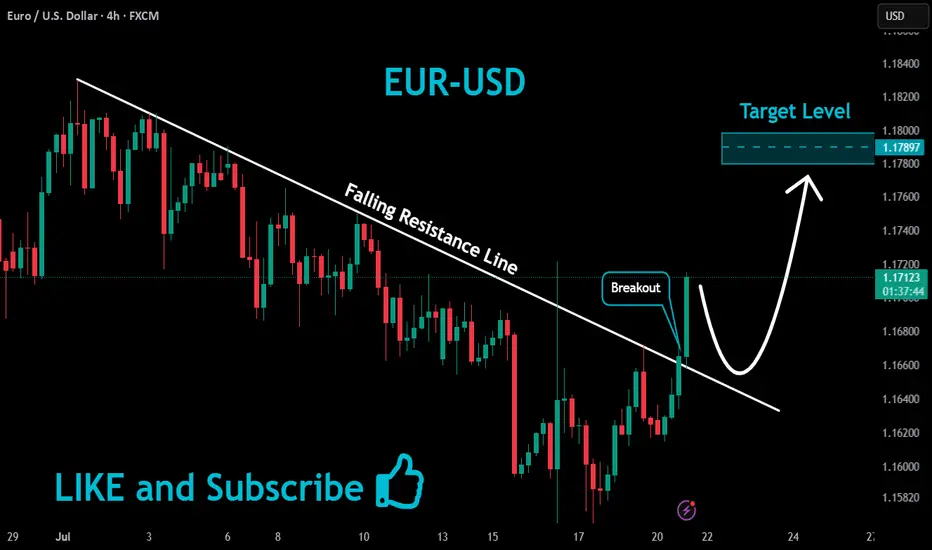
EURUSD Massive Bullish Breakout!
HI,Traders !
#EURUSD is trading in a strong
Uptrend and the price just
Made a massive bullish
Breakout of the falling
Resistance line and the
Breakout is confirmed
So after a potential pullback
We will be expecting a
Further bullish continuation !
Comment and subscribe to help us grow !
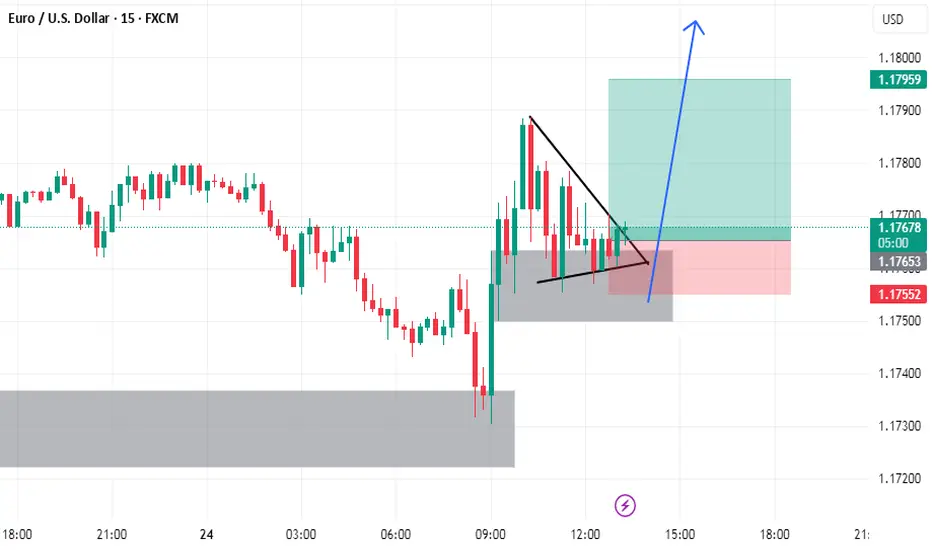
EURUSD BUY SETUPFOLLOW THE PRICE WILL GO UP
BECAUSE WE HAVE PATTERN ON 5 M
WE have strong candle on frame 4h
ECB holds rates as expected, Euro steadyThe euro is showing limited movement on Thursday. In the North American session, EUR/USD is trading at 1.1763, down 0.03% on the day. Earlier, the euro climbed to a high of 1.1788, its highest level since July 7.
The European Central Bank's decision to maintain the key deposit rate at 2.0% was significant but not a surprise. With the hold, the ECB ended a streak of lowering rates at seven consecutive meetings. The ECB has been aggressive, chopping 250 basis points in just over a year.
The ECB statement said that inflation was falling in line with the Bank's forecasts and that future rate decisions would be data dependent. President Lagarde has said that the easing cycle is almost down, but the markets are expecting at least one more rate cut before the end of the year.
The European Union and the United States are locked in negotiations over tariffs, with hopes that an agreement can be reached, on the heels of the US-Japan deal earlier this week. US President Trump has threatened to hit the EU with 30% tariffs if a deal is not made by August 1, but there are signals that the sides will agree to 15% tariffs on European imports, as was the case in the US-Japan agreement.
If an agreement is reached, it will greatly reduce the uncertainty around tariffs and will make it easier for the ECB to lower rates and make more accurate forecasts for inflation and growth.
In the US, Services PMI rose to 55.2 in July, up from 52.9 in June and above the market estimate of 53.0. This pointed to strong expansion and marked the fastest pace of growth in seven months. Manufacturing headed the opposite direction, falling from 52.6 in June, a 37-month high, to 49.5. This was the first contraction since December, with new orders and employment falling.

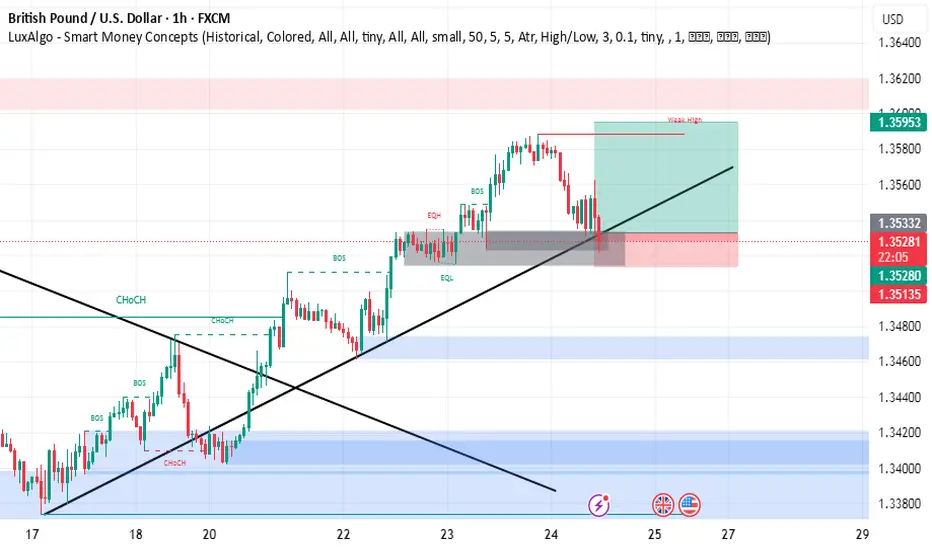
GBPUSD buy setupsimply
this is 6 deals after 5 CONSECUTIVE WINNING traders
we have demand
uptrend
the price can't make lower low
and make more candle in the area with more rejection
so the price will go up
be careful on your risk money management
BEST WISHES
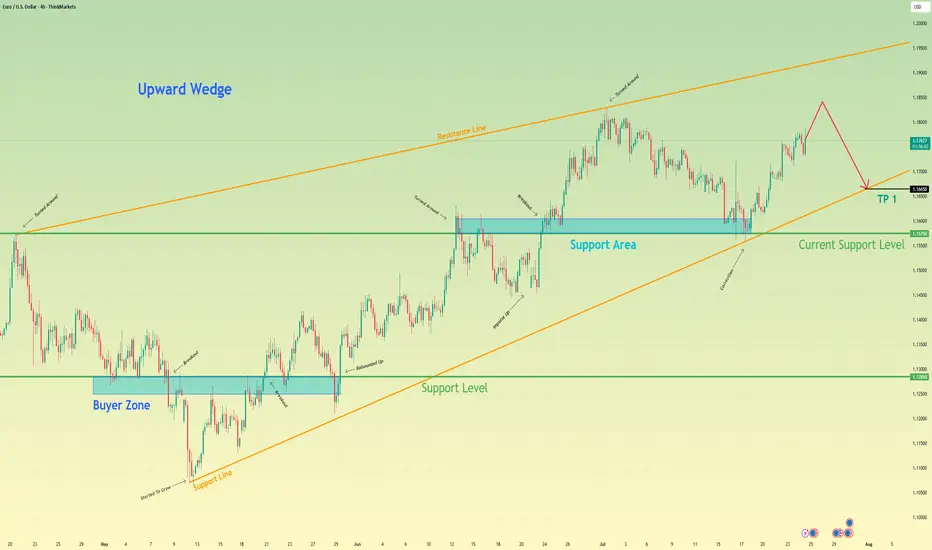
Euro will rise a little and then start to fall to support lineHello traders, I want share with you my opinion about Euro. After a prolonged consolidation period, a strong upward trend was initiated from the buyer zone around 1.1285, propelling the EUR significantly higher. This initial impulsive move has since transitioned into a more complex and mature phase, taking the shape of a large upward wedge formation, a pattern which often signals underlying exhaustion in the prevailing trend. Currently, the pair is operating within this defined market zone, characterized by a clear ascending support line and a corresponding resistance line. The price action inside the wedge has become corrective, with the most recent upward correction originating from the support area near 1.1575. The working hypothesis is centered on a short-term bearish scenario, which anticipates that this current rally will fail as it approaches the upper boundary of the wedge. A rejection from this resistance would confirm that selling pressure is increasing and that the bullish momentum is waning. This would likely trigger a significant downward rotation within the structure, with the immediate objective being a retest of the main ascending support line. For this reason, the TP is strategically and logically placed at the 1.1665 level, as this point lies directly on the trend line and serves as the most critical test for the existing uptrend's viability. Please share this idea with your friends and click Boost 🚀
Disclaimer: As part of ThinkMarkets’ Influencer Program, I am sponsored to share and publish their charts in my analysis.
EURUSD Looking bullish in all areasI think now it is safe to say we know where EURUSD is heading to, I am looking for a sweep above the 1.18295 level
Trade Cautiously

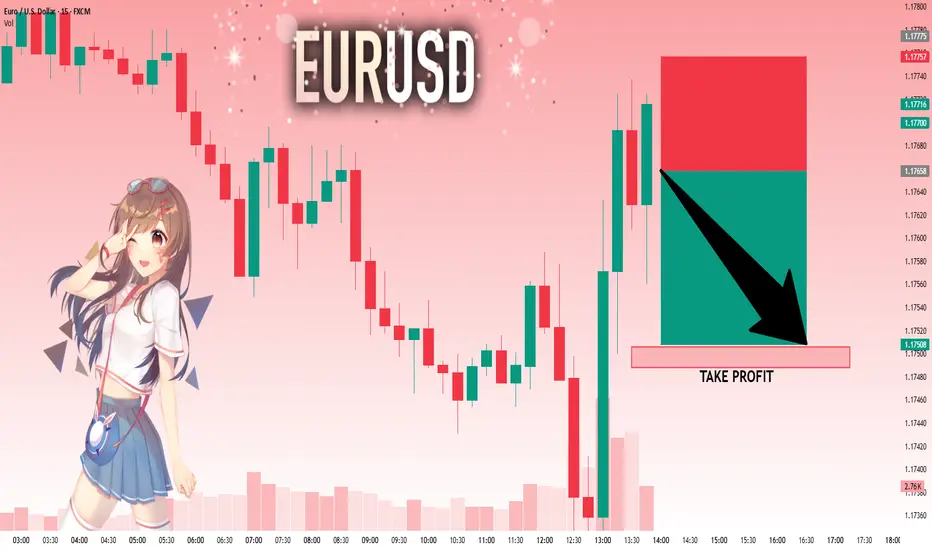
EURUSD: Next Move Is Down! Short!
My dear friends,
Today we will analyse EURUSD together☺️
The price is near a wide key level
and the pair is approaching a significant decision level of 1.17658 Therefore, a strong bearish reaction here could determine the next move down.We will watch for a confirmation candle, and then target the next key level of 1.17506..Recommend Stop-loss is beyond the current level.
❤️Sending you lots of Love and Hugs❤️
Trading balanceTrading balance The price of the asset has rebounded from the balance zone. With the prospect of growth into the resistance zone.
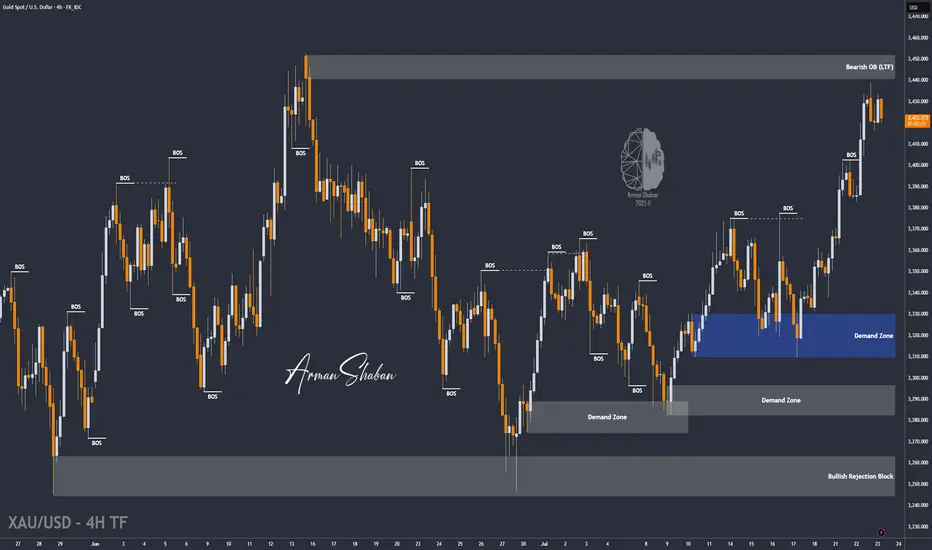
XAU/USD | Watching for Potential Drop Toward $3391! (READ)By analyzing the gold chart on the 4-hour timeframe, we can see that gold continued its bullish move after holding above $3409, successfully hitting the $3440 target and delivering over 200 pips in returns! After reaching this key supply zone, gold corrected down to $3415 and is now trading around $3421. If the price stabilizes below $3431, we can expect further downside movement, with the next bearish targets at $3415, $3404, and $3391. If this scenario fails, an alternative setup will be shared.
Please support me with your likes and comments to motivate me to share more analysis with you and share your opinion about the possible trend of this chart with me !
Best Regards , Arman Shaban
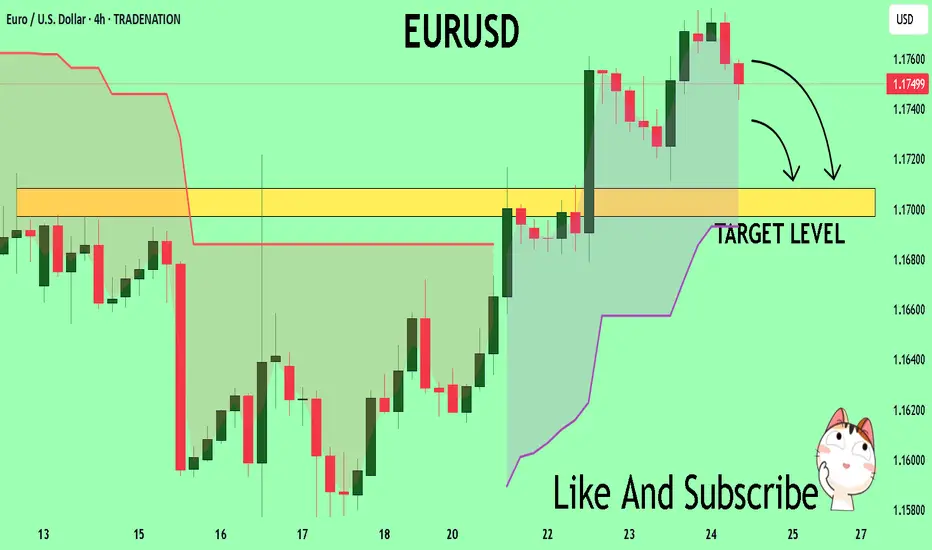
EURUSD A Fall Expected! SELL!
My dear friends,
Please, find my technical outlook for EURUSD below:
The instrument tests an important psychological level 1.1751
Bias - Bearish
Technical Indicators: Supper Trend gives a precise Bearish signal, while Pivot Point HL predicts price changes and potential reversals in the market.
Target - 1.1708
About Used Indicators:
Super-trend indicator is more useful in trending markets where there are clear uptrends and downtrends in price.
Disclosure: I am part of Trade Nation's Influencer program and receive a monthly fee for using their TradingView charts in my analysis.
———————————
WISH YOU ALL LUCK
ECB Interest Rate Decision: What to Expect and How Could React📊 ECB Interest Rate Decision: What to Expect and How EURUSD Could React
This week’s spotlight is on the European Central Bank (ECB) Interest Rate Decision — a key market driver that could shape the near-term direction of the euro and broader European markets. Here's what to expect. 👇
🔔 Key Event to Watch
📅 ECB Interest Rate Decision
🕐 Date: July 24
⏰ Time: 12:15 p.m. UTC
📉 Forecast: Hold at 2.15%
📌 Economic Context
The European Central Bank is expected to hold interest rates steady on Thursday, likely marking the end of its current easing cycle after eight consecutive cuts that brought borrowing costs to their lowest levels since November 2022.
🔒 Main refinancing rate: 2.15%
💰 Deposit facility rate: 2.00%
Policymakers are likely to adopt a wait-and-see approach as they monitor the impact of persistent trade uncertaintyand potential U.S. tariffs on economic growth and inflation.
Adding to the cautious stance, inflation finally reached the ECB’s 2% target in June, and is now forecast to dip belowthat level later this year. This drop is expected to be sustained over the next 18 months, driven by:
A strong euro 💶
Falling energy prices 🛢️
Cheaper imports from China 🇨🇳
Markets are currently pricing in just one more rate cut by December, with around a 50% probability of that happening in September, before a possible tightening cycle resumes in late 2026.
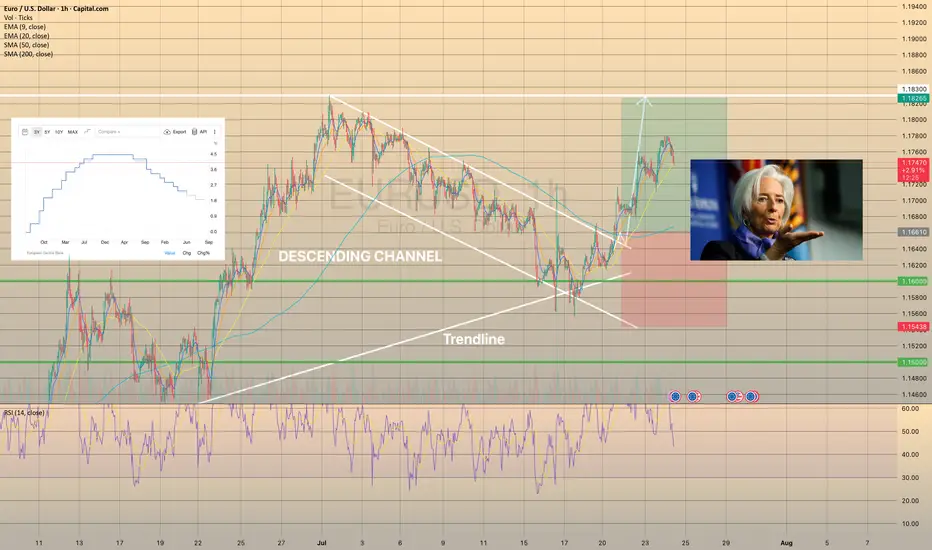
📈 EURUSD Technical Outlook
EURUSD has been trading within a descending channel since early July. However, it recently rebounded from trendline support, backed by bullish RSI divergence. The pair is approaching a breakout above the 1-hour SMA200, signaling a potential continuation of the uptrend. 🔼
A minor pullback is possible before a stronger move
Bullish momentum may continue if resistance is cleared
🎯 Target range: 1.18250 – 1.18300
🧩 Summary
The ECB is likely to keep rates unchanged at 2.15%, adopting a cautious tone amid easing inflation and global trade risks. This outcome could support the euro, particularly if U.S. rate expectations soften.
With technical indicators aligning with fundamental stability, EURUSD may be setting up for a bullish continuationin the coming sessions. 📊💶
follow EURUSD LION & PLANE BUY SETUPTHE PRICE has moved as I explained in the last two posts
but we have some update to go along the way
the price could break failing channel
and withdrawal liquidity and filled imbalance
hence reflect from demand zone with zero reflection as i explained in last post with rock and plane
and it will go up to take liquidity in failing channel or downtrend
Bearish reversal off 161.8% Fibonacci resistance?EUR/USD is rising towards the resistance level which is a pullback resitance that lines up with the 161.8% Fibonacci rretracement and could drop from this level to our take profit.
Entry: 1.1786
Why we like it:
There is a pullback resistance level that lines up with the 161.8% Fibonacci extension.
Stop loss: 1.1828
Why we like it:
There is a swing high resistance.
Take profit: 1.1691
Why we like it:
There is an overlap support that aligns with the 38.2% Fibonacci retracement.
Enjoying your TradingView experience? Review us!
Please be advised that the information presented on TradingView is provided to Vantage (‘Vantage Global Limited’, ‘we’) by a third-party provider (‘Everest Fortune Group’). Please be reminded that you are solely responsible for the trading decisions on your account. There is a very high degree of risk involved in trading. Any information and/or content is intended entirely for research, educational and informational purposes only and does not constitute investment or consultation advice or investment strategy. The information is not tailored to the investment needs of any specific person and therefore does not involve a consideration of any of the investment objectives, financial situation or needs of any viewer that may receive it. Kindly also note that past performance is not a reliable indicator of future results. Actual results may differ materially from those anticipated in forward-looking or past performance statements. We assume no liability as to the accuracy or completeness of any of the information and/or content provided herein and the Company cannot be held responsible for any omission, mistake nor for any loss or damage including without limitation to any loss of profit which may arise from reliance on any information supplied by Everest Fortune Group.

EURUSD | 4H Chart | New York Session Sellers in Play 📉 EURUSD | 4H Chart | New York Session Sellers in Play 🇺🇸
🟥 Red Zone Rejection – clarity
As the New York session unfolds, sellers are stepping in at a premium supply zone — classic reaction near 1.1763–1.1812.
🔻 Current Structure:
Rising wedge formation tapped into prior supply zone
Price kissed the upper wedge and reacted — sellers triggering from the red zone
NY session = high liquidity = aggressive positioning by institutions
🎯 Potential Bearish Targets:
1️⃣ 1.1712 – Minor structure support
2️⃣ 1.1670 – Trendline + liquidity sweep
3️⃣ 1.1582 – Major bullish invalidation (optional swing target)
🧠 Smart Money Note:
This is where liquidity is grabbed before reversal
Risk-to-reward favors downside short-term as long as price stays below 1.1812
📌 Bias: Tactical Short
🎯 Reaction + Rejection = Execution
🎩

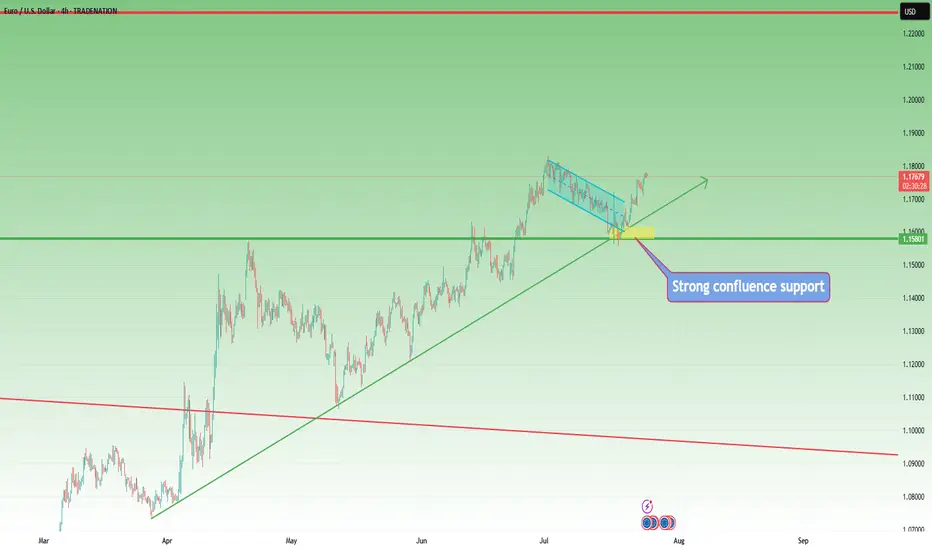
EURUSD – Bulls Still in Control, Trend ResumesIn my previous EURUSD analysis, I pointed out that the pair was nearing an important confluence support around 1.1620, and that – given the overall bullish trend – this zone could offer solid long opportunities.
What followed?
The market briefly dipped below that zone, even challenging the psychological 1.1600 round number. But instead of breaking down, bulls regrouped, stepped in with force, and pushed the pair aggressively higher.
📍 At the time of writing, EURUSD is trading at 1.1770, and my long trade is running with a comfortable 150 pips profit.
🔍 W hat’s Next?
The current structure suggests a continuation of the uptrend, and the logical technical target is the recent high at 1.1830.
Until proven otherwise, this is still a buy-the-dip market.
✅ Buying around 1.1700 could be a valid setup, especially if we see buying power on the intraday chart
⚠️ The Warning Sign
Despite the bullish bias, keep in mind:
If EURUSD drops and closes below 1.1670, the structure begins to shift — and this could signal a deeper correction or even trend reversal.
📌 Until then, the bias remains bullish, dips are to be watched for entries, and 1.1830 is the next checkpoint.
D isclosure: I am part of TradeNation's Influencer program and receive a monthly fee for using their TradingView charts in my analyses and educational articles.