EUR/USD 1-Hour Rising Channel – Support Zone & Potential Upside!Chart Breakdown & Technical Insights
Rising Channel Structure
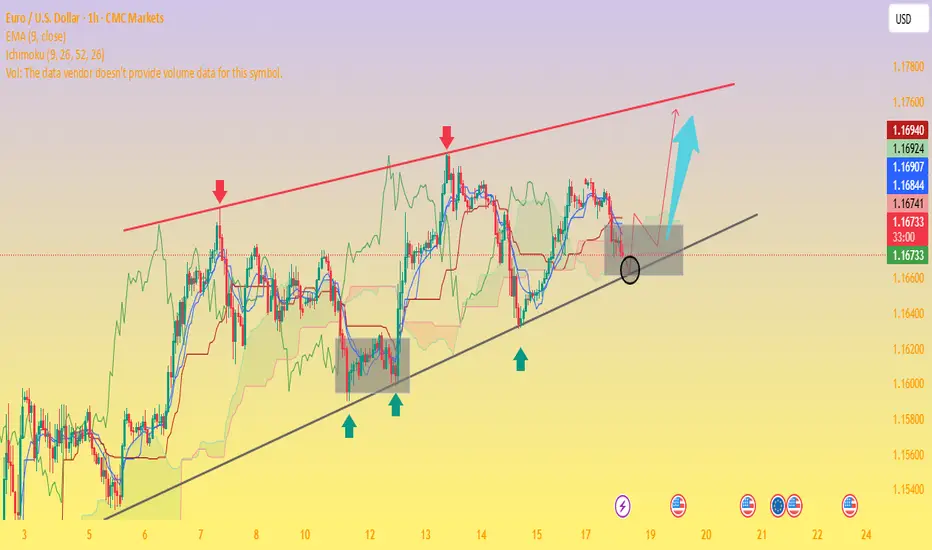
The chart clearly shows EUR/USD trading within a rising channel, marked by higher highs (red arrows) and higher lows (green arrows) forming parallel support and resistance trendlines.
Key Support Zone & Bounce Potential
The price is currently sitting near the ascending trendline support, highlighted by the shaded gray box and emphasized with a circled area. Many analysts note that this lower boundary—around the 1.1690 level—serves as crucial support on a broader time frame
.
Short-Term Momentum Indicators
According to recent technical calls, EUR/USD maintains a short-term bullish bias in the rising channel. However, some momentum indicators, such as RSI, hint at weakening strength—particularly when higher price highs are not matched with higher RSI peaks, suggesting a bearish divergence
Forex Crunch
.
Potential Upside Trajectory
Should the lower channel support hold, the chart suggests a rebound toward mid-channel or potentially up to the upper boundary. Analysts highlight the 1.1720–1.1750 area as a near-term resistance, with the upper channel boundary closer to 1.1850
Alternative Scenario – Breakdown Risk
If EUR/USD breaks below the channel (below ~1.1690), the bullish structure may falter. That could expose the pair to deeper pullbacks, possibly testing lower support levels around 1.1650 or lower
.
** Summary Table**
Scenario Likely Outcome
Bounce off support Move up toward mid-channel (~1.172) or channel top (~1.185)
Breakdown below support Decline toward lower support zones (1.1650 and below)
Conclusion & Strategy Snapshot
The price is positioned at a critical support within a well-defined rising channel.
The bullish favored path: a rebound from the lower trendline toward resistance levels.
The bearish risk: a breakdown would shift momentum, possibly leading to deeper retracements.
Monitor for price action signals (e.g. bounce, candlestick patterns), RSI behavior, and behavior around these key levels.
Eurusd1hr
SWING TRADE IN EURUSD SWING Trade in EURUSD.📉🔻
Swing opportunity is forming in EURO to Short
Follow for more swing analysis on Indices, Commodities
Dr. Iqra Shah
EUR/USD Forecast – Bears in Control Ahead of US Jobless DataEUR/USD Forecast – Bears in Control Ahead of US Jobless Data
🌐 Macro View: Dollar Regains Strength Amid Uncertainty
EUR/USD remains under selling pressure as the greenback finds renewed strength following midweek weakness. The market is bracing for fresh U.S. jobless claims data, expected to show a slight rise to 235K. A print below 220K could reignite USD demand, while a surprise above 240K may offer a temporary lifeline for the euro.
Amid geopolitical and economic turbulence, the euro continues to underperform as investors shift to the dollar for safety and yield advantage.
📉 Technical Outlook – MMF & Smart Money Perspective
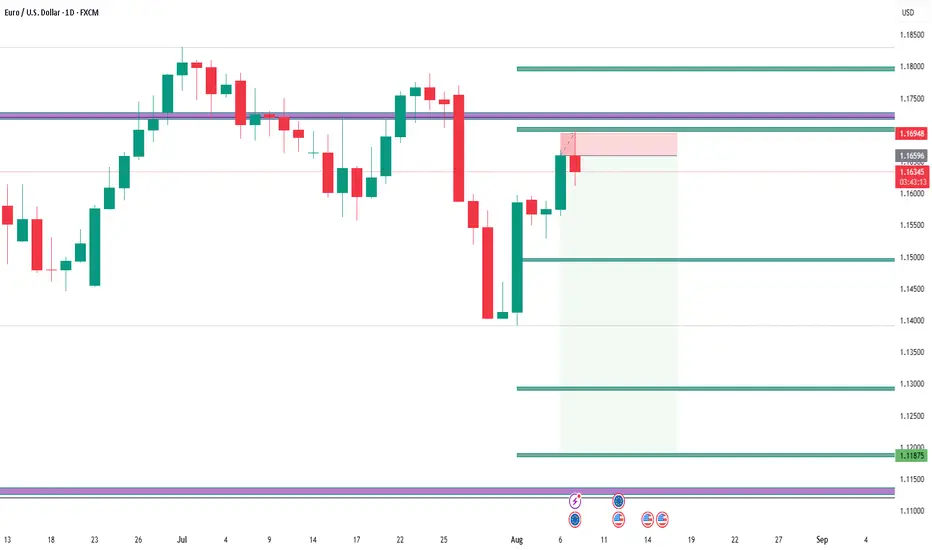
The recent breakdown below 1.1600 confirms the bearish momentum. Based on the MMF (Market Momentum Flow) methodology, price action is currently moving within a controlled distribution structure, suggesting further downside potential.
Key zones identified from H1 structure:
OBS + FVG High Zone (1.1662 – 1.1687): Strong supply zone + volume imbalance.
1.1637: Mid-key level and possible liquidity magnet.
1.1616 – 1.1573: Ideal area for sweeping sell-side liquidity before any sustainable bounce.
If price reclaims 1.1662, intraday bullish correction may be in play. However, as long as 1.1687 holds, bears remain in control.
🧭 Trade Plan for Today
🔴 SELL ZONE: 1.1662 – 1.1687 (FVG + OBS Volume Zone)
SL: 1.1710
TP: 1.1637 → 1.1616 → 1.1590 → 1.1573
✅ Preferred entry zone aligned with high-volume imbalance & MMF rejection pattern.
🟢 BUY ZONE (Scalp Only): 1.1575 – 1.1580 (Sell-side Liquidity Zone)
SL: 1.1550
TP: 1.1612 → 1.1630 → 1.1645
⚠️ Use with caution — only upon clear price reaction at lower liquidity sweep area.
🔍 Strategy Insight
This is a classic scenario of a controlled pullback within a larger bearish structure. Patience is key — let price tap into imbalanced zones before executing. Given today's U.S. data, volatility may spike during the New York session, so risk management is crucial.
💬 What’s Your Take?
Do you expect EUR/USD to retest the 1.1550s zone, or could a surprise from U.S. job data flip the narrative?
👇 Drop your analysis below & follow for more MMF-based setups.

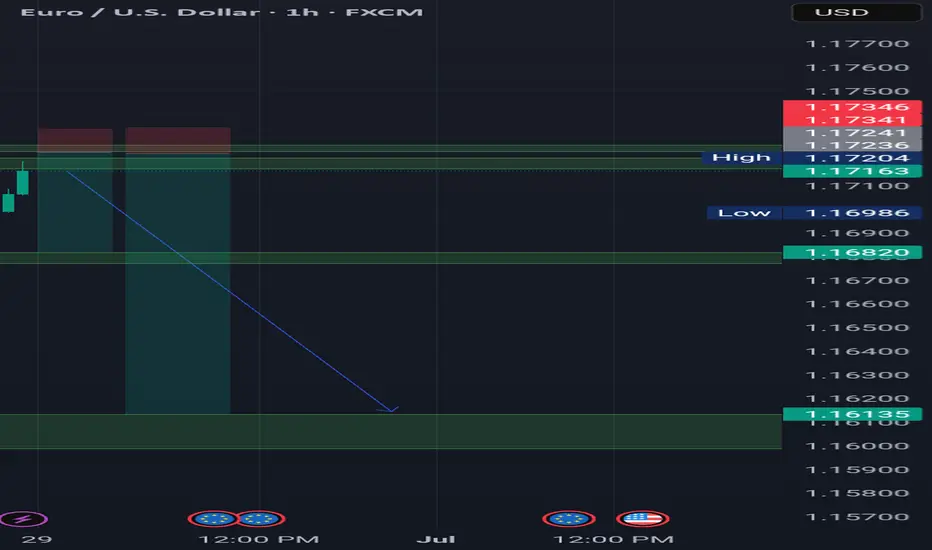
EURUSD H4 RISES 🔄 Disrupted EUR/USD Analysis (4H)
📉 Current Structure:
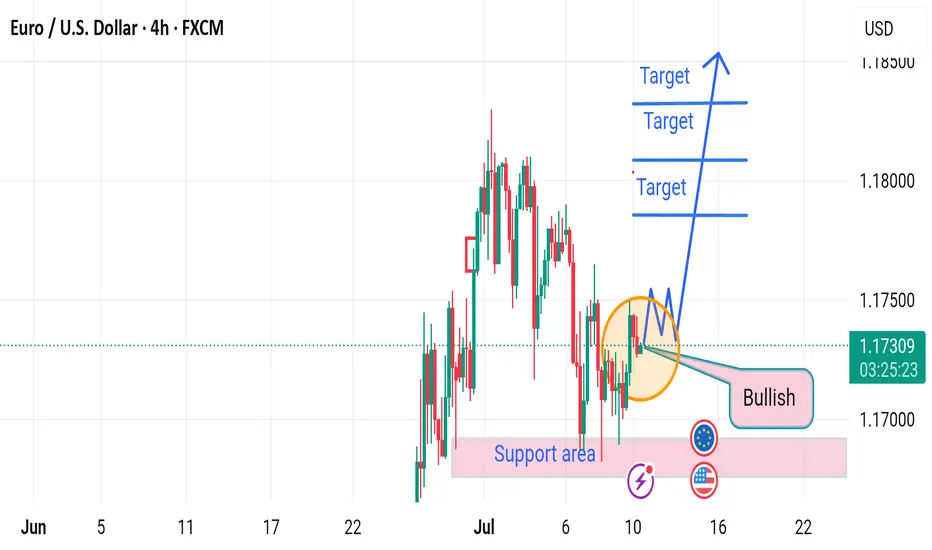
Price is hovering around 1.17298, showing hesitation at the resistance of a potential bearish flag.
While the chart labels this zone as “bullish,” there are signs of market indecision, possibly a fakeout trap.
⚠️ Key Disruptions:
1. Bullish Trap Risk:
The price formed a short-term M-pattern (double top inside the orange circle), indicating bearish exhaustion rather than continuation.
The expected breakout to the upside may fail if bulls don’t sustain volume.
2. Support Area Weakness:
The support zone around 1.17000 has been tested multiple times. If it breaks, it could turn into a strong resistance, flipping the sentiment.
3. Macro Influence:
Upcoming EUR and USD economic events (noted by icons) could cause high volatility and break structure unexpectedly.
A strong USD report could reverse bullish momentum, sending EUR/USD toward 1.16500 or lower.
4. Bearish Continuation Scenario:
If the market breaks down from the current consolidation, expect targets at:
Eurusd bos/making LL swingsAs you can see on the 1 hr tf there's a bos creating a lower low, I think the market made new highs but in the short term i'm expecting the market to balance out fvg before rallying higher. Current bias : bearish short term and bullish long term
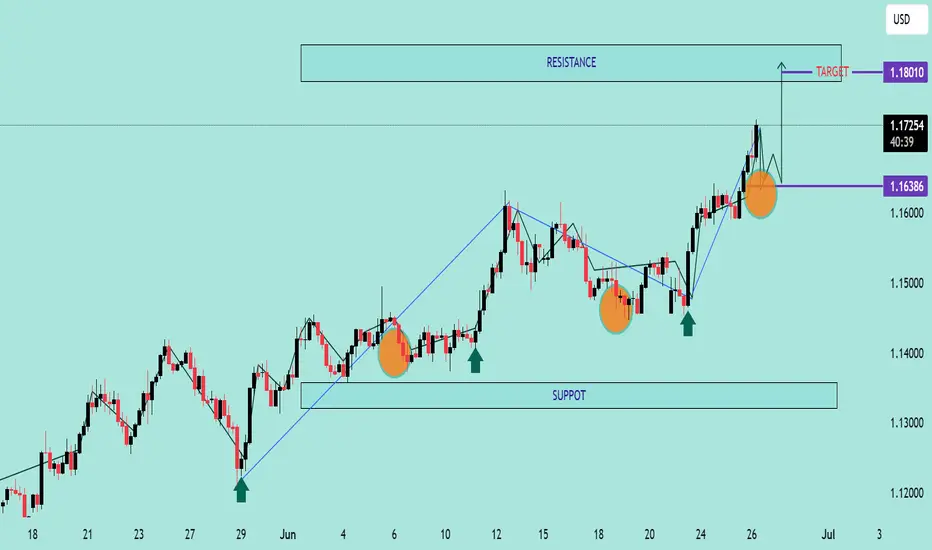
EUR/USD Bullish Continuation Analysis EUR/USD Bullish Continuation Analysis 🚀💶
📊 Chart Summary:
The EUR/USD pair is demonstrating a strong bullish structure with consistent higher highs and higher lows. Recent price action shows a breakout above the 1.16386 resistance level, now acting as support 🛡️. The market is currently retracing and might retest this new support zone before continuing its upward move toward the target.
🔍 Key Observations:
🔸 Bullish Structure:
Multiple bullish impulses have formed a clean staircase pattern (🔼⬆️), indicating sustained buying momentum.
🔸 Support Zone 🟦 (1.13200 - 1.14000):
This zone has been tested multiple times, confirming its strength and the base of this bullish rally.
🔸 Breakout & Retest 🟠:
Price broke above the 1.16386 resistance level, pulled back slightly (highlighted by the orange circle), and now looks ready for a potential continuation to the upside.
🔸 Target 🎯: 1.18010
A clear target has been set based on measured move or resistance projection. If the price respects the current structure, we may see a continuation toward this level.
✅ Trade Outlook:
Bias: Bullish 📈
Entry Zone: Around 1.16386 (upon bullish confirmation)
Target 🎯: 1.18010
Invalidation ❌: Break below 1.1600 with bearish momentum
🧠 Technical Tip:
Always wait for confirmation on the retest before entering. Wick rejections or bullish engulfing candles at the support zone can provide additional entry confidence. 🔍✅
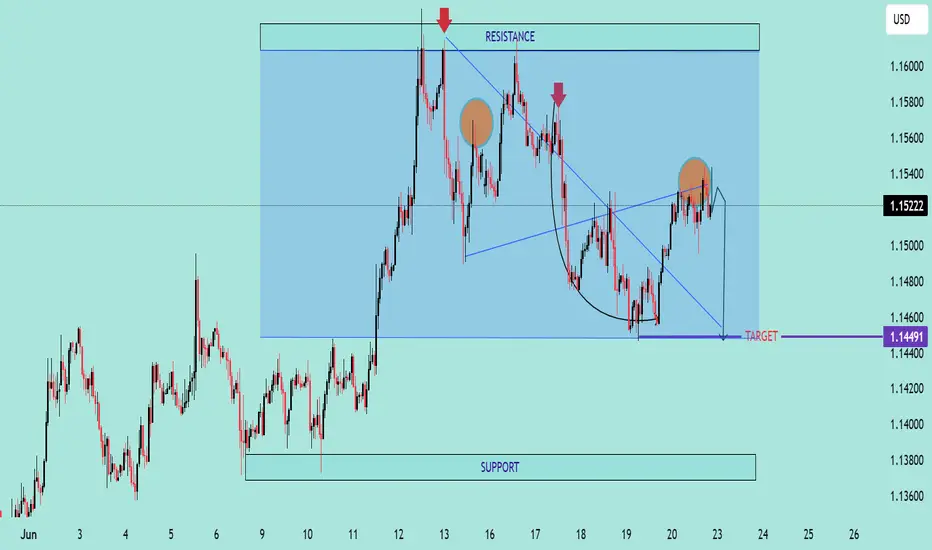
Chartanalyse: Der Chart zeigt eine Seitwärtskonsolidierung mitTechnical Overview:
The EUR/USD chart exhibits signs of a bearish reversal pattern forming near a key resistance zone (1.15800 - 1.16000), highlighted with repeated rejection wicks (🔴 red arrows). Price is currently trading at 1.15222, after failing to hold above the neckline of the rounded bottom pattern.
🔍 Key Observations:
🔺 Resistance Zone: Strong resistance has been confirmed multiple times (red arrows), indicating sellers are active at the top.
🟠 Double Top / Head & Shoulders Behavior: Price action shows topping formations (highlighted with orange circles), suggesting exhaustion of bullish momentum.
📉 Bearish Breakdown Possibility:
Price rejected near neckline and is showing bearish candle formations.
Breakdown from the current consolidation zone could push price toward the target zone at 1.14491, marked in purple.
This aligns with previous support structure, reinforcing a technical downside projection.
🔻 Support Zone: Around 1.13800 - 1.14000 is a strong area of demand and may act as the next bounce point if the bearish move continues.
📐 Chart Pattern Structure:
Rounded bottom formed earlier, but the failure to continue higher and breakout suggests a false breakout trap for buyers.
Downward sloping trendline broke, but now price is struggling to sustain above previous highs.
📌 Conclusion:
⚠️ Caution for bulls as price shows signs of weakness at resistance. A move below 1.15000 may initiate further downside toward 1.14491 and possibly lower. Short-term traders can watch for confirmation candles near this zone for entries.
📅 Short-Term Bias: Bearish
🎯 Target: 1.14491
⛔️ Invalidation: Strong breakout above 1.16000
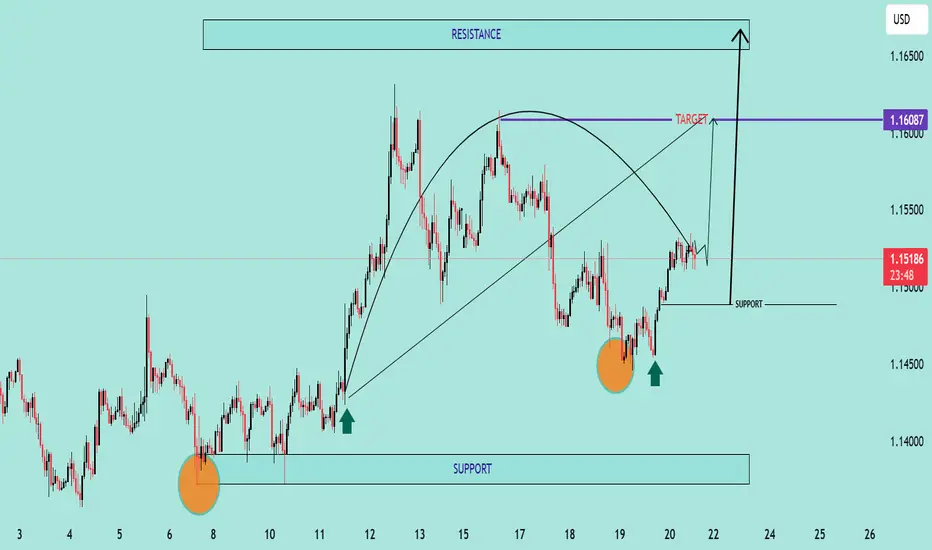
EUR/USD Bullish Reversal Breakout Pattern Technical Analysis Summary:
The chart illustrates a strong bullish reversal pattern forming on the EUR/USD pair:
🔹 Double Bottom Formation (🔶🔶):
Two clear bottom zones are marked with orange circles near the 1.14400–1.14500 area, indicating strong buying interest and support.
The second bottom confirms the double bottom pattern, often a precursor to an upward trend.
🔹 Support Zone (📉):
Firm support around 1.14450, as highlighted on the chart.
Price has respected this zone twice, bouncing back with bullish momentum each time.
🔹 Neckline Breakout (🔼):
Price is approaching the neckline zone at 1.16087, which acts as the bullish target.
A break and close above this neckline will confirm the reversal and open the way toward the resistance zone around 1.16500.
🔹 Projected Move (🎯):
If the neckline breaks, price is expected to surge towards 1.16500, aligning with the historical resistance.
This move completes the measured target projection from the double bottom structure.
🔹 Bullish Structure:
Higher lows and strong bullish candles are reinforcing the uptrend momentum.
Curved trajectory shows accumulation followed by a breakout phase.
📌 Key Levels to Watch:
Support: 1.14450 – 1.14500
Neckline/Target: 1.16087
Resistance: 1.16500
🛑 Invalidation:
A strong breakdown below support (1.14450) would invalidate this bullish setup.
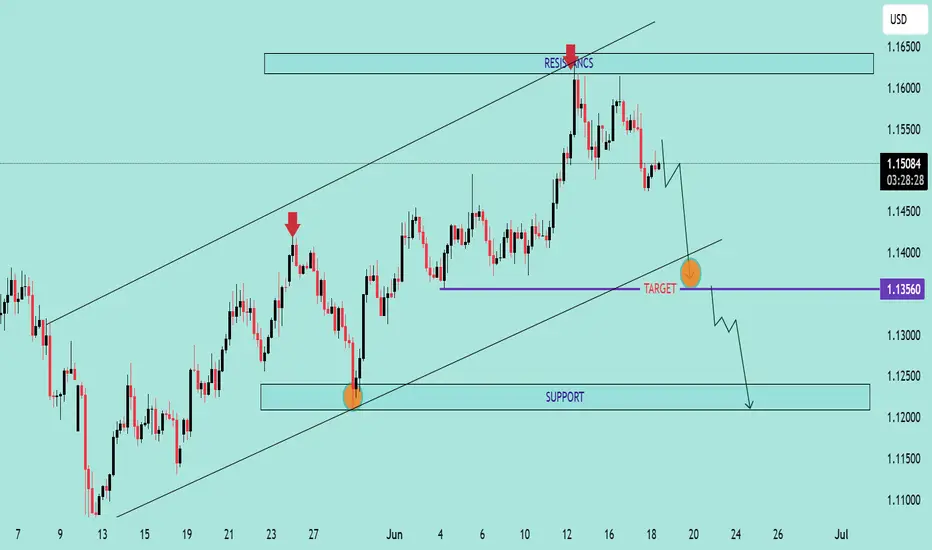
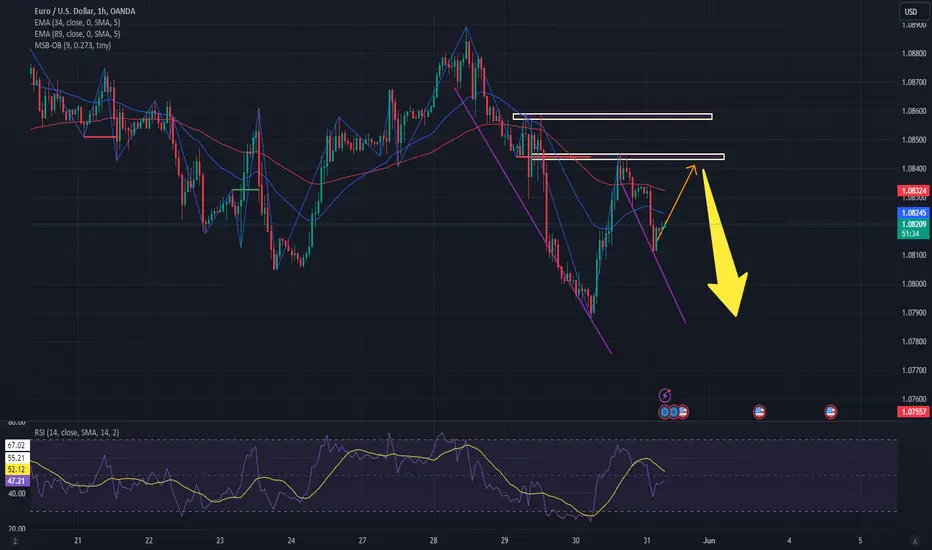
EUR/USD Bearish Reversal AnalysisEUR/USD Bearish Reversal Analysis 📉🧭
🔍 Technical Breakdown:
Trend Structure:
EUR/USD was trading inside an ascending channel, respecting both support and resistance trendlines.
🔴 Double Rejection at Resistance:
Price action faced strong rejection near the upper boundary of the channel and resistance zone (~1.16500), forming a lower high, suggesting bearish exhaustion.
🟠 Key Breakdown Zone:
A critical horizontal support around 1.13560 has been identified as a short-term target zone. This level previously acted as a demand zone and now may be retested.
🔽 Forecast Path:
A projected bearish wave is anticipated:
A potential pullback or consolidation may occur before resuming the downtrend.
Once 1.13560 is broken, price could drop further toward the major support zone around 1.12000, marked by the previous accumulation area.
🟦 Support Zone:
This final target aligns with a major structural support from late May, strengthening the bearish outlook if the breakdown continues.
📌 Conclusion:
EUR/USD is showing signs of a bearish reversal after failing to sustain above resistance. As long as it remains below the mid-channel region, further downside toward 1.12000 is likely, with 1.13560 as the key short-term level to watch.
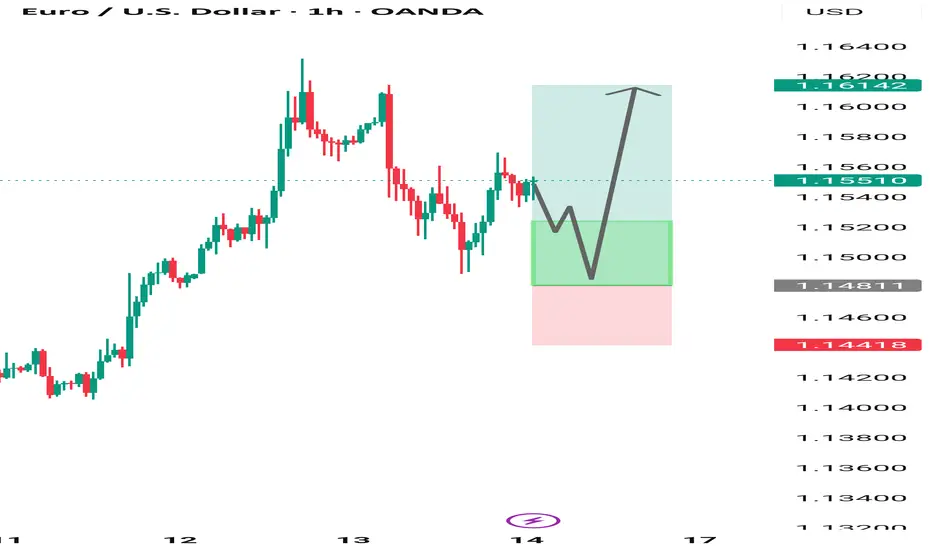
EUR/USD 1-Hour Chart Analysis1-hour candlestick chart for the Euro/US Dollar (EUR/USD) currency pair, sourced from OANDA. The chart highlights a recent price movement with a current value of 1.15510, reflecting a 0.29% decrease (-0.00340). Key price levels are marked, including resistance at 1.16142 and support at 1.14418, with shaded areas indicating potential trading zones. The chart includes a bullish logo and branding from "ALEEGOLDTRADER," suggesting a trading analysis perspective.
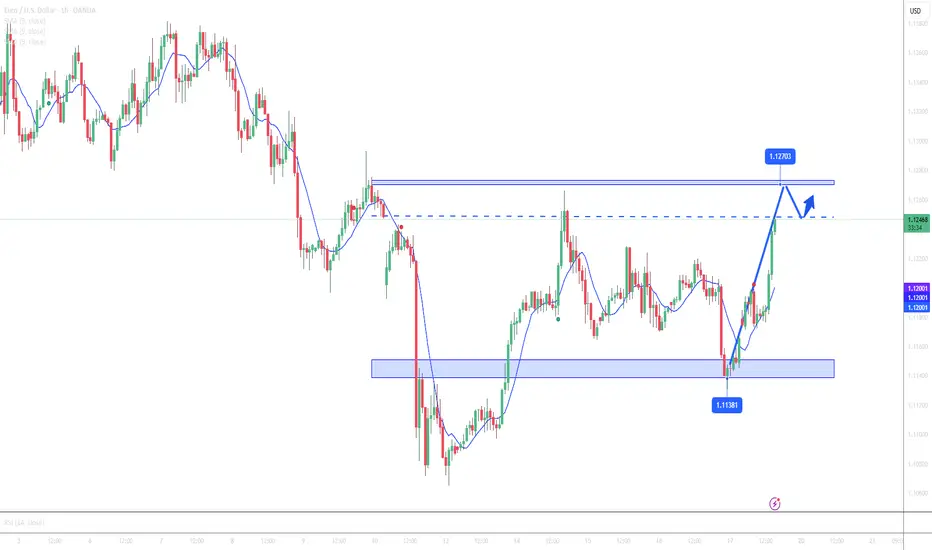
EUR/USD Outlook: Bullish Momentum Builds Toward 1.1270The EUR/USD pair continues its upward trend, trading around 1.1195, supported by a weakening US Dollar following softer-than-expected US inflation data for April. Headline CPI rose just 2.3% YoY—its lowest since February 2021—while core CPI held steady at 2.8%, matching forecasts.
Additionally, Moody’s downgrade of the US credit rating from AAA to AA1 due to concerns over fiscal deficits and rising debt has further pressured the greenback—the USD Index dropped 0.6%.
In the near term, EUR/USD is expected to extend gains if it breaks above the key resistance at 1.1270. However, risk remains if upcoming Federal Reserve speeches adopt a more hawkish tone, which could trigger a USD rebound.
Market participants are also watching Germany’s Harmonized Index of Consumer Prices (HICP), set to be released later today, for fresh direction.
💡 Short-Term Trade Scenarios:
BUY EURUSD: zone 1.11600 - 1.11450
SL: 1.11200
TP: 40 - 60 - 100pips
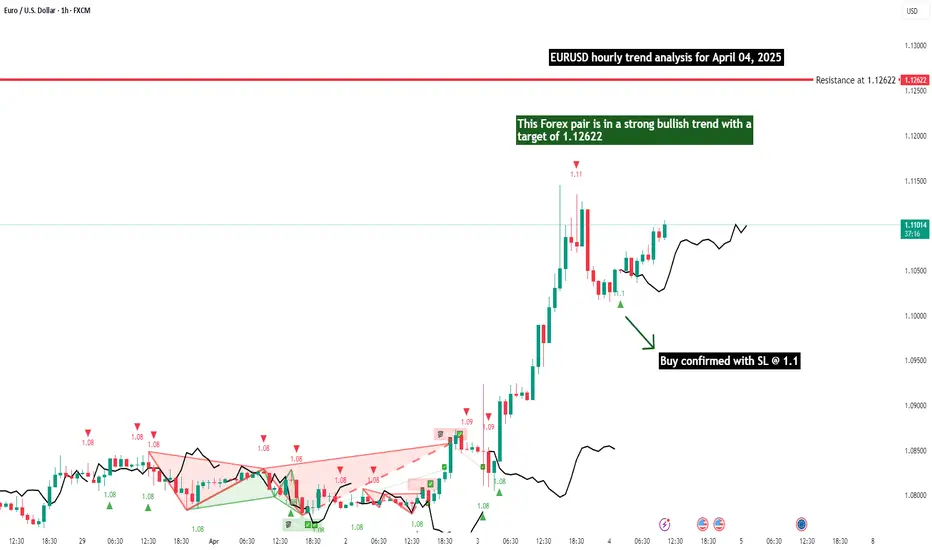
EURUSD hourly trend analysis on April 04, 2025This Forex pair is in a strong bullish trend with a confirmed buy signal with SL at 1.1. There is potential run towards the target of 1.12622. Trade with Stop-Loss.
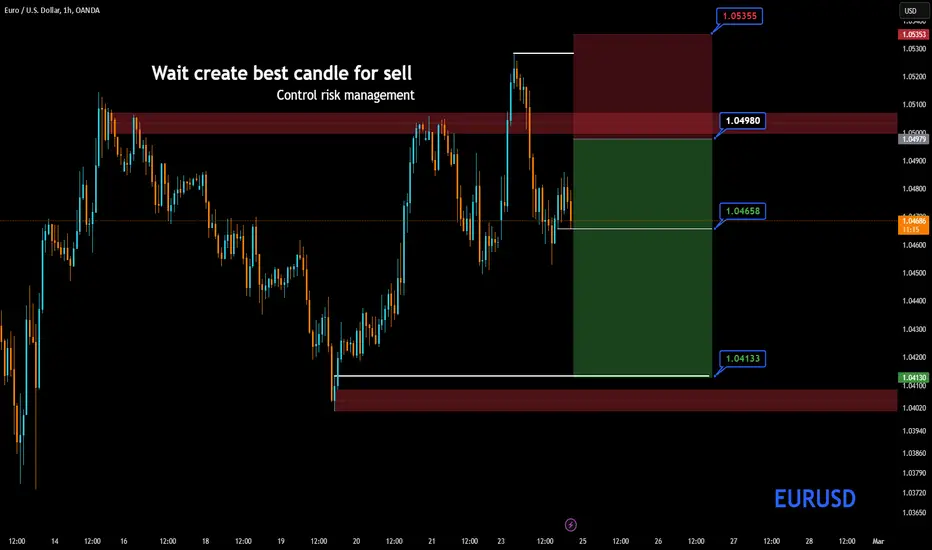
Sell Signal📉 EURUSD Sell Signal 📉
🔹 Wait for the best candle formation before entering the sell trade! Risk management is crucial.
🔹 The 1.04980 resistance zone is considered as the entry point.
🔹 Stop-loss is set at 1.05355 to minimize potential risks.
🔹 Target levels:
✅ First target: 1.04658
✅ Second target: 1.04133
⚠️ Always manage your risk! Make sure to get additional confirmations before entering the trade.
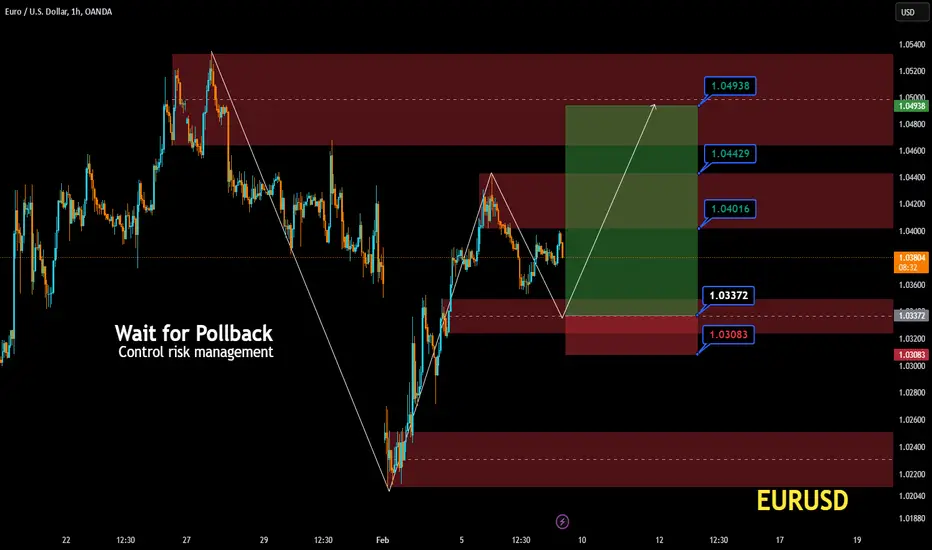
EURUSD Buy📉 EURUSD Signal | 1H Timeframe Analysis
📆 Date: February 7, 2025
🔍 Strategy: Breakout and Risk Management
✅ Suggested Position: Buy after pullback confirmation
🎯 Targets:
First Target: 1.04016
Second Target: 1.04429
Third Target: 1.04938
🛑 Stop Loss: 1.03083
🔄 Entry Level: Confirmed breakout at 1.03372
⚠ Key Points:
Enter if a pullback to 1.03372 is confirmed.
Set stop loss at 1.03083.
Apply proper risk management.
📊 Technical Analysis: The previous downtrend has been corrected, and we are in a demand zone. If the key level breaks, an upward move is expected.
#Forex #TechnicalAnalysis #EURUSD
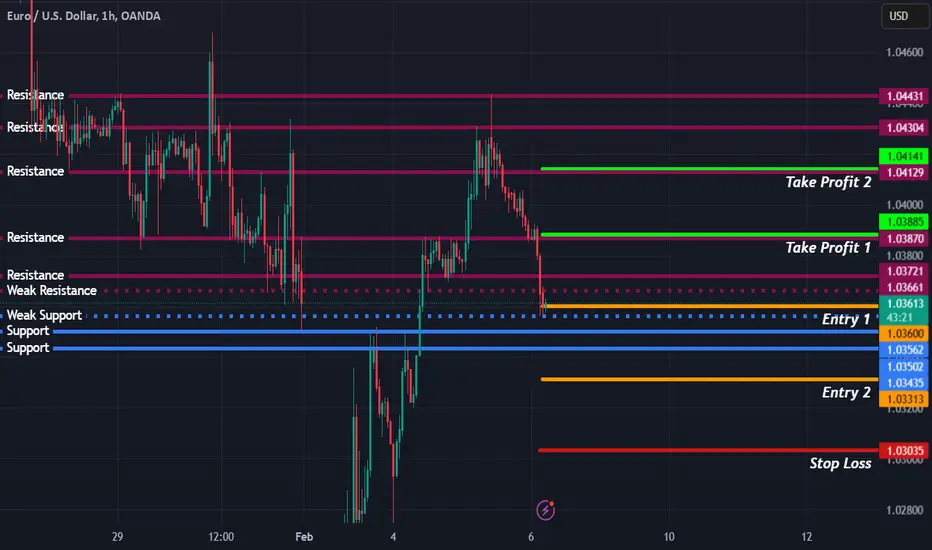
EUR/USD Precision Trading: Dual-Entry Strategy for Max ProfitEUR/USD Smart Entry Strategy: Dual Entries for Maximum Profit Potential
In this setup, I executed a long position on EUR/USD at Entry 1 (1.03602 USD), capitalizing on a well-established support zone and preparing for a potential bullish reversal. To enhance risk management and maximize profit potential, I have also placed a second entry (Entry 2 at 1.03313 USD) in case of a deeper pullback, allowing me to average into the trade at a better price.
Key Elements of the Setup:
Support & Resistance Analysis:
Entry 1 (1.03602 USD): Placed at a weak support zone, where previous price action showed reactions.
Entry 2 (1.03313 USD): Positioned near a stronger support level, providing a better risk-reward entry if price dips further before reversing.
Stop Loss (1.03035 USD): Positioned below the major support zone, ensuring the trade has room to develop while limiting downside risk.
Take Profit Strategy:
Take Profit 1 (1.03885 USD): Located just below a resistance level, securing partial gains before potential rejection.
Take Profit 2 (1.04141 USD): Aiming for the next major resistance level, maximizing profit potential if bullish momentum continues.
Risk Management & Trade Psychology:
By using a dual-entry strategy, I minimize the impact of short-term volatility and improve my overall entry price if the market dips further.
My stop loss placement ensures that if the trade setup invalidates, I exit with minimal damage while maintaining a solid risk-to-reward ratio.
Conclusion:
This trade leverages key support zones, a layered entry strategy, and a well-defined risk-reward framework. If the market respects these support levels, I aim to ride the bullish momentum towards both Take Profit targets, securing a high-probability trade with controlled risk.
FX:EURUSD FOREXCOM:EURUSD OANDA:EURUSD
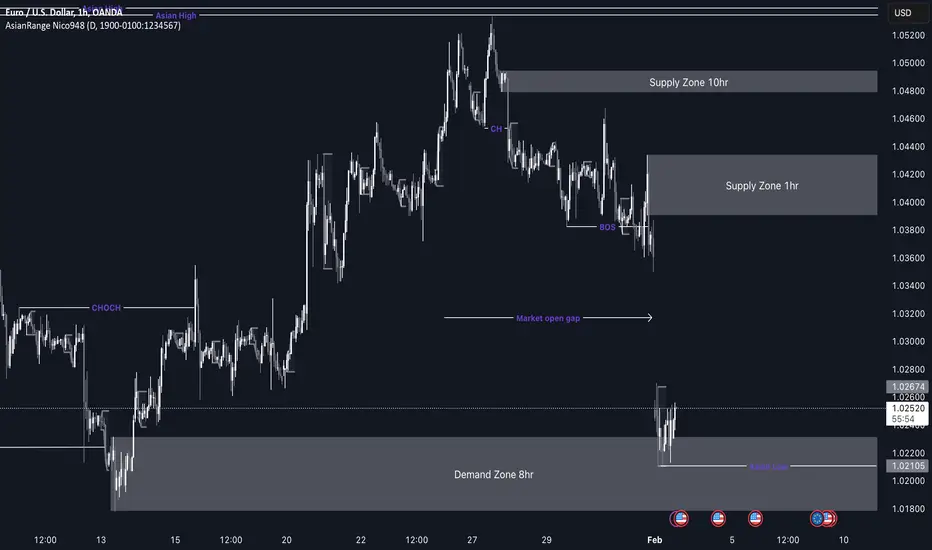
EUR/USD Outlook to recover the imbalance My EU outlook for this week is similar to GU as the dollar index gapped to the upside which made pairs like GU and EU to drop down heavy. once price did so it did breach a lot of my previous demands so we have to now adapt and re adjust our analysis and forecast.
So i have this demand zone that as you can see is getting reacted off of which what i drew out a. while ago which is the 8hr demand zone. I feel like this zone will hold as there is of validity. If price reacts well and manages to cover that gap i will then look to short inside the 1hr supply zone but after finding of course LTF confirmation.
COnfluences for EU Buys are as follows:
- The price gap has left a significant imbalance that needs to be filled.
- Price is currently in a 8-hour demand zone that previously caused a Break of Structure (BOS),
making it a valid POI.
- There is a large pool of liquidity to the upside that needs to be taken.
- The setup aligns well with the DXY correlation.
- For price to carry on going down it must form a correction to the upside regardless.
P.S. If price decides to go lower then we might be in a bearish trend temporarily and will have to look for a new near by supply to capitilise on a shift of trend to the downside. Thats if this 8hr demand doesn't hold.
EURUSD trade setup battle:-Today Euro made 3 months low with also break previous low and holding side . There we can setup a loss free trade setup ::-
Euro have strong support levels @ 1.06000 .
So we have to build buy and sell both position at this time :-
First we have to buy and sell on same strike price with same quantity and hold for target 1.06000 $ than we exit from sell side we get our target and hold buy position for target 🎯 1.08000 level.
Stay tuned with me for more updates and follow me.
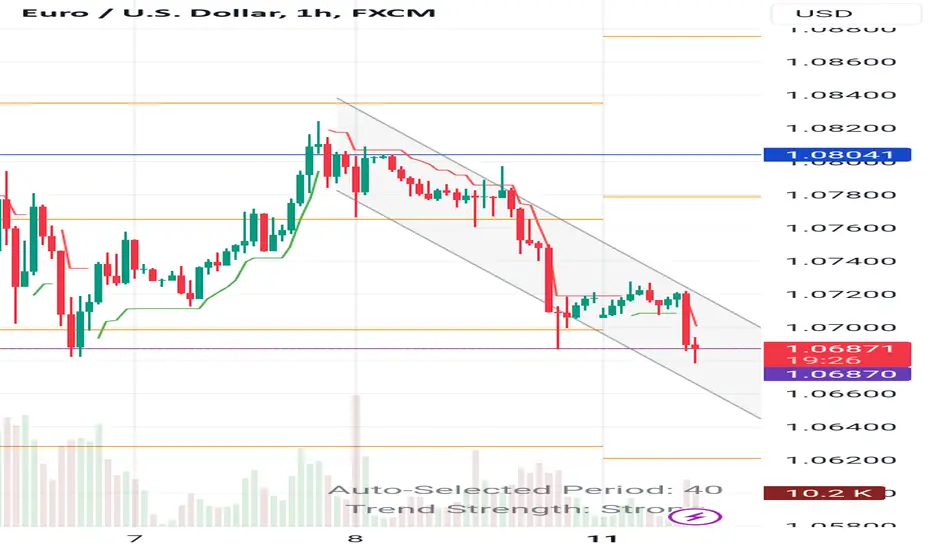
Eurusd H1 EUR/USD failed to extend gains and is back under selling pressure in the American session. United States inflation and employment-related figures kept the Fed on the 25 bps rate cut path.
The Relative Strength Index (RSI) indicator on the 4-hour chart stays near 30, suggesting that the pair is about to turn technically oversold. On the upside, immediate resistance is located at 1.0950 (static level, Fibonacci 61.8% retracement of the latest uptrend). In case EUR/USD stabilizes above this level and confirms it as support, it could edge higher toward 1.1000 (Fibonacci 50% retracement) and 1.1050 (Fibonacci 38.2% retracement).
Confirm
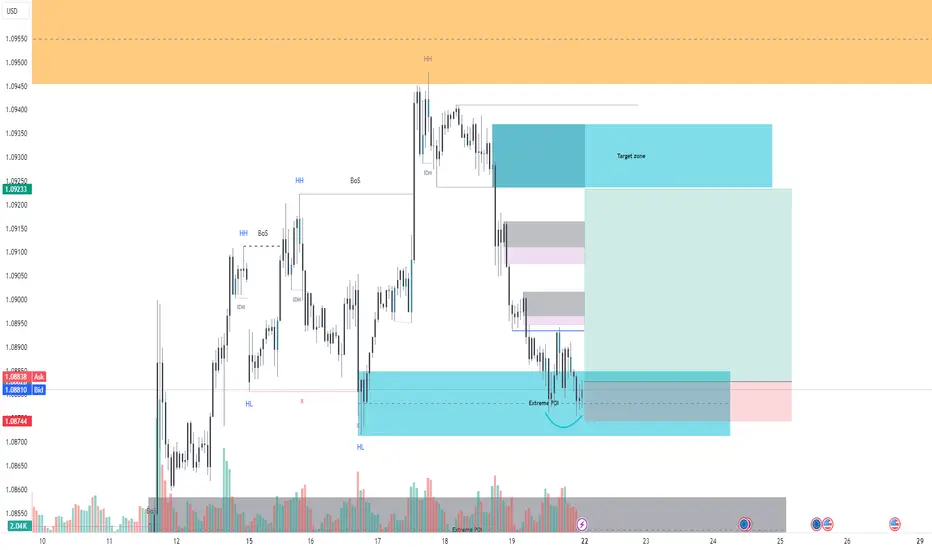
7 Dimension Buy Trade Setup for EURUSD Core Analysis Method: Smart Money Concepts
😇7 Dimension Analysis
Time Frame: H1/M5
1: Swing Structure: Bullish with inducement done. Corrective swing move reaches the extreme POIs, also gives a pullback at the demand level, forming a bullish internal structure. Mitigated all POIs including extreme OB, FVG, and liquidity sweep area inside the structure in the discounted zone. Swing support demand zone plays a significant role at this point and this zone also acts as a change in polarity zone.
2: Pattern
🟢 CHART PATTERNS: Reversal: Double bottom chart patterns also indicate a reversal.
🟢 CANDLE PATTERNS: Momentum: Many bullish and bearish big candles show huge activity in this area, indicating execution momentum is on the sell side and building momentum on the buy side, but buyers look strong. Narrow range 4 pattern possibly formed and a tower bottom is also fully formed, indicating a buy-side reversal.
3: Volume
🟢 Fixed Range: According to this, many bulls are active in this area and have very good buy pressure.
4: Momentum RSI
🟢 With 2 bullish divergences in the bearish range indicating a momentum shift from bearish to sideways range shift.
5: Volatility Bollinger Bands
🟢 After corrective volatility expansion, now volatility is going to cool down and might be for one day, price can consolidate in this range and then start another impulsive move on the bull side with a possible upper band squeeze breakout walking on the band because right at this level we also see a W Bollinger band pattern and lower band puncher.
6: Strength: EUR is strong.
7: Sentiment: All indicators point to buy sentiments.
✔️ Entry Time Frame: M5
✅ Entry TF Structure: CHOCH in M5 and also mitigated all the POIs in entry time frames
☑️ M5 Trend Line Broke
💡 Decision: Buy
🚀 Entry: 1.08845
✋ Stop Loss: 1.08753
🎯 Take Profit: 1.09232
😊 Risk to Reward Ratio: 4.24 RR
🕛 Expected Duration: 2 Days
Short SUMMARY: Analysis supports a strong buy position based on the Smart Money Concepts methodology.
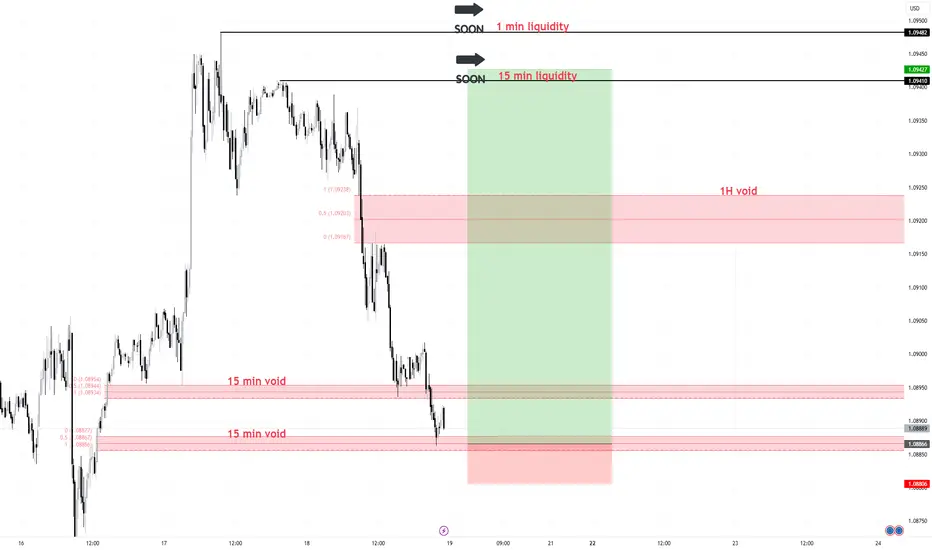
Bullish B.O.S / Liquidity Formed (target) / Voids for respect> 15 Min Void (1st Void taken out - possible sign of 2nd void can be taken out
> 1 Hour Liquidity as target (POI)
> Bullish structure on higher time frames
> 1 Hour Void is created from one candle on 1H timeframe raising confluence of price no brainer has to fill this void (DEMAND) & Slippage *because single candle*
> Price resisting going lower
Euro Slumps on Populist Surge: A Trader's Guide to Uncertainty
The European political landscape has just thrown a curveball at the financial markets. A recent poll indicating a rise in populist and eurosceptic parties has sent shockwaves through the system, triggering a significant drop in the euro. This newfound uncertainty presents both risks and opportunities for traders, demanding a strategic shift in approach.
The poll results paint a picture of a fractured Europe, with anxieties swirling about the future unity and stability of the European Union. Investors, understandably jittery, have reacted swiftly by pulling back on euro-denominated assets. This has resulted in a sharp decline in the euro's value against other major currencies. The coming days and weeks are likely to be marked by continued volatility in the eurozone, creating a complex environment for traders to navigate.
Adaptability is paramount in this climate. With the potential for further political escalation, the euro's depreciation could accelerate. In such a scenario, shorting the euro – essentially betting on its decline – could be a viable strategy. However, this is a tactic that requires meticulous planning and precise timing. Traders must carefully weigh the risks involved against the profit potential.
To make informed decisions, staying abreast of developments is crucial. Closely monitoring the political climate and key economic indicators that could influence the euro is essential. Real-time news updates, expert analysis, and access to reliable data sources are your weapons of choice in these turbulent waters. Additionally, implementing robust risk management techniques will be your safety net, protecting your investments from unforeseen market swings.
The current situation presents a unique opportunity for astute traders. By evaluating existing positions, considering the potential benefits of shorting the euro, and formulating a well-defined strategy, you can transform these challenges into opportunities. While the path ahead may be unclear, adopting the right approach can empower you to thrive in this volatile market.
By following these steps and leveraging our resources, you can transform uncertainty into an advantage and emerge from this market turbulence a winner.
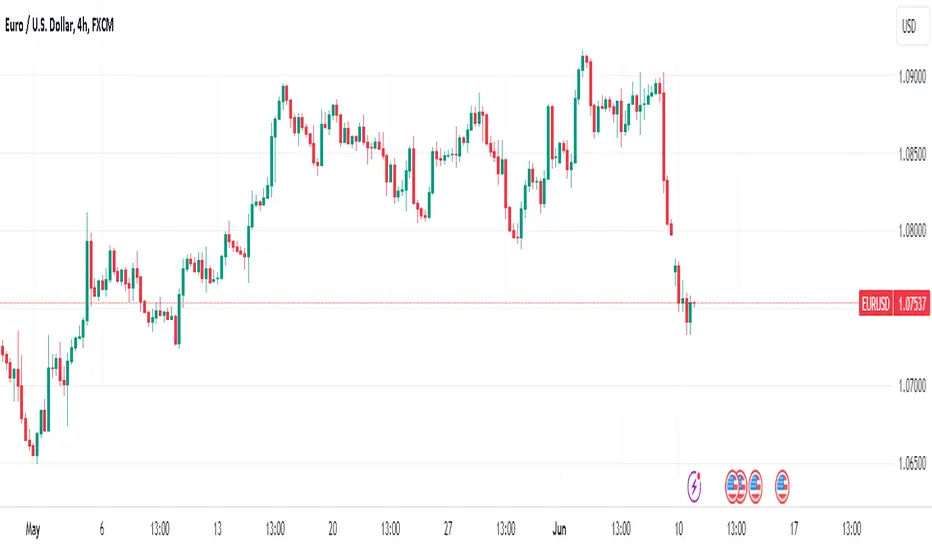
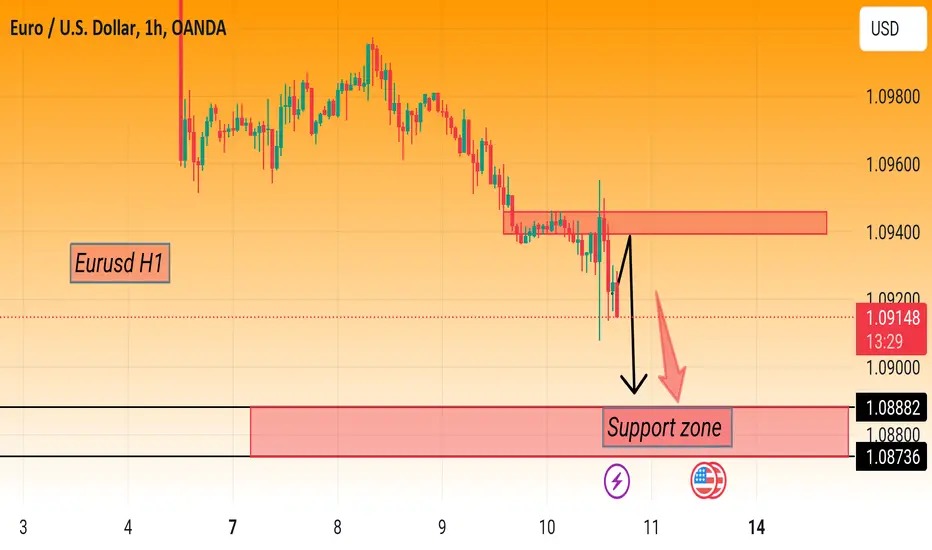
EURUSD - in strong downtrendEURUSD - May 31, 2024
Today EURUSD stays in a downtrend, yesterday`s restoration turned into short-lived and the pair remains on course to attain 1.0800 once more withinside the early buying and selling hours of the month. weekend session.
Accordingly, the outlook remains favorable for dealers while EURUSD remains beneath many vital resistance stages and regularly lowering in step with the energetic Trendine line.
In addition, with the growing probability that the ECB will lessen hobby fees earlier than the Fed, the opportunity of the EUR/USD trade price persevering with to weaken wishes to be taken into consideration withinside the medium term.
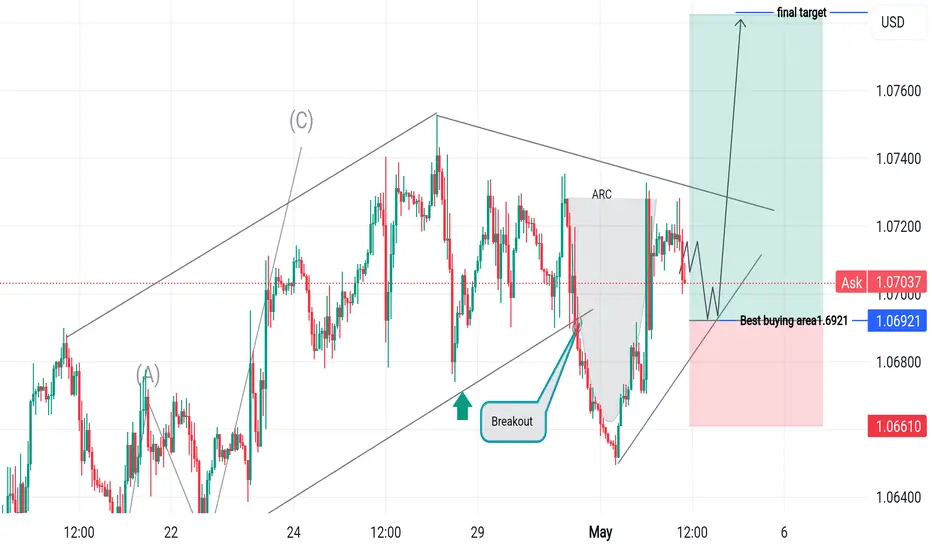
EURUSD UPDATE LOOKING FOR BUY LONG
Hey team Hope you are Enjoying our ideas and Analysis. Today in Running Session we are Monitoring EURUSD For a Buying Opportunity Around 1.07068 , Once more Best Buying Area Around 1.06921. So Previous There is also a Breakout That we have Clearly Mentioned in Chart pattern . When we will Receive any Bullish Conformation the Trade Will be Excuted
Good Luck Guys 🤞👍