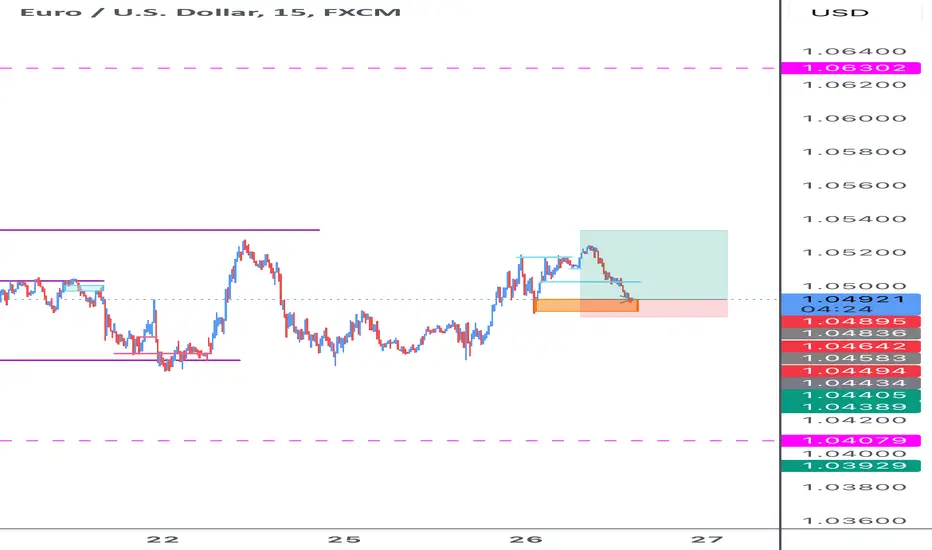
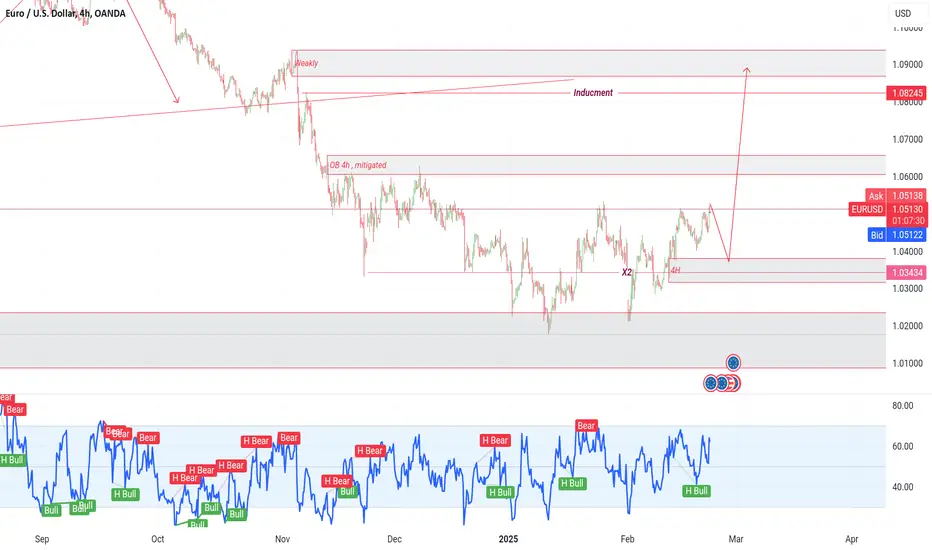
EURUSD:SIGNALHello friends
Due to the recent price growth, the price has now corrected in a support range.
Now, if the price continues to fall within the specified support ranges, we can make purchases with capital management and move to the specified targets.
*Trade safely with us*
Eurusddaily
Euro Stablecoin BOOMS: Bye, USD?The Euro Stablecoin Ascends: EURC Hits Record High as Traders Eye Dollar Alternatives Amid Global Uncertainty
For years, the digital asset landscape has been dominated by the US dollar, not just in trading volume but fundamentally through the ubiquity of USD-pegged stablecoins. Tokens like Tether (USDT) and Circle's own USD Coin (USDC) have become the bedrock of the crypto economy, acting as crucial bridges between volatile cryptocurrencies and traditional fiat, facilitating trading, lending, and yield generation within decentralized finance (DeFi). However, the winds of change may be subtly shifting. Amidst a backdrop of persistent global trade tensions, geopolitical maneuvering, and questions surrounding the long-term trajectory of the US dollar, alternative fiat-backed stablecoins are gaining traction. Leading this nascent charge is the Euro Coin (EURC), Circle's Euro-backed offering, which recently surged to a record market capitalization exceeding $246 million.
This milestone, while still dwarfed by its multi-billion dollar USD counterparts, is significant. It signals a growing appetite among traders, investors, and institutions for stable digital assets pegged to currencies other than the greenback. The rise of EURC isn't happening in a vacuum; it reflects a confluence of factors challenging the dollar's undisputed reign in the digital sphere and highlighting the strategic appeal of diversification.
Understanding the Stablecoin Status Quo and the Dollar's Dominance
Stablecoins are indispensable cogs in the crypto machine. They offer price stability relative to a specific asset (usually a major fiat currency), allowing market participants to park funds, calculate profits, pay for services, and interact with DeFi protocols without the wild price swings characteristic of Bitcoin or Ethereum. USDT and USDC have achieved massive network effects, integrated across countless exchanges, wallets, and DeFi applications, making them the default choice for liquidity and settlement.
Their success, however, inherently ties a vast swathe of the digital economy to the US dollar's fate and US monetary policy. For international users, particularly those operating primarily within the Eurozone or holding significant Euro-denominated assets or liabilities, relying solely on USD stablecoins introduces foreign exchange (FX) risk and potential conversion inefficiencies.
Enter EURC: A Regulated Euro On-Chain
Launched by Circle, the same regulated fintech firm behind the highly successful USDC, Euro Coin (EURC) aims to replicate the trust and utility of its dollar sibling, but pegged 1:1 to the Euro. Each EURC token is intended to be fully backed by Euros held in dedicated, segregated bank accounts under Circle's custody. This emphasis on transparency and regulatory compliance, mirroring the approach taken with USDC, is crucial for building trust, especially among institutional players wary of less transparent stablecoin issuers.
The recent surge in EURC's supply to over €246 million (equivalent to ~$246 million at the time of the record, assuming near parity for simplicity, though the exact USD value fluctuates) indicates accelerating adoption. This growth isn't just passive accumulation; it suggests active minting driven by real demand.
Why the Shift? Trade Uncertainty and the Allure of Diversification
The primary catalyst cited for this growing interest in non-USD stablecoins is the pervasive sense of uncertainty clouding the global trade environment and the US dollar's outlook. Several factors contribute to this:
1. Geopolitical Tensions & Deglobalization Trends: Ongoing conflicts, shifting alliances, and a move towards regional trading blocs can create volatility and potentially weaken dominant currencies like the dollar as nations explore alternative payment and reserve systems.
2. US Economic Concerns: Debates around US national debt levels, inflation trajectory, and the Federal Reserve's monetary policy decisions can lead some international investors and traders to hedge against potential dollar depreciation.
3. Desire for FX Hedging: Businesses and traders operating significantly within the Eurozone may prefer a Euro-native stablecoin to minimize the costs and risks associated with constantly converting between EUR and USD stablecoins. Holding EURC directly aligns their digital cash position with their operational currency.
4. European Regulatory Clarity (MiCA): The implementation of the Markets in Crypto-Assets (MiCA) regulation in the European Union provides a clearer framework for stablecoin issuers and users within the bloc, potentially boosting confidence in well-regulated Euro stablecoins like EURC.
5. DeFi Diversification: As the DeFi ecosystem matures, users are seeking more diverse collateral types and trading pairs. EURC allows for the creation of Euro-based liquidity pools and lending markets, catering to a specific user base and reducing systemic reliance on USD assets.
Traders aren't necessarily predicting an imminent dollar collapse, but rather strategically positioning themselves to mitigate risk. Holding a portion of their stable digital assets in EURC provides a hedge – if the dollar weakens against the Euro, the value of their EURC holdings, when measured in dollars, would increase, offsetting potential losses on USD-denominated assets.
Use Cases and Potential Beyond Hedging
While hedging FX risk is a significant driver, the utility of EURC extends further:
• Seamless Euro Transactions: Facilitates frictionless payments and settlements within the Eurozone using blockchain technology.
• European DeFi Growth: Enables the development of DeFi applications tailored to the European market, offering Euro-based borrowing, lending, and yield opportunities.
• Remittances: Potentially offers a more efficient channel for cross-border Euro transfers compared to traditional banking rails.
• Trading Pairs: Allows exchanges to offer direct EURC trading pairs against various cryptocurrencies, simplifying the process for Euro-based traders.
Challenges and the Road Ahead
Despite its record supply, EURC faces hurdles. Its market capitalization and liquidity remain a fraction of USDT's and USDC's. This lower liquidity can mean higher slippage on large trades and limits its immediate utility as deep collateral in major DeFi protocols, which thrive on multi-billion dollar liquidity pools. Building the network effect – getting listed on more exchanges, integrated into more wallets, and accepted by more DeFi platforms – takes time and concerted effort.
Furthermore, EURC's success is intrinsically linked to the stability and economic health of the Eurozone itself. It diversifies away from the dollar, but not away from fiat risk entirely. The regulatory landscape, while clarifying under MiCA, will continue to evolve and shape the operational environment.
Conclusion: A Sign of a Maturing Market
The surge in Circle's EURC supply to over $246 million is more than just a numerical milestone; it's a tangible indicator of a maturing stablecoin market seeking diversification beyond the US dollar. Driven by global trade uncertainties, geopolitical shifts, and a desire among European users and savvy traders to hedge FX risk, Euro-based stablecoins are carving out a growing niche. While the dollar-pegged giants still dominate, the ascent of well-regulated alternatives like EURC signifies a crucial step towards a potentially multi-polar stablecoin future. It underscores the demand for trusted, compliant digital representations of major world currencies, offering users greater choice and resilience in an increasingly complex global financial landscape. The journey for EURC and its Euro counterparts is still in its early stages, but the trend towards diversification is clear, promising a more varied and potentially more stable digital asset ecosystem ahead.
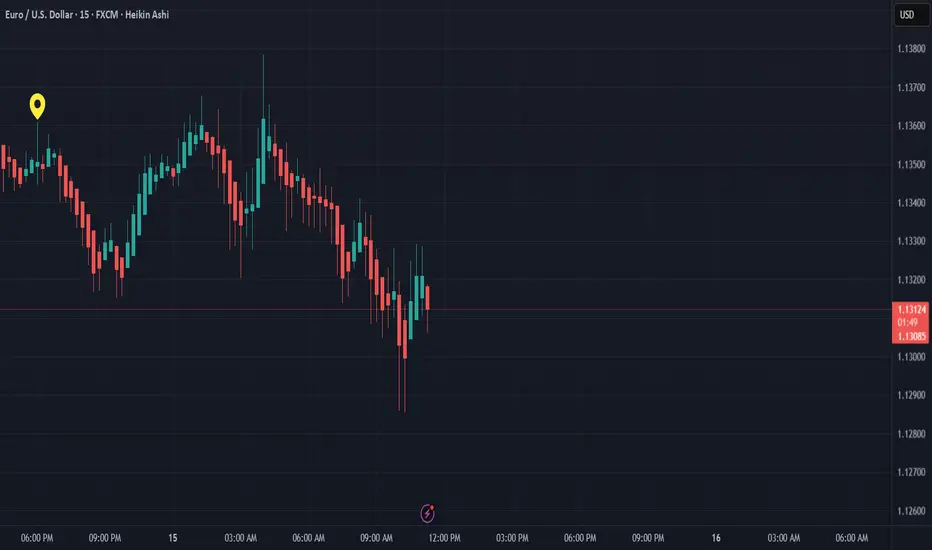
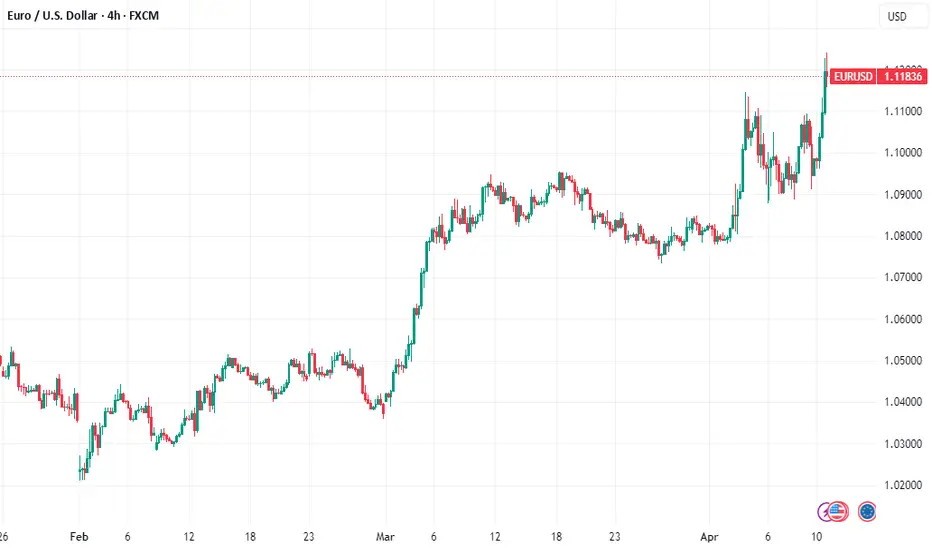
EURUSD LIVE TRADE AND EDUCATIONAL BREAKDOWN EUR/USD remains offered and below 1.1300
EUR/USD is feeling the squeeze, revisiting the area below its key 1.1300 support as the US Dollar gains extra momentum on Tuesday. Mixed domestic data hasn't done the Euro any favours either.

EURUSD signalsI’ll be sharing valuable information over the next 30 days. After that, I’m going private. Anyone interested is more than welcome to follow—this is a space where stop losses don’t exist.
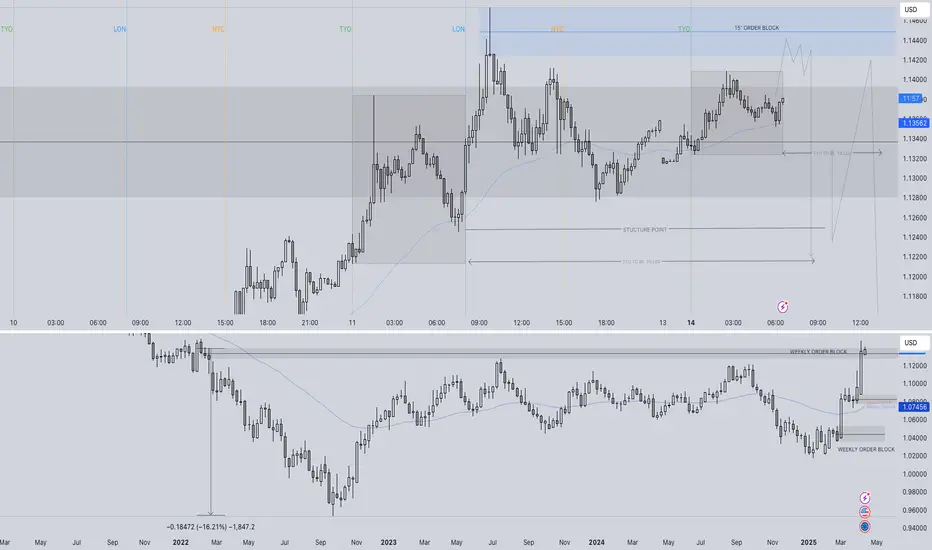
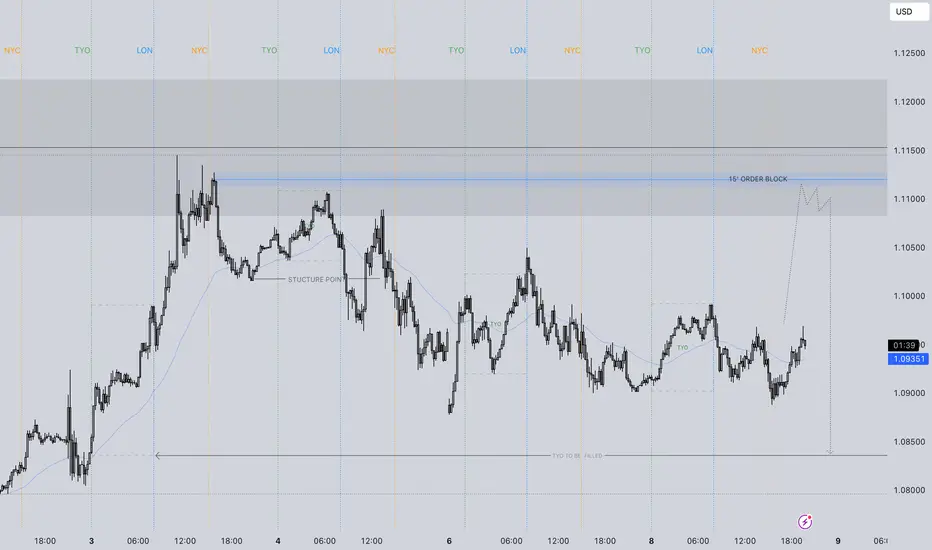
EURUSD SHORT FORECAST Q2 W16 D14 Y25EURUSD SHORT FORECAST Q2 W16 D14 Y25
- Weekly Order Block rejection
Setup 1
-15' break of structure
- Tokyo low range remains
- Pull back into 15' order block
- Lower time frame shift in price action from bullish to bearish
Setup 2
- Lower time frame break of structure
- Lower time frame bearish candle formation
Let's see how EURUSD short set up plays.
Certainly short potential but as always. We await price action to present itself to us.
It is far too easy to find a position once we have noticed potential. Sit back and await the play!
EURUSD SHORT FORECAST Q2 W16 D14 Y25
FRGNT X
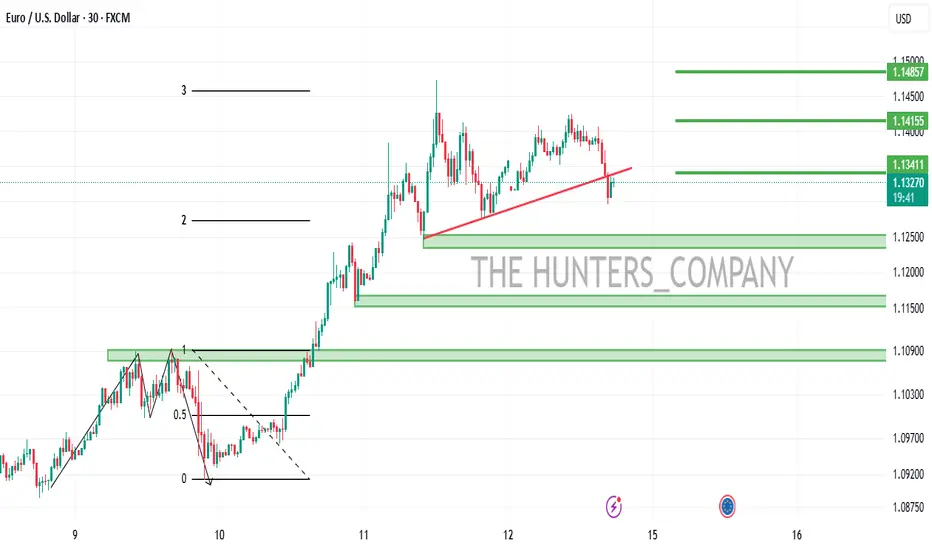
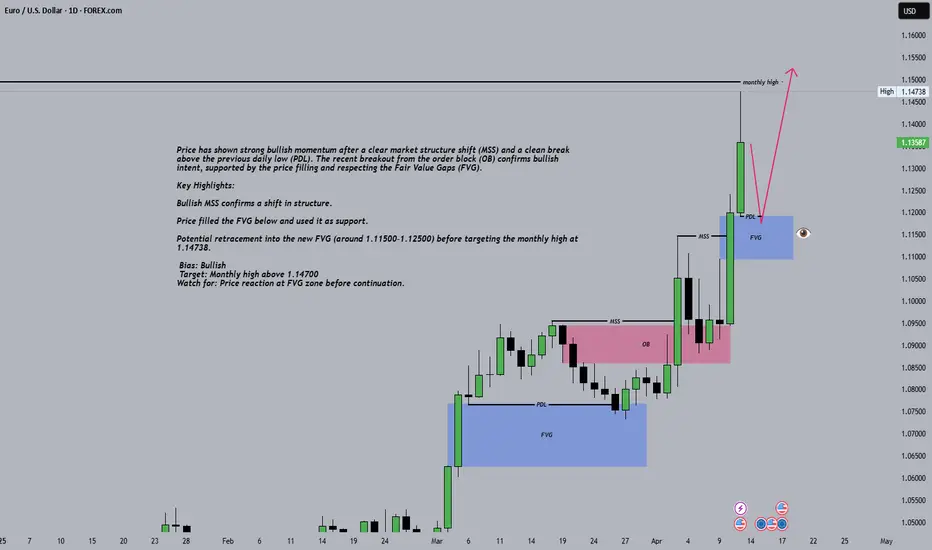
EURUSD Daily Analysis 📊 EURUSD Daily Chart – 12/04/2025
Price has shown strong bullish momentum after a clear market structure shift (MSS) and a clean break above the previous daily low (PDL). The recent breakout from the order block (OB) confirms bullish intent, supported by the price filling and respecting the Fair Value Gaps (FVG).
🔍 Key Highlights:
Bullish MSS confirms a shift in structure.
Price filled the FVG below and used it as support.
Potential retracement into the new FVG (around 1.11500–1.12500) before targeting the monthly high at 1.14738.
📈 Bias: Bullish
📌 Target: Monthly high above 1.14700
📉 Watch for: Price reaction at FVG zone before continuation.
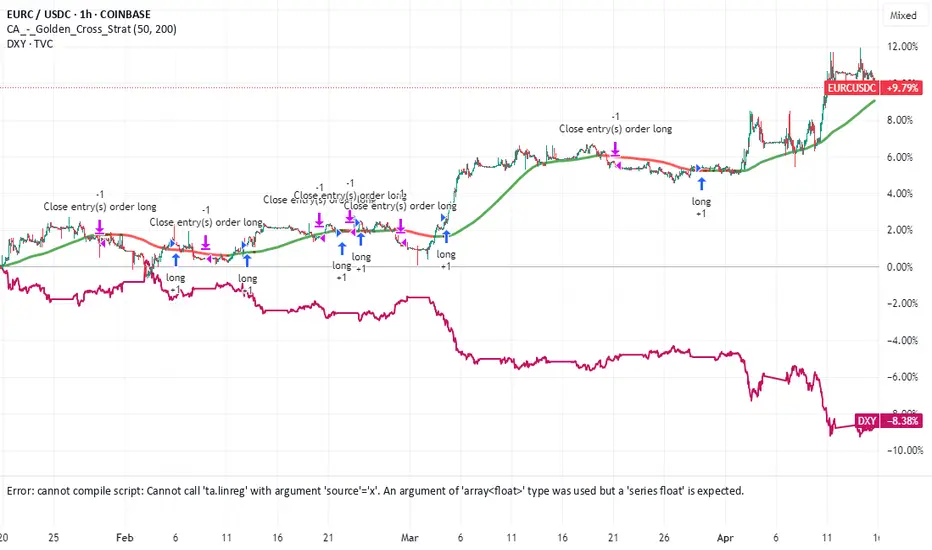
FX Liquidity 'Worse Than Covid' Amid Tariff Shock. Long EUR/USD?Liquidity Seizes Up: Dealers Report Conditions 'Worse Than Covid' Amid Tariff Turmoil
The intricate plumbing of the global foreign exchange market, typically the world's deepest and most liquid financial arena, experienced a severe blockage in recent days, with dealers reporting liquidity conditions even more challenging than during the peak of the Covid-19 crisis in early 2020. Triggered by the sudden announcement of potential sweeping tariffs by former US President Donald Trump, the ability to execute large trades without significantly moving prices evaporated, creating treacherous conditions for market participants before a temporary pause on the tariff implementation offered a brief respite.
Reports indicate that available liquidity for a single transaction, or "clip," in major currency pairs plummeted to lows around $20 million. While this figure might still sound substantial, it represents a dramatic reduction from the norms in the multi-trillion dollar-a-day spot FX market, where clips of $50 million, $100 million, or even more could typically be absorbed with minimal market impact, especially in benchmark pairs like EUR/USD.
This liquidity drought occurred paradoxically alongside a spike in overall trading volumes. Both algorithmic trading systems and human traders on principal desks were highly active, reacting to the news flow and heightened volatility. However, this surge in activity masked a fundamental deterioration in market quality. High volume accompanied by low liquidity signifies frantic, often smaller, trades occurring across widening bid-ask spreads, with market makers unwilling or unable to provide firm quotes for substantial sizes. It's the market equivalent of a crowded room where everyone is shouting, but no one is willing to make a firm commitment.
Why 'Worse Than Covid'? Unpacking Dealer Sentiment
The comparison to the Covid-19 crisis is stark and revealing. The initial wave of the pandemic in March 2020 caused unprecedented volatility across all asset classes as the world grappled with lockdowns and economic shutdowns. FX liquidity certainly suffered then, with spreads widening dramatically. However, dealers suggest the current environment, driven by tariff uncertainty, felt different, and arguably worse, for several reasons:
1. Nature of the Shock: Covid-19, while devastating, was primarily a health crisis with economic consequences. Central banks globally responded with massive, coordinated liquidity injections and policy easing, providing a clear backstop (even if the initial shock was severe). The tariff announcement, however, represents a political and policy shock. Its potential impact is multifaceted – affecting inflation, growth, supply chains, corporate earnings, and international relations – and far harder to model. The policy path forward, including potential retaliation from other countries, is deeply uncertain.
2. Central Bank Reaction Function: During Covid, the playbook for central banks was relatively clear: provide liquidity and ease financial conditions. In response to potential tariffs, the central bank reaction is much less certain. Tariffs could be inflationary (raising import costs), potentially pushing central banks towards tighter policy, while simultaneously being negative for growth, which might argue for easing. This ambiguity makes it harder for markets to price in a predictable policy response, adding another layer of uncertainty that dampens risk appetite and liquidity provision.
3. Fundamental Uncertainty vs. Panic: While Covid induced panic, the underlying driver was identifiable. The tariff threat introduces deep uncertainty about the fundamental rules of global trade. This makes it exceptionally difficult for market makers, who provide liquidity, to price risk accurately. When risk becomes unquantifiable, the natural reaction is to withdraw, reduce quote sizes, and widen spreads significantly to avoid being caught on the wrong side of a large, unhedged position.
The Tariff Trigger: A Wrench in the Works
Donald Trump's proposal for a "reciprocal" or blanket tariff system, potentially starting at 10% on all imports with higher rates for specific countries, fundamentally challenges the existing global trade framework. The announcement immediately forced market participants to reassess:
• Inflation Outlook: Tariffs directly increase the cost of imported goods, potentially fueling inflation and impacting interest rate expectations.
• Economic Growth: Trade wars can disrupt supply chains, raise business costs, reduce export competitiveness (due to retaliation), and dampen consumer and business confidence, weighing on growth.
• Currency Valuations: Currencies of countries heavily reliant on exports to the US, or those potentially facing steep retaliatory tariffs, came under pressure. The US dollar itself experienced volatility as markets weighed the inflationary impact against the potential growth slowdown and risk-aversion flows.
This complex interplay of factors, combined with the political uncertainty surrounding the implementation and potential scope of such policies, created a perfect storm for volatility. Algorithmic systems, programmed based on historical correlations and data, struggled to navigate a potential regime shift driven by policy pronouncements. Human traders, facing heightened risk and uncertainty, became more cautious. Liquidity providers, facing the risk of being adversely selected (i.e., only trading when the market is about to move sharply against them), drastically reduced their exposure.
The Impact: Beyond the Trading Desks
The evaporation of liquidity has real-world consequences:
• Increased Transaction Costs: Corporates needing to hedge currency exposure for international trade face higher costs (wider spreads).
• Execution Risk: Asset managers rebalancing global portfolios find it harder and more expensive to execute large trades, potentially suffering significant slippage (the difference between the expected execution price and the actual price).
• Systemic Risk: In highly leveraged markets, poor liquidity can exacerbate sell-offs. Margin calls, as reportedly seen alongside the tariff news, can force leveraged players to liquidate positions rapidly into an illiquid market, potentially triggering a domino effect.
The temporary pause in the tariff implementation announced subsequently provided some relief, likely allowing liquidity to recover partially from the extreme lows. However, the underlying uncertainty hasn't disappeared. Until there is greater clarity on the future direction of US trade policy, the FX market is likely to remain susceptible to bouts of nervousness and reduced liquidity.
Should You Long EUR/USD Based on This? A Cautious No.
While the liquidity situation is dire and reflects significant market stress, using poor FX liquidity itself as a primary reason to take a directional view, such as longing EUR/USD, is generally flawed logic.
Here's why:
1. Liquidity is Not Direction: Market liquidity reflects the ease and cost of transacting, not necessarily the fundamental direction of an asset price. Poor liquidity is a symptom of high volatility, uncertainty, and risk aversion. While these factors can influence currency direction (e.g., risk aversion often benefits perceived safe-haven currencies), the liquidity state itself isn't the driver. Both buyers and sellers face the same poor liquidity.
2. Universal Impact: The reported liquidity crunch affected the global spot FX market. While specific pairs might have been hit harder at times, the underlying issue was broad-based risk aversion and dealer pullback, impacting EUR/USD, USD/JPY, GBP/USD, and others. It doesn't inherently favor the Euro over the Dollar.
3. Focus on Fundamentals and Sentiment: A decision to long EUR/USD should be based on a broader analysis of:
o Relative Monetary Policy: Expectations for the European Central Bank (ECB) versus the US Federal Reserve (Fed).
o Economic Outlook: Growth prospects in the Eurozone versus the United States.
o Risk Sentiment: Is the broader market mood risk-on (often favoring EUR) or risk-off (which can sometimes favor USD, though the tariff news complicated this)?
o Tariff Impact Analysis: How would the proposed tariffs, if implemented, differentially impact the Eurozone and US economies? Would potential EU retaliation harm the US more, or vice-versa?
4. Increased Trading Risk: Poor liquidity makes any trade riskier and more expensive. Spreads are wider, meaning entry and exit costs are higher. Slippage on stop-loss orders or take-profit orders is more likely. Executing large sizes is challenging. Therefore, even if you have a strong fundamental view to long EUR/USD, the current liquidity environment makes executing and managing that trade significantly more difficult and costly.
Conclusion
The recent seizure in FX liquidity, reportedly surpassing the severity seen during the Covid crisis onset, underscores the market's extreme sensitivity to geopolitical and policy uncertainty. The threat of sweeping tariffs injected a level of unpredictability that forced liquidity providers to retreat, even amidst high trading volumes. While the temporary pause offers breathing room, the fragility remains. For traders, this environment demands heightened caution, smaller position sizes, and wider stop-losses. Critically, basing directional trades like longing EUR/USD solely on the state of market liquidity is misguided. Such decisions must stem from a thorough analysis of economic fundamentals, policy outlooks, and risk sentiment, while acknowledging that poor liquidity significantly raises the cost and risk of executing any strategy.
EURUSD: Rise then dropEURUSD could do a straight away but I'd like to see some sort pullback before heading bearish.
EURUSD LONG 100 PIP MOVE LIVE TRADE AND EDUCATIONAL BREAK DOWNEUR/USD trades decisively higher on the day above 1.1000 on Wednesday as the US Dollar (USD) stays under persistent selling pressure on growing fears over a recession as a result of the US trade war with China. Later in the American session, the Federal Reserve will release the minutes of the March policy meeting.

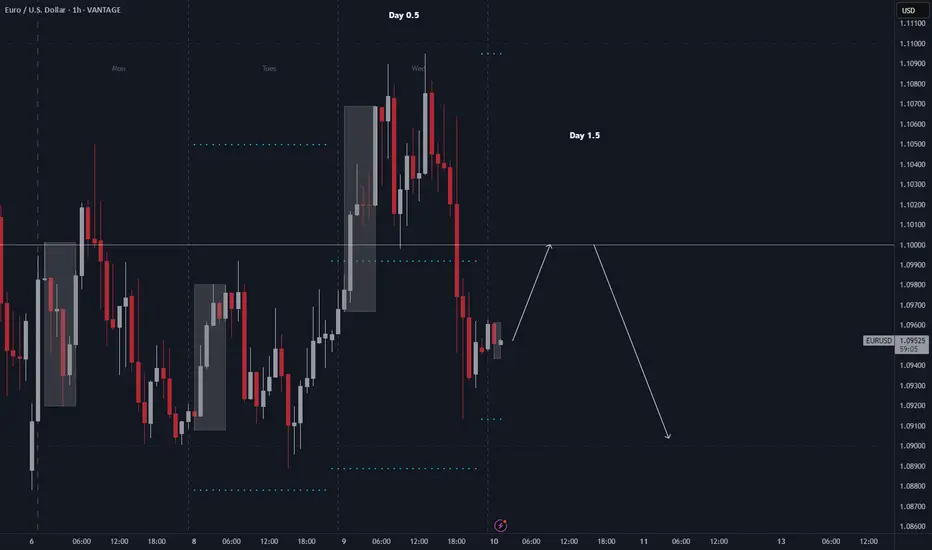
EURUSD SHORT FORECAST Q2 W15 Y25 TUESDAY 8TH APRIL 2025EURUSD SHORT FORECAST Q2 W15 Y25 TUESDAY 8TH APRIL 2025
Welcome back if you're returning, Welcome if you're new here!
Let's take a long into a much unchanged EUERUSD short analysis. The weekly time frame in particular is setting the short scene here. The weekly order block created in September 2024 is providing the valid short point of interest and we have witnessed rejection from that area.
It is also worth mentioning risk management. It does not really feel like a change in dynamic, the majority of us have seen similar price action movements during financial global shifts. My only take away is RISK MANAGEMENT during those/ these periods. One thing I have noticed being a trader is I can always find a position, the question is, BUT... "what position are you going to execute"
This was the difference between FRGNT now and FRGNT then.
Take EURUSD, we have alerts set just below our points of interest. Once that alert sounds, we are aware that our high probability set up is to be looked at closer.
EURUSD short forecast in that case remains 100% unchanged at this time and I shall link the EURUSD short forecast from week 15 beginning.
You may feel that there is no need to read but I hope this reenforces that at times there are trading periods in which there simply is no position to execute. Our job at professional risk managers is to ensure that when our set up does materialise, we are there ready with out account balance intact to bank the full rewards.
FRGNT X
EUR/CHF Bullish Reversal Setup from Key Support Zone – Targeting1. Support Zone (Purple Box at Bottom):
The price has tested this zone multiple times (marked by green arrows), indicating strong demand and a potential double or triple bottom pattern forming.
This support zone ranges roughly between 0.93150 and 0.93350.
2. Projected Bullish Move:
A projected move is drawn from the current price level (around 0.93638) to a target zone near 0.94774, which is marked as the "EA Target Point".
This suggests a potential gain of approximately 1.53% (142.7 pips).
3. Exponential Moving Averages (EMAs):
EMA 30 (red) is currently below the

EURUSD LONGI am looking to buy EURUSD at 1.08300.
I am overall Bullish on the fiber. I am waiting for a deeper retracement.
My target is the previous weekly high.
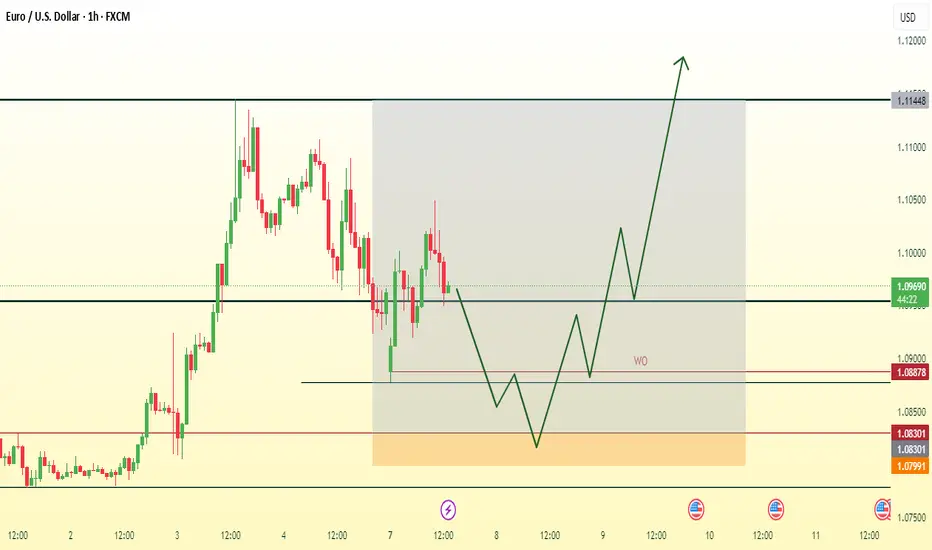
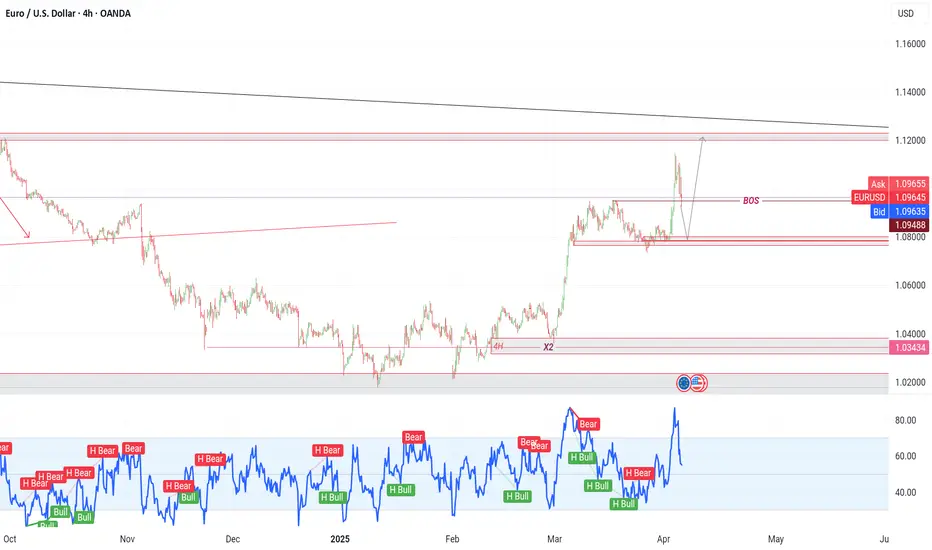
EURUSD on high time frame
"When considering EUR/USD, the price has decisively broken the structure on the daily time frame. Currently, it is undergoing a pullback towards the origin of the move. In my analysis, once this pullback is complete, it presents a favorable buying opportunity. My target for this trade is 1.120.
Depending on your strategy, you may opt to wait for the completion of the pullback and the formation of a (FVG) candle on the 1-hour chart before taking action."
If you need further assistance or have any specific questions, feel free to ask!
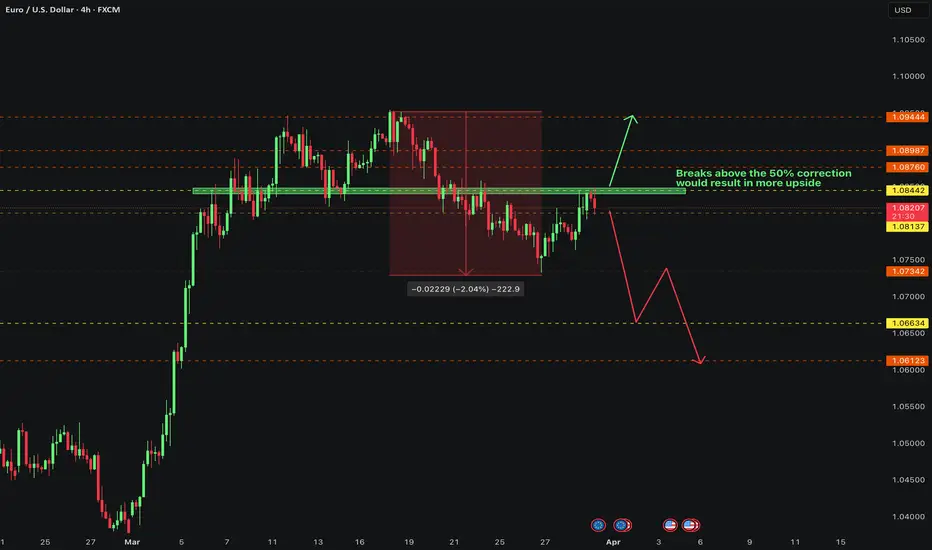
EURUSD - what’s next?Here is our in-depth view and update on EURUSD . Potential opportunities and what to look out for. This is a long-term overview on the pair sharing possible entries and important Key Levels .
Alright first, let’s take a step back and take a look at EURUSD from a bigger perspective.
After making such a huge upside move, we are expecting EURUSD to have some sort of a correction or a pullback to the downside. After that we got a sell off on EURUSD and just today we hit the 50% correction level at around 1.08442 . After failing to break to the upside we can expect more sells to be in play. Any breaks to the downside from the current price will confirm this. Although TVC:DXY is not as strong at the moment, it still is a global reserve currency . We seen that in play last week when we saw massive upside on OANDA:XAUUSD and on TVC:DXY . We must understand that investors are also pouring their money into DXY as it is a global reserve currency. I still personally believe TVC:DXY holds more strength against TVC:EXY hence why I am still looking to short the pair.
Scenario 1: SELLS from current price
With the instant sell, we are risking a possible pullback and continuations to the upside however, DXY is looking like it will reverse. Failing to break to the upside can also be taken as a confirmation for potential sells.
Scenario 2: BUYS at the break of the Key Level (around 1.085)
With the break to the upside, we can expect more buys to come in play possibly targeting previous highs on EURUSD at around 1.09444.
KEY NOTES
- DXY possible reversal to the upside.
- Breaks above the KL and to the upside would confirm higher highs.
- EURUSD has completed the 50% correction to the upside.
- DXY is the global reserve currency.
Happy trading!
FxPocket
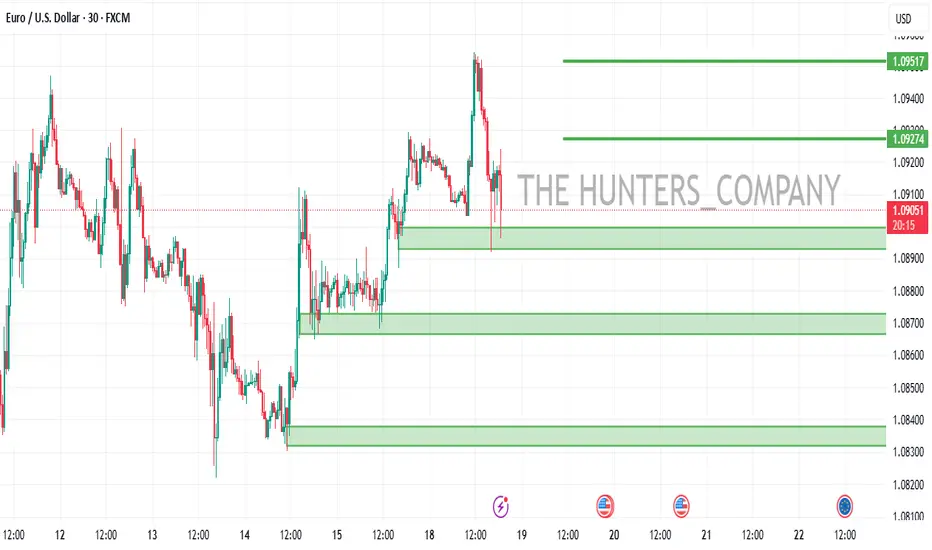
EURUSDHello friends
Given the good price growth, we can now buy in the support areas during the pullbacks that the price makes, of course with capital management...
*Trade safely with us*
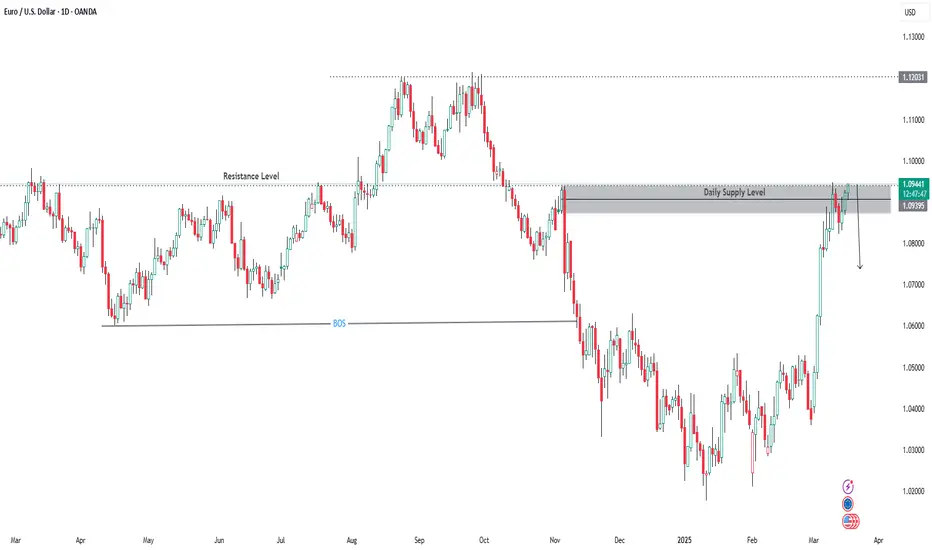
EUR USD Trade Setup Daily Timeframe EUR USD has tapped on a Daily supply level that also acted as a strong resistance level in the past.
So we will be looking for selling opportunities from the lower timeframe.
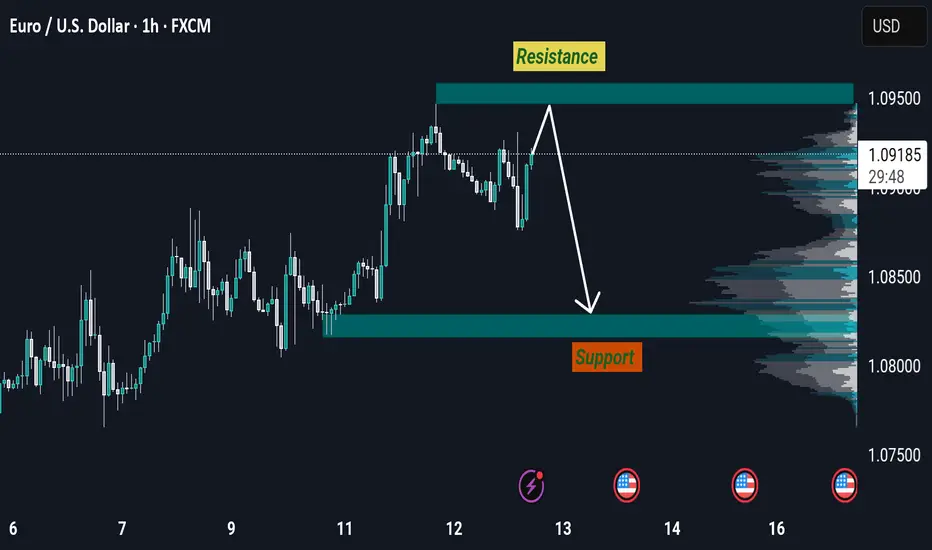
Eurusd outlookThis chart represents a technical analysis of EUR/USD on the 1-hour timeframe, highlighting key support and resistance levels.
Key Analysis:
Resistance Level: Marked around 1.09500, this level serves as a potential selling zone where price may struggle to break higher.
Support Level: Identified near 1.08000, this is a demand area where buying pressure may emerge.
Current Price: EUR/USD is trading at approximately 1.09183, near the resistance zone.
Expected Price Movement: The analysis suggests a potential rejection from resistance, leading to a downward move toward the support zone.
Outlook:
The market structure indicates a possible bearish retracement from resistance. If the price fails to break above 1.09500, a short-selling opportunity may arise with a target around 1.08000. However, if the resistance is broken, further upside momentum could be expected.
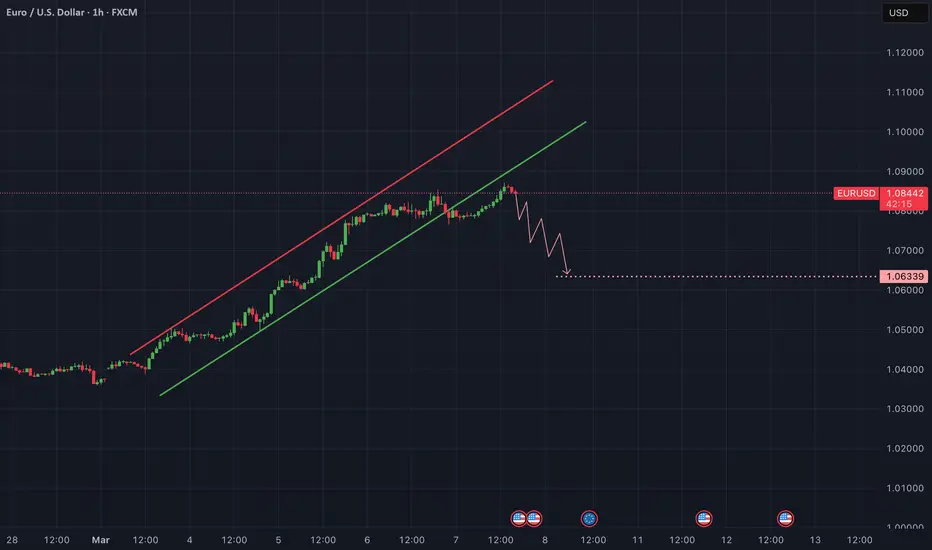
EUR/USD: Breakdown Amidst Euro Surge on German Fiscal StimulusThe EUR/USD currency pair has recently experienced significant movements influenced by both technical patterns and fundamental developments.
Technical Analysis:
The EUR/USD pair has been trading within a well-defined ascending channel, characterized by higher highs and higher lows. However, recent price action indicates a breach below the channel’s lower boundary, suggesting potential bearish momentum. This breakdown could signal a trend reversal or a corrective phase, with the next support level identified around 1.06339. Traders should monitor this level closely, as a sustained move below it may confirm further downside potential.
Fundamental Analysis:
The euro has surged, marking its most substantial weekly gain against the dollar since 2009. This appreciation is largely attributed to Germany’s announcement of a historic fiscal stimulus package aimed at bolstering the Eurozone’s economic recovery. In contrast, the U.S. dollar has weakened due to escalating trade tensions and concerns over the economic implications of aggressive trade policies under President Trump. Investors are increasingly favoring the euro, reflecting optimism about the Eurozone’s growth prospects compared to the uncertain U.S. economic outlook.
EUR/USD on high time frame It's a good opportunity to buy EUR/USD on high time frame , base on my strategy EUR is in bullish trend ,
EUR USD buy position ,
Tp: 1/090
St : 1/030
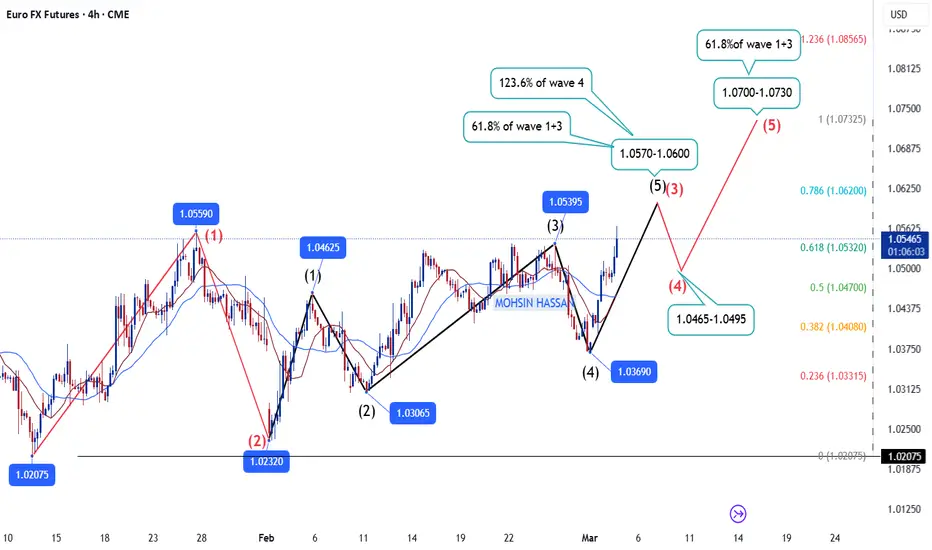
EURUSD BULLISHEURUSD may continue to rise towards 1.0700 to 1.0730 till it is stable above 1.0360.
Buy the dips!!!
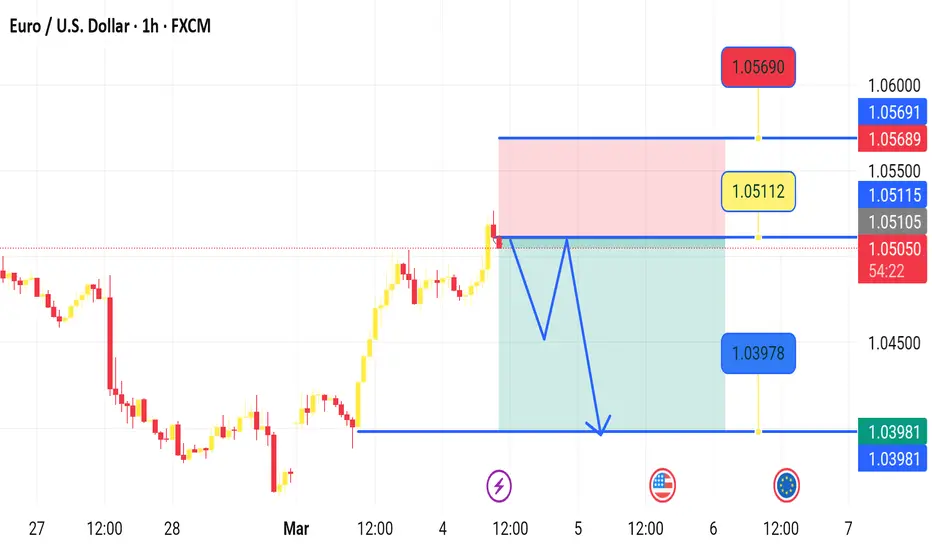
Eurusd sell zoneThis is a EUR/USD (Euro/US Dollar) 1-hour timeframe technical analysis from FXCM, showing a sell trade setup with the following key details:
1. Entry Point: Around 1.05112, marked in yellow.
2. Stop Loss: Placed at 1.05690 (red zone), indicating the level where the trade will be exited if the price moves against the setup.
3. Target Level: 1.03978, shown in blue, representing the expected price drop and profit target.
4. Market Outlook: The analysis suggests a potential bearish move, with price expected to decline from the entry point, retrace slightly, and then drop further to hit the target.
5. Risk-Reward Ratio: The trade setup has a favorable risk-reward structure, with the potential reward being larger than the risk.
This setup is based on the expectation that EUR/USD will reverse from resistance and move downward, making it a short (sell) trade opportunity.
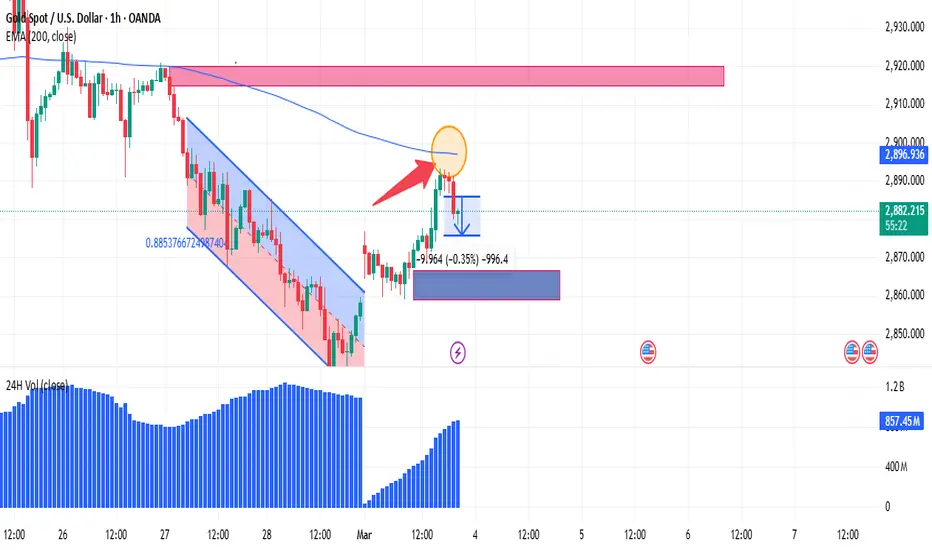
MY analysis on Gold in 1H chart its again downwords gold xauusd is in downword we can take sell positions for some time as it almost touches the EMA200 and again going downwords .
Key Observations:
Downtrend Channel Breakout:
The price was previously in a descending channel (marked in blue).
A breakout to the upside occurred, signaling a potential reversal or retracement.
200 EMA Resistance (Blue Line at ~2897):
The price approached the 200 EMA, which is a strong dynamic resistance.
The rejection at this level (highlighted by the red arrow) suggests selling pressure.
Bearish Rejection (Yellow Circle & Red Arrow):
A wick at the 200 EMA shows that buyers attempted to push higher but faced resistance.
This could be a sign of a potential trend continuation to the downside.
Potential Downside Target (Blue & Red Zones):
A short-term support zone is marked in blue, where price might retest.
A larger support block (red zone) indicates a deeper pullback if bearish momentum continues.
Volume Increasing:
Volume is rising, which could indicate stronger price action, whether continuation or reversal.
Possible Trading Scenarios:
Bearish Case (Most Likely):
If price continues to reject the 200 EMA, it could drop toward the red support zone (~2,860-2,870).
A break below this level could lead to further downside.
Bullish Case (Less Likely):
If price reclaims the 200 EMA and holds above it, it could target the next resistance zone (~2,920).
Conclusion:
Bias: Bearish below 200 EMA unless price breaks above.
Potential Trade: Watch for a retest of the blue zone for a possible short entry targeting the red support block.
Would you like an entry/exit plan based on this setup?
EURUSD LongNice long opportunity with tight stop loss, I have taken a trade yesterday low on long with nice trail stop of 50 pips profit~ didn’t have the time to share the idea~ but looking for another long setup