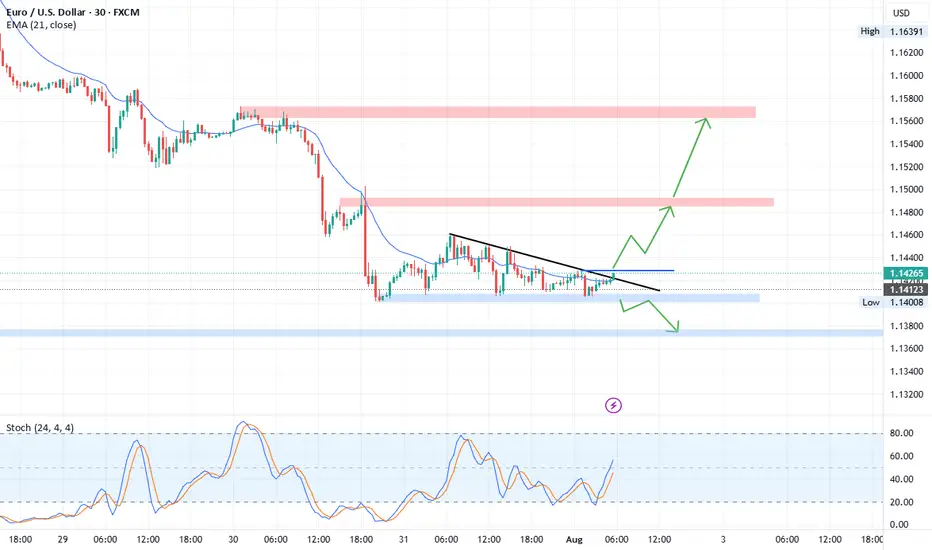
EUR/USD Technical OutlookEUR/USD is currently trading within a Descending Triangle formation. At present, the pair shows a higher probability of an upside breakout from this structure. A confirmed break above the immediate resistance zone at 1.1428 – 1.1430 could accelerate bullish momentum, opening the way toward the next key resistance level at 1.1485.
On the other hand, if the pair fails to sustain above the triangle and breaks to the downside, price may extend losses toward the 1.1375 – 1.1360 support area. From this zone, a potential corrective rebound could occur before the broader bearish trend resumes.
Overall, short-term direction hinges on the breakout of the descending triangle, with 1.1428 – 1.1430 as the critical level to watch for bulls, and 1.1375 – 1.1360 for bears. FOREXCOM:EURUSD
Eurusdlong
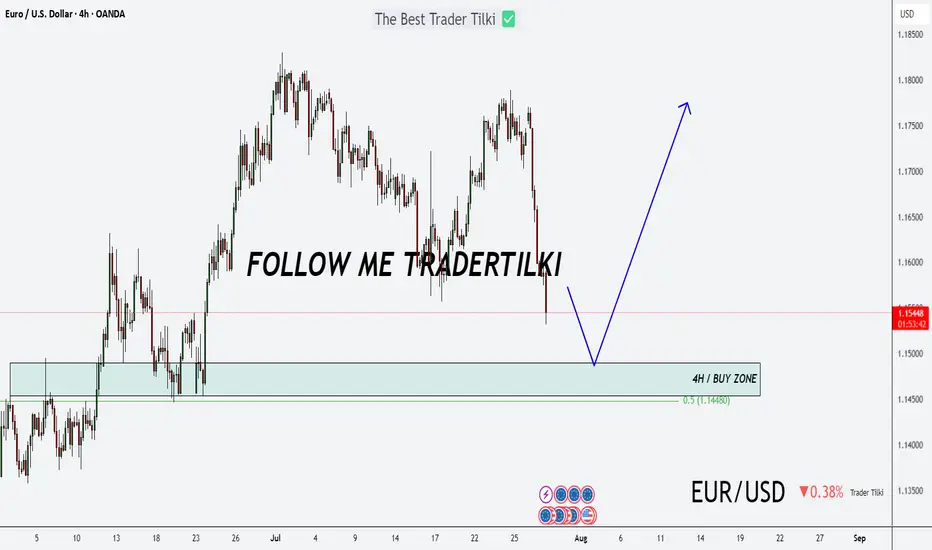
LONG ON EUR/USDEUR/USD is currently at a major demand level after sweeping sell side liquidity.
The Dxy (Dollar) is overall bearish. I expect the dollar to fall and EUR/USD to rise to the previous high / supply level for over 200-300 pips.
News most likely will affect this pair in terms of volatility.

EURUSD – DAILY FORECAST Q3 | W31 | D30 | Y25📊 EURUSD – DAILY FORECAST
Q3 | W31 | D30 | Y25
Daily Forecast 🔍📅
Here’s a short diagnosis of the current chart setup 🧠📈
Higher time frame order blocks have been identified — these are our patient points of interest 🎯🧭.
It’s crucial to wait for a confirmed break of structure 🧱✅ before forming a directional bias.
This keeps us disciplined and aligned with what price action is truly telling us.
📈 Risk Management Protocols
🔑 Core principles:
Max 1% risk per trade
Only execute at pre-identified levels
Use alerts, not emotion
Stick to your RR plan — minimum 1:2
🧠 You’re not paid for how many trades you take, you’re paid for how well you manage risk.
🧠 Weekly FRGNT Insight
"Trade what the market gives, not what your ego wants."
Stay mechanical. Stay focused. Let the probabilities work.
FX:EURUSD
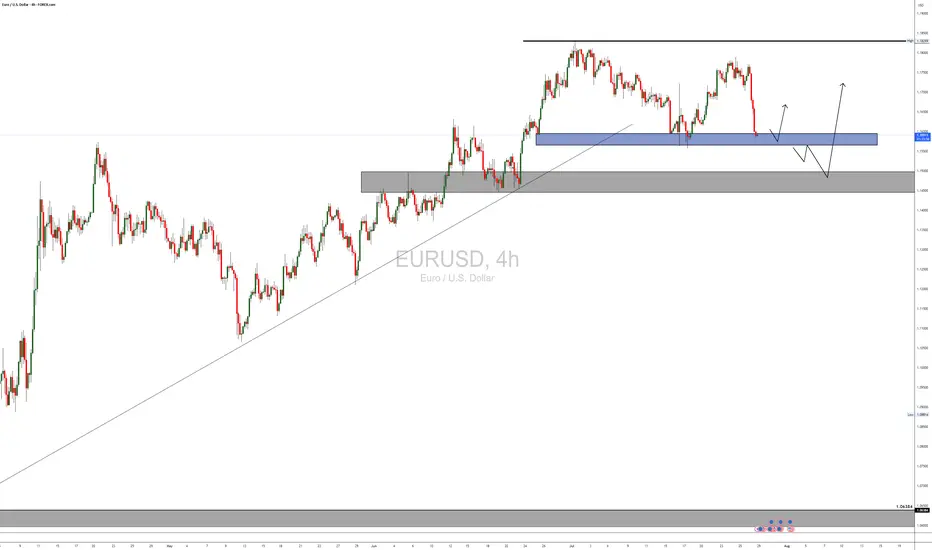
EURUSD analysis - 1H FVG and OB setupsOn the 1H timeframe, price has entered the green demand zone (1H FVG) around 1.1480 – 1.1520 after a strong bearish leg.
We're expecting a bullish retracement from this zone, aiming toward the upper red FVG/OB zone around 1.1690 – 1.1715.
📌 There are two key scenarios:
1️⃣ Scenario 1: Price starts moving up from the green FVG → reaches red FVG zone → short setup after lower timeframe confirmation
2️⃣ Scenario 2: Price makes an initial move to ~1.1620 → pulls back to the green zone → pushes back up into the red OB → short setup on confirmation
🎯 Final target for both scenarios: a break below the green FVG zone and continuation down
✅ Entry only after confirmation from lower timeframes (3M–15M)
❌ No trades without confirmation

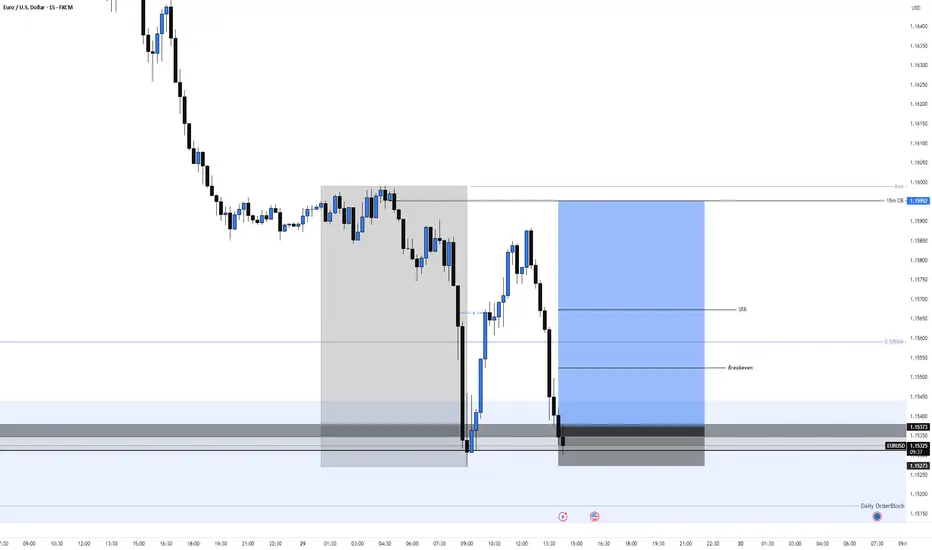
EURUSD Long, 29 JulyReversal Setup from Daily OB + LTF Confluence
Price tapped into a Daily Bullish OB with 50EMA support, signaling potential for a bullish reaction. While structure isn’t perfect, the overextension and DXY correlation offer strong intraday confluence.
📈 HTF Confluence:
✅ Sitting inside a Daily Bullish Orderblock
📍 50EMA in the same area → added support
🟢 Expecting a bounce from this zone, even if HTF trend isn’t clearly bullish yet
📉 LTF Context:
💤 Asia range formed, still unfilled → clean liquidity target
📉 Overextended bearish move into 15m POI
🪞 DXY at its own 15m POI + Asia range to complete → supports EU upside
🎯 Entry Plan:
✅ Clear 1m BOS after reacting from 15m Decisional OB
🎯 Entry taken at 5m OB inside that 15m POI zone
⚠️ Decisional OB isn’t ideal, but stacked confluences justify the risk
🛡 SL: Below 5m OB
📌 TP: Asia high + potential continuation if DXY breaks lower
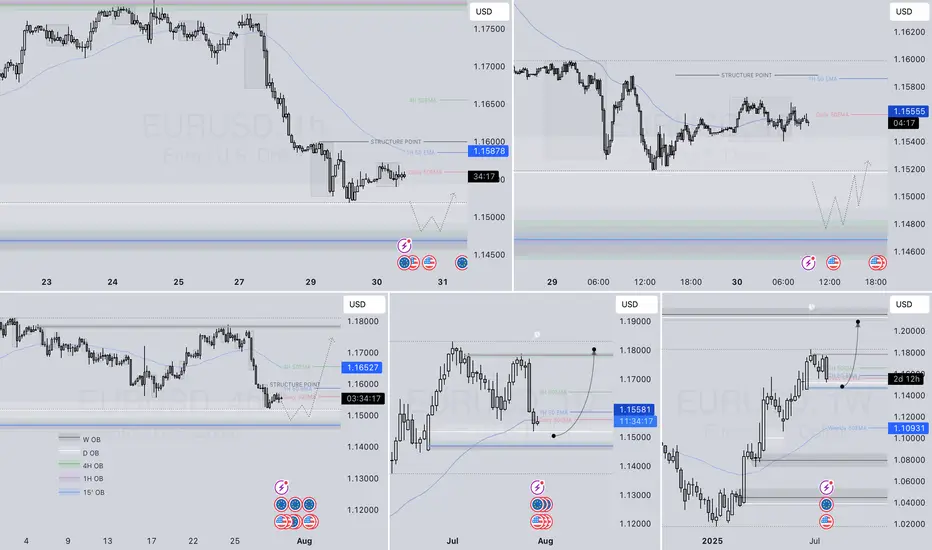
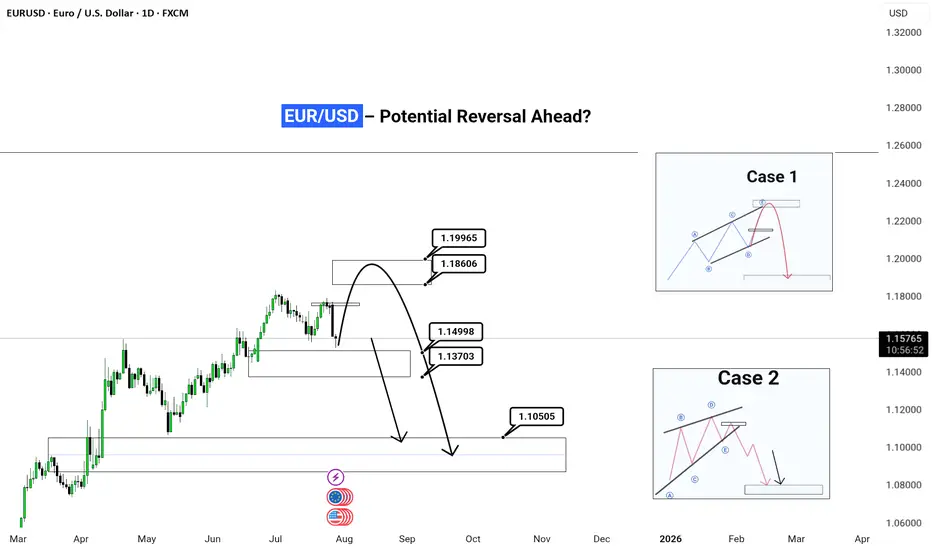
EUR/USD – Potential Reversal Ahead?| Daily Timeframe | Outlook (Published July 29, 2025)
⚠️ Setup Summary:
This chart is highlighting a critical juncture for EUR/USD, where price is nearing a major decision zone. Based on price action and wave structure, there are two likely scenarios unfolding. Let’s break it down simple .
EUR/USD has seen a strong bullish rally from March to July, but current price action suggests momentum exhaustion. Now, we’re watching for signs of a reversal or deeper correction in the coming weeks.
📊 Two Probable Scenarios:
✅ Case 1 – Simple Corrective Wave (ABC Pattern)
Expected Move:
Price may spike up into the 1.186–1.199 zone (final bull trap/liquidity grab)
Followed by a sharp bearish move (impulse C wave) towards 1.10505 zone
This reflects a clean correction before possible reaccumulation
📌 This is often seen after retail traders get caught chasing highs late in a move.
---
✅ Case 2 – Complex Corrective Wave (ABCDE Flat/Running Triangle)
Expected Move:
A longer, more sideways and choppy correction into Q1 2026
Price forms a distribution pattern under resistance
After a breakout below the structure, a sharp drop to 1.10505 zone (or deeper)
📌 This is a slower bleed-out pattern before continuation lower. Often traps both buyers and sellers in the chop.
---
🎯 Current Price: 1.15756
We are in a decision zone, and watching the reaction around 1.165–1.186 will be crucial to validate either Case 1 or Case 2.
---
💡 My View:
> Wait for confirmation at the 1.186 zone.
If price rejects strongly from there, Case 1 is in play. 👈❤️
If price chops sideways and holds higher for weeks, expect Case 2 structure.
---
🚨 Reminder for Traders:
Don’t chase moves — let the market show its hand
Use proper risk management
Combine this structure with session timing, liquidity sweeps, and fundamental events
---
💬 Drop a comment if you're seeing similar setups in other majors!
🧠 Follow for real-time updates & actionable setups.
#EURUSD #ForexAnalysis #WaveTheory #SmartMoney #OrderBlock #LiquidityHunt #ForexStrategy #ElliottWave #PriceAction #FXTrader #TradingView
---
EURUSD – DAILY FORECAST Q3 | W31 | D29 | Y25📊 EURUSD – DAILY FORECAST
Q3 | W31 | D29 | Y25
Daily Forecast 🔍📅
Here’s a short diagnosis of the current chart setup 🧠📈
Higher time frame order blocks have been identified — these are our patient points of interest 🎯🧭.
It’s crucial to wait for a confirmed break of structure 🧱✅ before forming a directional bias.
This keeps us disciplined and aligned with what price action is truly telling us.
📈 Risk Management Protocols
🔑 Core principles:
Max 1% risk per trade
Only execute at pre-identified levels
Use alerts, not emotion
Stick to your RR plan — minimum 1:2
🧠 You’re not paid for how many trades you take, you’re paid for how well you manage risk.
🧠 Weekly FRGNT Insight
"Trade what the market gives, not what your ego wants."
Stay mechanical. Stay focused. Let the probabilities work.
FX:EURUSD

Major U.S. News Ahead—Will EURUSD Pivot?Good morning, my friends 👋
Here’s my EURUSD market analysis 📉
Currently, the pair is in a downtrend. I expect this downward move to end around 1.14899 or 1.14536, where a potential buying opportunity may emerge. I personally plan to enter a buy position once price reaches those zones 💼
Also, keep an eye on major U.S. economic reports being released today—they could trigger increased volatility 🔔
Every like you send is a huge source of motivation for me to keep sharing high-quality analysis 🙏 Thanks to everyone supporting the channel 💙
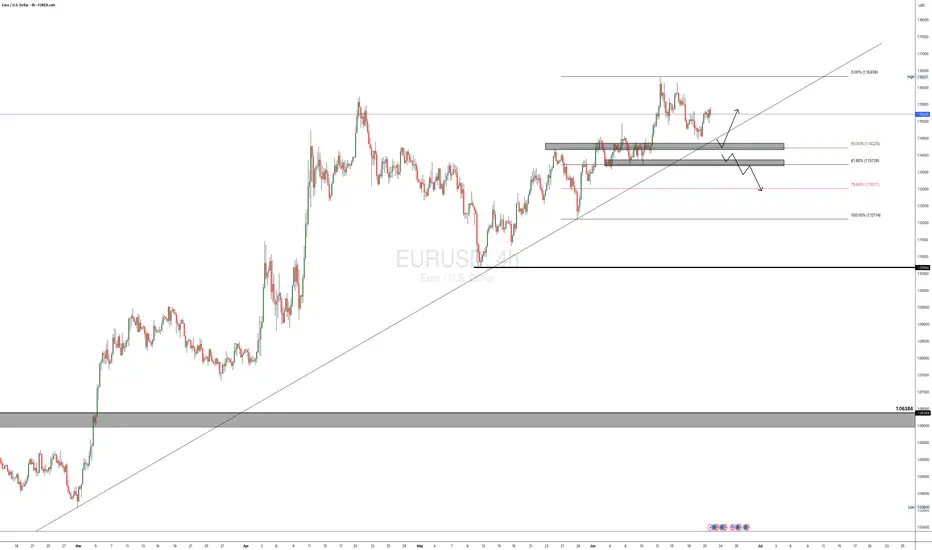
EURUSD POSSIBLE TRADE SETUP💶 Potential Trade Setup on EURUSD
Overview:
Since March, EURUSD has shown consistent bullish momentum, especially after breaking through the key 1.0600 supply zone.
The pair has maintained higher highs and higher lows, suggesting continued strength in the medium term.
That said, I am still quite anticipating for a possible continuation of the bullish momentum that started a long time ago, and moving forward, I will anticipate for a clear retest of the 50% fib at the 1.1425 region, then I go in for the kill.
Alternatively, there is a clear short opportunity, provided that, the bullish trendline is broken and the 1.1370 region is broken to the downside, this is a bit far a stretch, but it is in play. "IF" the DXY keeps the bullish momentum going.
🧭 Trading Plan:
✅ BUY Bias (Primary Plan):
Look for a retest of the 50% Fibonacci retracement zone around 1.1425. This aligns with the ongoing momentum on the 4H timeframe.
🔻 SELL Bias (Alternative Scenario):
If price breaks the bullish trendline and the 1.1370 support zone, a short opportunity opens up.
This is only valid if DXY continues to strengthen, shifting sentiment.
🎯 Targets & Risk Management: Targeting 1:2 R:R on both setups.
Ensure entries are backed by price action signals and confluences.
Analysis on the DXY – EURUSD RelationshipHello traders,
Here’s an analysis that can be useful for both short-term and swing trades on EURUSD and DXY. Our trading team’s calculations are as follows:
Analysis on the DXY – EURUSD Relationship
Currently, DXY is at 98.200. Historical statistical data indicate that if DXY declines toward 96.300, there is approximately a **1.55% probability of an upward move** in EURUSD.
Based on this scenario:
Current EURUSD level: 1.16500
Projected target level:1.1830
While the correlation data show a strong inverse relationship, it’s important to note that periodic deviations can occur in the market. Therefore, this analysis should be considered a statistical projection only, not a guaranteed outcome.

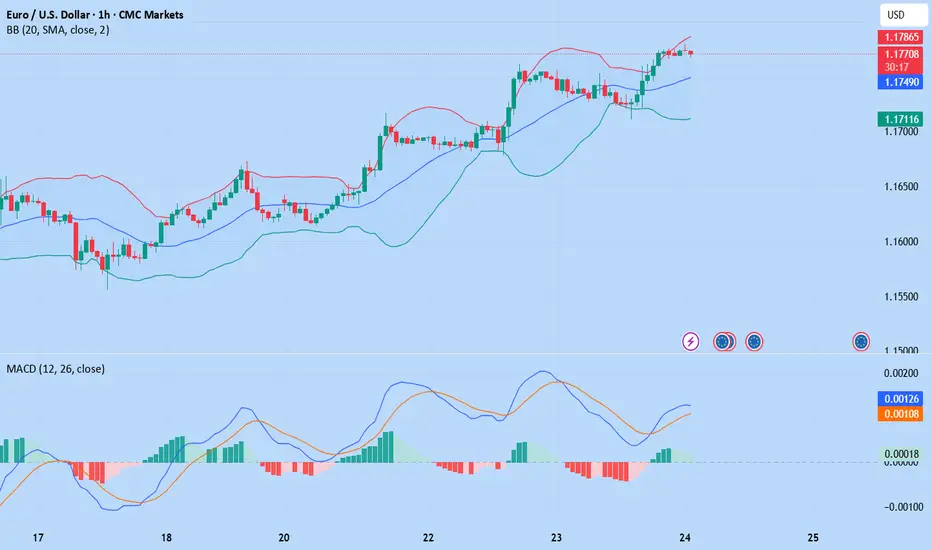
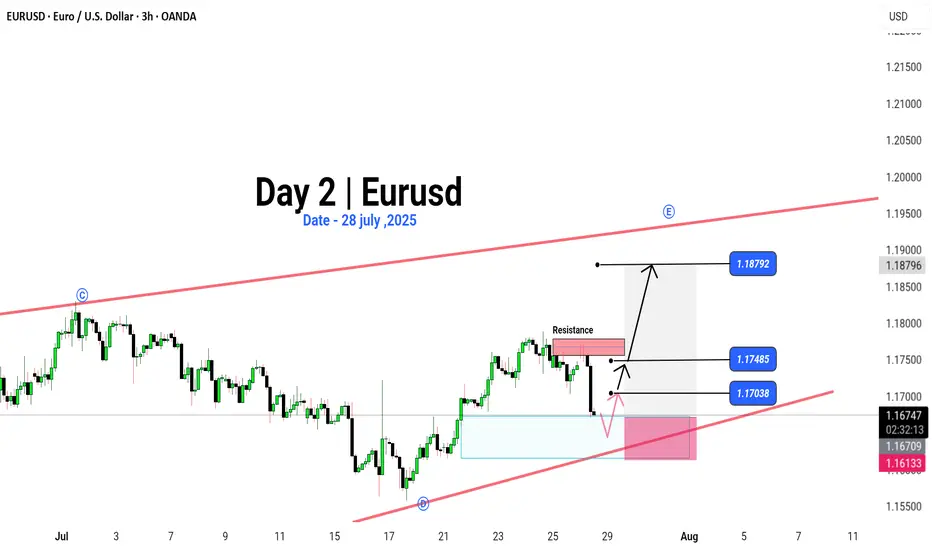
EUR/USD | Moving bullish Why Is EUR/USD Always Moving?
Ever asked yourself, "Why does the Euro rise or fall against the Dollar?" 💡
It’s not magic – it’s all about money flow, news, and market mood.
📉 When traders feel unsure, they might sell the Euro.
📈 When Europe’s economy looks strong, the Euro can fly!
Right now, we’re watching some key price zones 👀:
Breakout above 1.17485 could push us to 1.18792 🚀
Drop below 1.17038 might take us lower 📉
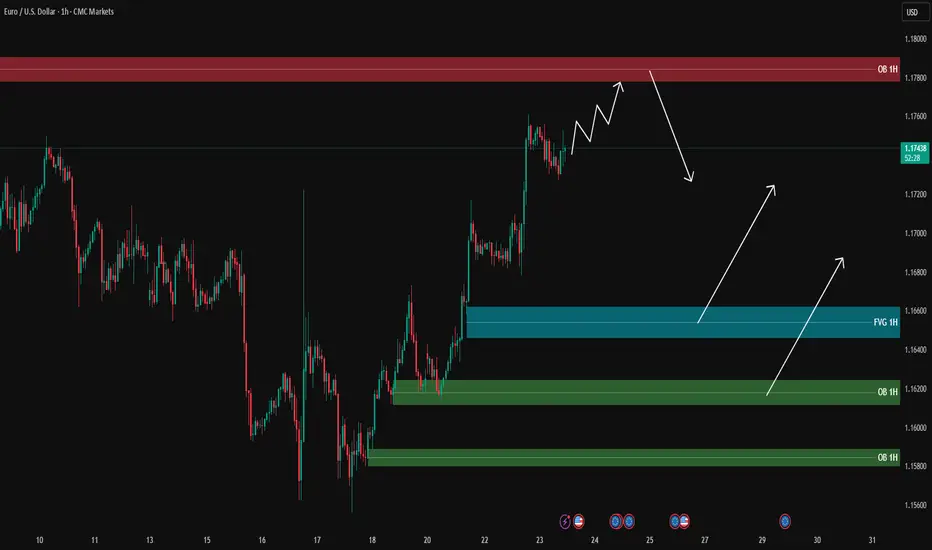
EURUSD analysis - 1H FVG and OB setupsOn the 1H timeframe, price is moving strongly towards the 1H supply zone (around 1.1780), and it is likely to reach this area first before pulling back.
During the pullback, the blue FVG and green OB zones below are key areas for potential long entries:
🔹 FVG 1H around 1.1660
🔹 OB 1H around 1.1620
🔹 OB 1H around 1.1580
📌 Plan:
1️⃣ If the price reaches the upper supply zone, we will look for short scalps with confirmation on the lower timeframe (5M/3M).
2️⃣ After the pullback to lower zones, we will look for long opportunities with PA confirmation.
🎯 Long targets after pullback: 1.1700 – 1.1720, potentially 1.1750.
❌ No entry without confirmation.
EURUSD(20250728) Today's AnalysisMarket news:
Trump announced that the US and Europe reached a trade agreement: 15% tariffs on the EU, $600 billion in investment in the US, zero tariffs on the US by EU countries, the EU will purchase US military equipment, and will purchase US energy products worth $750 billion. However, the US and Europe have different opinions on whether the 15% tariff agreement covers medicines and steel and aluminum. Von der Leyen: 15% tariff rate is the best result that the European Commission can achieve.
US Secretary of Commerce: The deadline for tariff increase on August 1 will not be extended. The United States will determine the tariff policy on chips within two weeks.
Technical analysis:
Today's buying and selling boundaries:
1.1735
Support and resistance levels:
1.1792
1.1771
1.1757
1.1712
1.1698
1.1677
Trading strategy:
If the price breaks through 1.1757, consider buying, the first target price is 1.1771
If the price breaks through 1.1735, consider selling, the first target price is 1.1712
EURUSD: Buyers Like the New Trade Deals With The US!Welcome back to the Weekly Forex Forecast for the week of July 28 - Aug 1st.
In this video, we will analyze the following FX market:
EURUSD
Buyers reacting positively to the announcements of trade deals with the US.
Longs are the play until we see a bearish break of significant structure.
FOMC and NFP looming, so be careful the markets don't reverse on your trades!
Wait patiently for buy setups.
Enjoy!
May profits be upon you.
Leave any questions or comments in the comment section.
I appreciate any feedback from my viewers!
Like and/or subscribe if you want more accurate analysis.
Thank you so much!
Disclaimer:
I do not provide personal investment advice and I am not a qualified licensed investment advisor.
All information found here, including any ideas, opinions, views, predictions, forecasts, commentaries, suggestions, expressed or implied herein, are for informational, entertainment or educational purposes only and should not be construed as personal investment advice. While the information provided is believed to be accurate, it may include errors or inaccuracies.
I will not and cannot be held liable for any actions you take as a result of anything you read here.
Conduct your own due diligence, or consult a licensed financial advisor or broker before making any and all investment decisions. Any investments, trades, speculations, or decisions made on the basis of any information found on this channel, expressed or implied herein, are committed at your own risk, financial or otherwise.

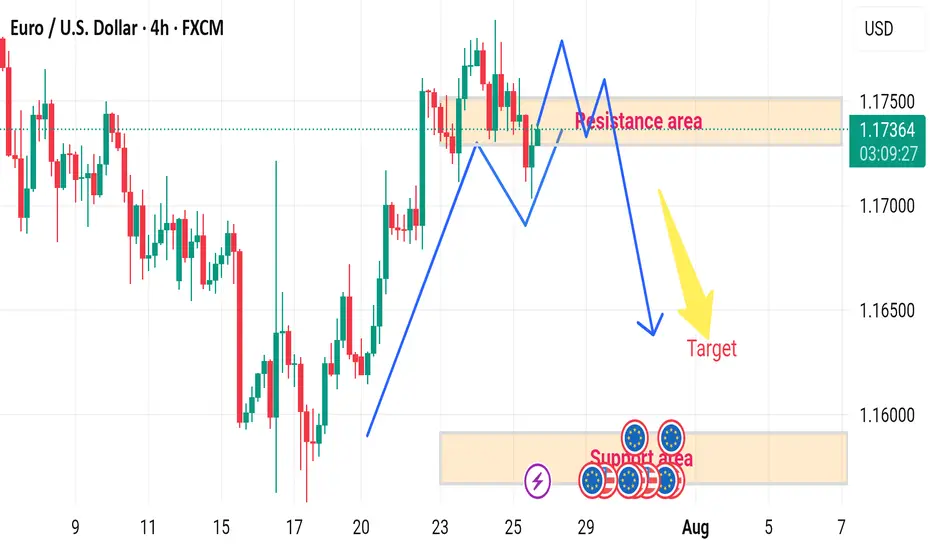
EUR/USD H4 DOWNWARD 🔄 Disrupted EUR/USD 4H Analysis
🟢 Current Context:
Price is currently at 1.17375, slightly below the resistance area (1.17400–1.17500).
Market shows a recent bullish impulse, followed by consolidation within the marked resistance zone.
Projection in the image suggests a double-top pattern forming at resistance, followed by a bearish reversal toward the target demand area (~1.15800–1.16000).
---
⚠️ Disruption Points:
1️⃣ Failed Double Top Scenario
Disruption Hypothesis: Instead of forming a clean double top and reversing, price may break above the resistance zone at 1.17500.
Reasoning: Strong bullish momentum and recent higher highs indicate potential for bullish continuation, invalidating the bearish target.
Disrupted Path: Price could break out → retest the resistance as new support → continue toward 1.18000–1.18300 zone.
2️⃣ Mid-Range Liquidity Trap
The current range may act as a liquidity trap:
Smart money could push the price slightly below support (fake breakdown), attract sellers, then reverse sharply upwards.
This would trap retail sellers targeting the 1.15800 zone.
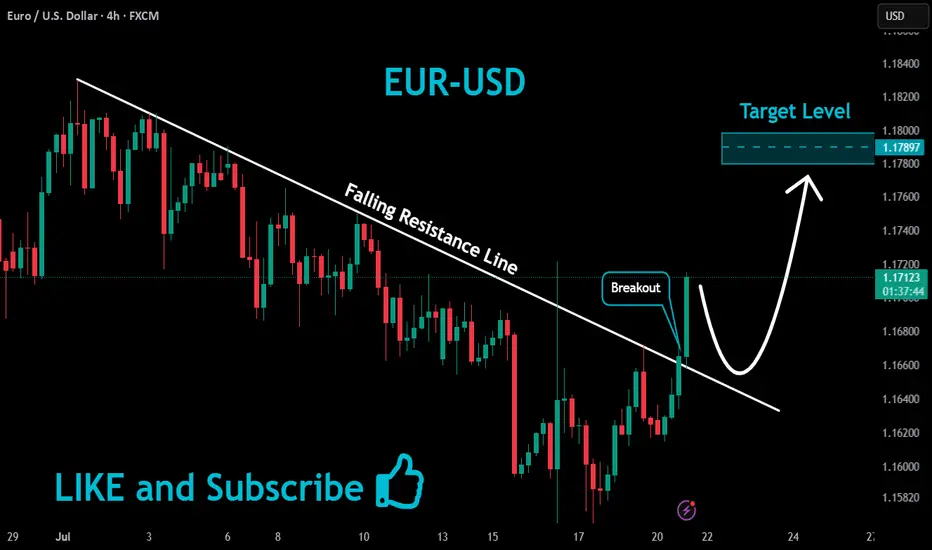
EURUSD Massive Bullish Breakout!
HI,Traders !
#EURUSD is trading in a strong
Uptrend and the price just
Made a massive bullish
Breakout of the falling
Resistance line and the
Breakout is confirmed
So after a potential pullback
We will be expecting a
Further bullish continuation !
Comment and subscribe to help us grow !
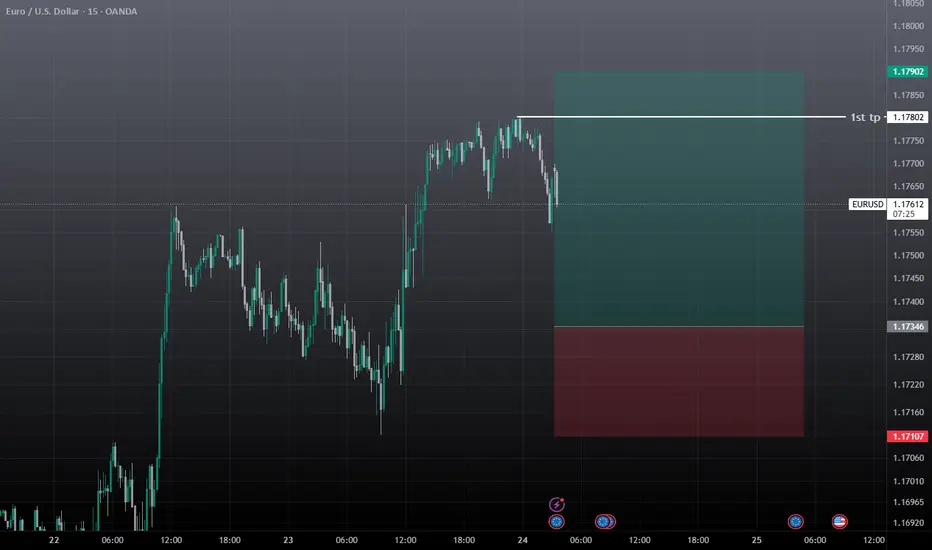
EURUSD Scalp trade setupWait for the entry, if tp achieves first then cancel the trade. Today also the news day manipulation will be on peak. So take minimum risk and must use SL.
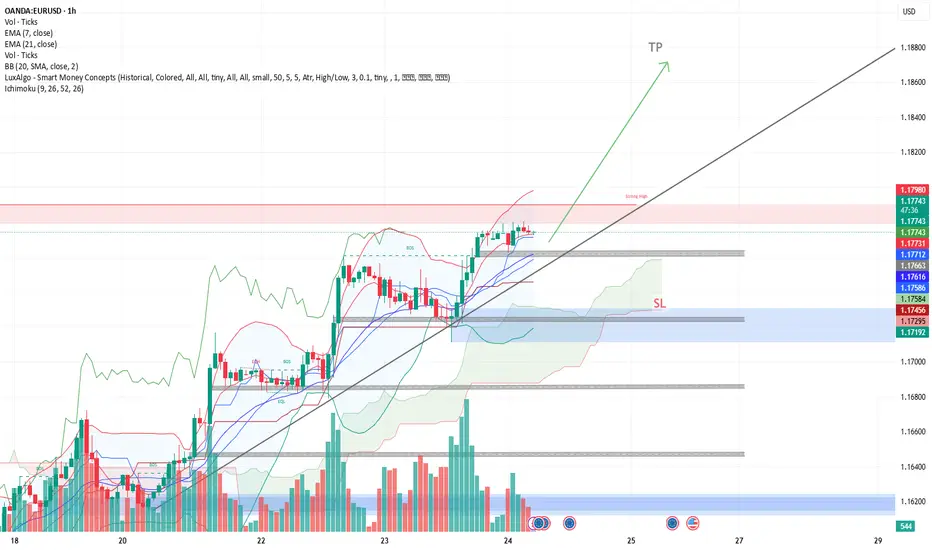
EUR/USD – Buy Setup Analysis (1H Chart)EUR/USD – Buy Setup Analysis (1H Chart)
📈 **Trend**: Uptrend
The pair is respecting the ascending trendline and is trading above both the EMA 7 and EMA 21, indicating bullish momentum.
**🔹 Long Setup**
* **Entry:** Around 1.1774 (current price)
* **Stop-Loss (SL):** 1.1731 (below trendline & EMAs)
* **Take-Profit (TP):** 1.1872 (based on recent swing high)
**🔎 Technical Signals**
* Price is forming higher highs and higher lows.
* Strong volume surge on bullish candles.
* EMA crossover (7 > 21) supports continuation.
**Conclusion**
As long as EUR/USD holds above the trendline and the EMAs, the bullish setup remains valid. A break below 1.1730 would invalidate this outlook.
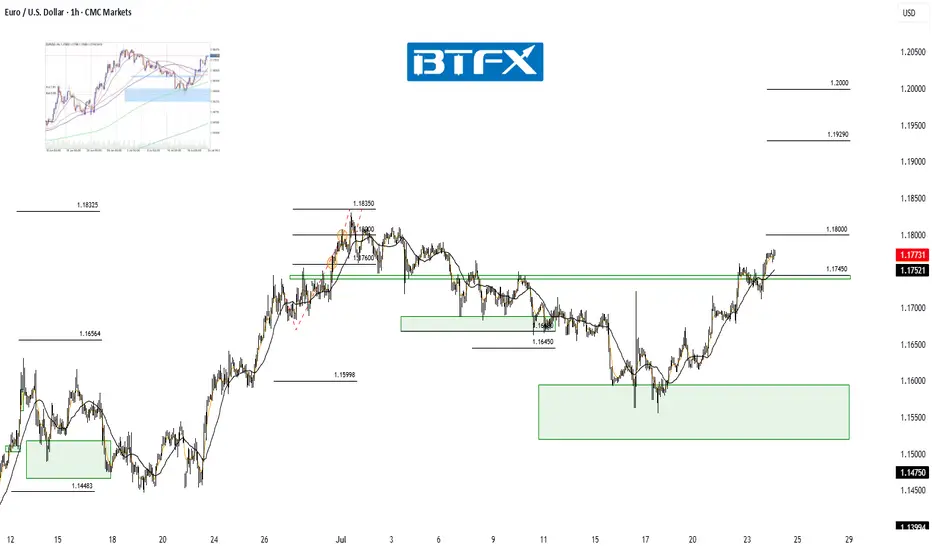
EUR/USD Recovery in Play — Eyes on ResistanceHi Everyone,
Since our last update, EUR/USD briefly dipped below the 1.16000 level but quickly reclaimed the key 1.16450 zone — a level that continues to serve as an important structural pivot.
Price has since stabilised above this support and is now moving back toward the highlighted resistance area around 1.17450. A sustained push toward 1.18000 in the coming sessions would further reinforce the presence of renewed buying interest.
Our broader outlook remains unchanged: we continue to anticipate the pair building momentum for another move higher. A decisive break above 1.18350 could open the path toward the 1.19290 area and ultimately the 1.20000 handle.
We’ll be watching closely to see whether this recovery gains traction and if buyers can sustain momentum through resistance. The longer-term view remains bullish, as long as price continues to hold above the key support zone.
We’ll continue to provide updates throughout the week as the structure develops and share how we’re managing our active positions.
Thanks again for all the likes, boosts, comments, and follows — we really appreciate the support!
All the best for the rest of the week.
Trade safe.
BluetonaFX
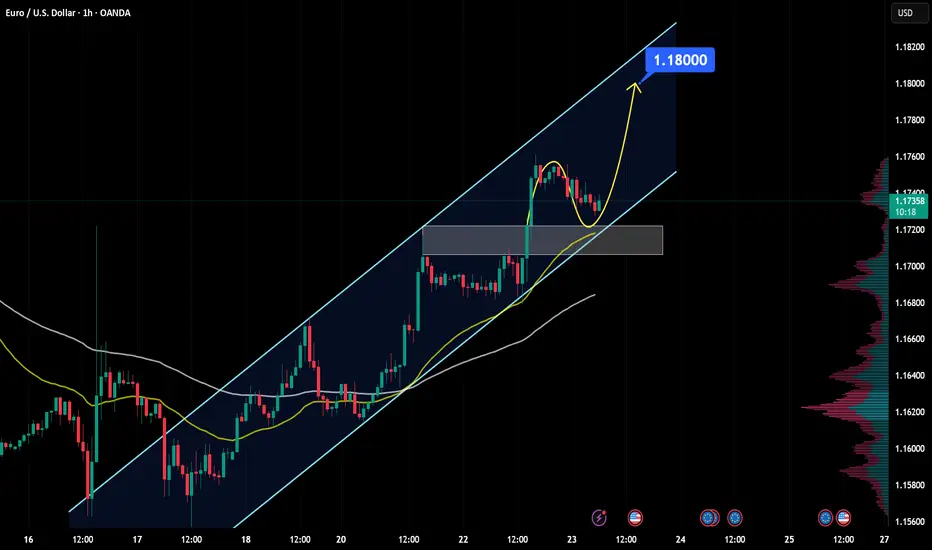
EURUSD Analysis - Can Buyers Push Price To $1.18000?Hello all dear traders!
EURUSD is trading within a clear bullish channel, with price action consistently respecting both the upper and lower boundaries. The recent bullish momentum shows that buyers are in control, suggesting further upside.
The price recently broke above a key resistance zone and is now coming back to retest it. If this level holds as support, it will consolidate the bullish structure and increase the likelihood of a move towards the 1.18000 target, which is in line with the upper boundary of the channel.
As long as the price remains above this support zone, the bullish outlook remains intact. However, a failure to hold this level could invalidate the bullish scenario and increase the likelihood of a deeper pullback.
Remember, always validate your setups and use appropriate risk management.
EURUSD(20250724) Today's AnalysisMarket news:
U.S. President Trump continued to lash out at the Federal Reserve on Tuesday, but seemed to back off from the remaining plan to fire Chairman Powell. "I think he's doing a bad job, but he's going to be out of office soon anyway," Trump said in an exchange with reporters at the White House. "In eight months, he'll be out of office."
Technical analysis:
Today's buying and selling boundaries:
1.1751
Support and resistance levels:
1.1814
1.1791
1.1775
1.1726
1.1711
1.1687
Trading strategy:
If the price breaks through 1.1775, consider buying in, with the first target price at 1.1791
If the price breaks through 1.1751, consider selling in, with the first target price at 1.1726