EURUSD Breakout ?Hi Traders, coming up EURUSD German Prelim CPI may make this pair volatile. As with the increased volatility we could see EURUSD moving back to the upside. Expecting EURUSD to give us significant opportunity with market opens.4H has formed a doji that may give high probability trade setup
Eurusdlong

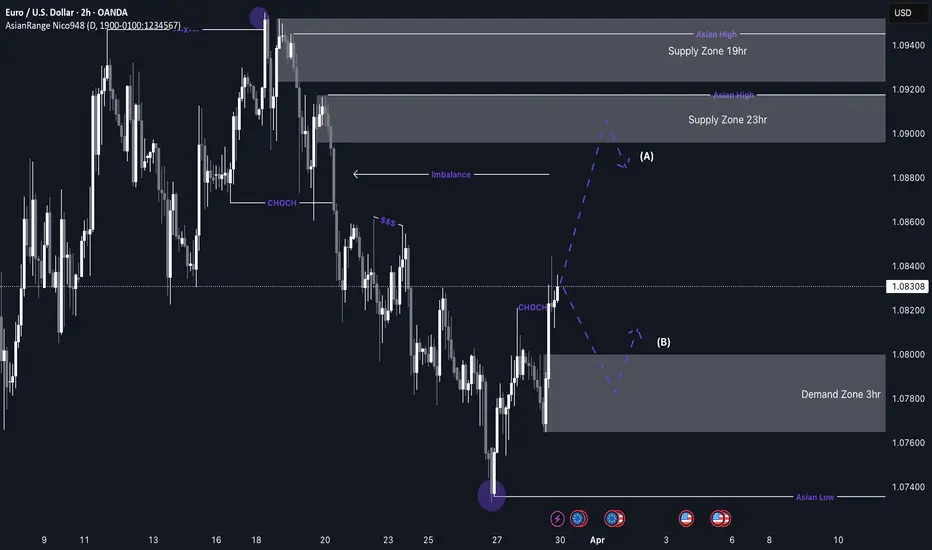
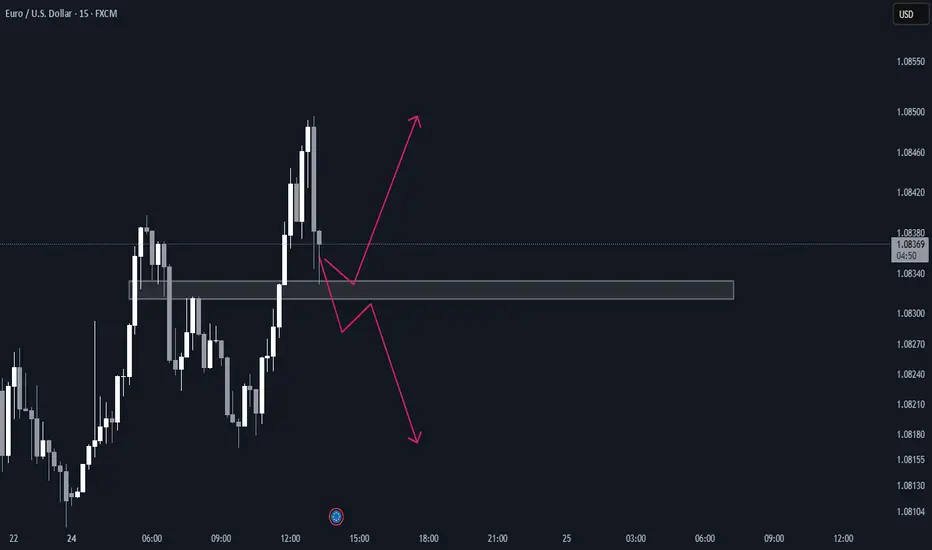
EUR/USD Long setup from the 3hr demand zoneSimilar to GBP/USD, I’m looking for long opportunities on EU. My key area of interest is the 3-hour demand zone, where I will wait for price to mitigate and accumulate before entering a position.
Price has also changed character to the upside, further validating this demand zone as a strong point of interest. Additionally, there is a significant amount of liquidity to the upside that needs to be taken.
The next major supply zone I have marked out is the 23-hour supply zone, which is further away. For now, my focus remains on the demand zone—unless price breaks below, creating a new supply level.
Confluences for EU Buys:
- Bullish market structure shift, with a clean demand zone left behind.
- Unmitigated 3-hour demand zone, making it a strong area of interest.
- Liquidity resting above, which price is likely to target.
- DXY has been bearish, aligning with a bullish outlook for EU.
Note: If price breaks structure to the upside without tapping my nearby demand zone, I will either wait for a new demand zone to form or look for a sell-to-buy opportunity from supply.
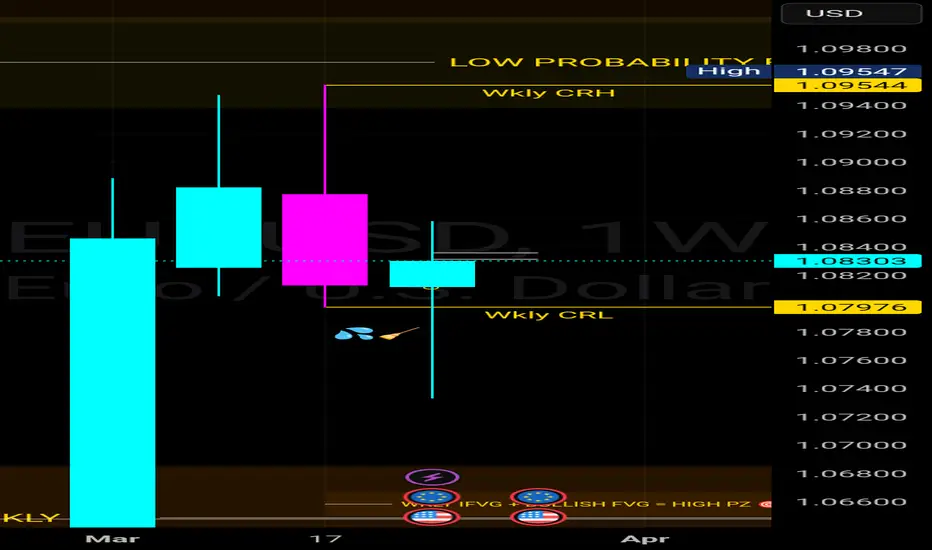
EURUSD Weekly Candle RangeTrading is hard but it's simple.
On the 1W, EURUSD traded into a key zone and ended with a long wick, indicating a strong rejection. I'm looking to find entries in the wick area and targeting CRH for the rest of the week. Do have a lovely weekend. For me, I'd be looking at ETHUSDT 😅
eurusd sell entry so riskyOANDA:EURUSD 4 hr sell entry
retest the 1 day support
risky entry sl hit and tp hit so risk entry
XAUUSD, EURUSD and GBPUSD Analysis todayHello traders, this is a complete multiple timeframe analysis of this pair. We see could find significant trading opportunities as per analysis upon price action confirmation we may take this trade. Smash the like button if you find value in this analysis and drop a comment if you have any questions or let me know which pair to cover in my next analysis.

EUR/USD: Uncertain Trajectory Amid Tariff - Induced JittersThe EUR/USD is trading at 1.0796. After a Thursday rebound from 1.0733 due to a weakening USD, it's now pressured at the intraday high of 1.0799.
US President Donald Trump's new 25% import taxes on cars and car parts, with potential additional levies on the eurozone and Canada, have stoked risk - off sentiment. This has led to a temporary dip in the US dollar's appeal.
On the daily chart, it's found buyers near the non - directional 200 - day SMA, with 1.0730 as dynamic support. It's attempting to break the bullish 20 - day SMA, while the 100 - day SMA is non - directional below the current level. The momentum indicator is flat below 100, and the RSI at 56 hints at upward risk, yet unconfirmed. Bulls should be cautious short - term.
In the 4 - hour chart, technicals are rising but below the mid - line. EUR/USD is fighting a bearish 20 - day SMA, and the 100 - day SMA has lost upward steam around 1.0840. A break above 1.0840 could bring back the bulls.
EURUSD
buy@1.08200-1.08500
tp:1.08900-1.09300
I will share trading signals every day. All the signals have been accurate for a whole month in a row. If you also need them, please click on the link below the article to obtain them.

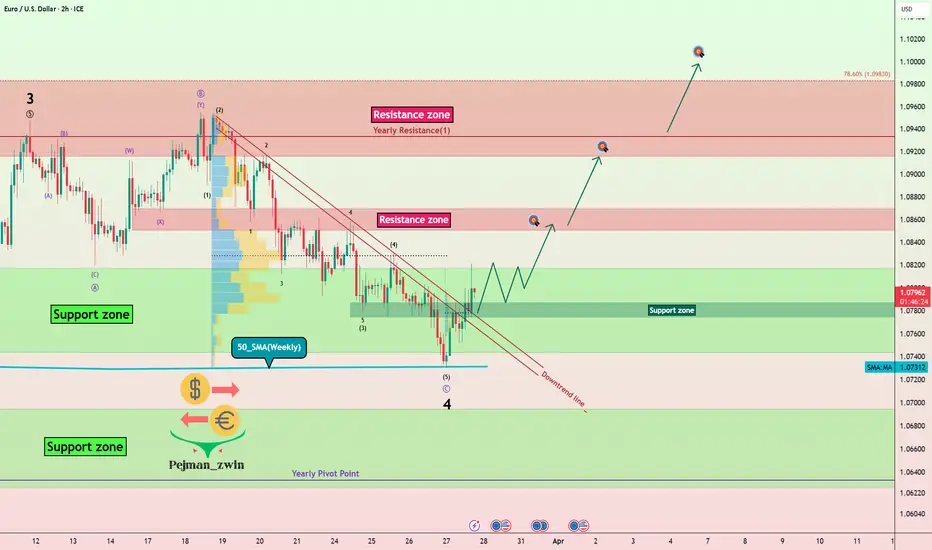
Strong GDP, Weak USD – How Will EURUSD React!?Today's U.S. data showed strong GDP growth (2.4%) , but lower inflation ( 2.3% Final GDP Price Index ) and a weaker trade balance ( -147.9B ) suggest the Fed may remain cautious on rate hikes. This limits USD's strength , supporting a potential EURUSD rebound .
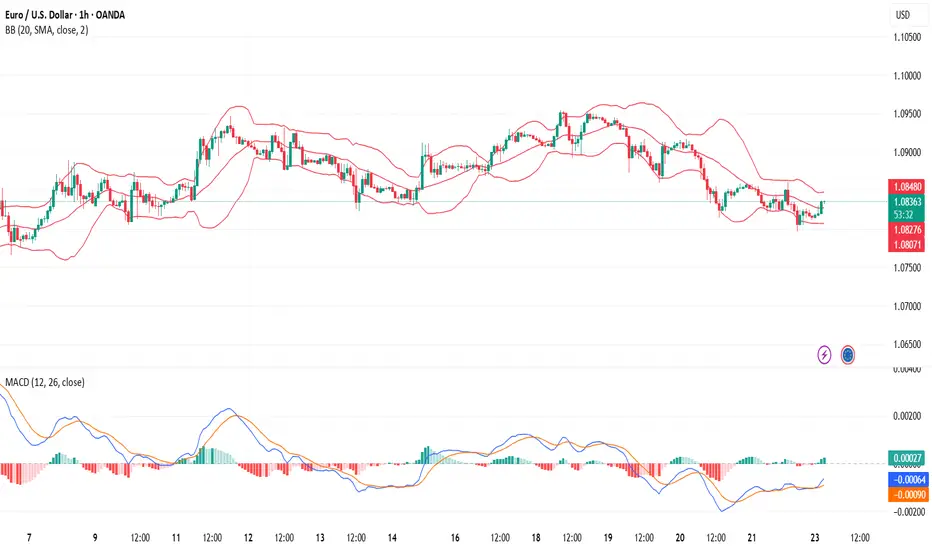
EURUSD ( FX:EURUSD ) is moving in the Support zone($1.08180-$1.0745) and has also managed to break the Downtrend line . 50_SMA(Weekly) plays a good role of support for EURUSD .
In terms of Classic Technical Analysis and Price Action , there is also a possibility that EURUSD will return to an uptrend with Inverse Head and Shoulders and Bullish Quasimodo Patterns .
Regarding Elliott Wave theory , it seems that EURUSD has managed to complete the main wave 4 . The main wave 4 structure is an Expanding Flat Correction(ABC/3-3-5) .
I expect EURUSD to trend higher in the coming hour s and rise to at least $1.0855 , and if the Resistance zone($1.0867-$1.0850) is broken, we should expect more pumping .
Note: If EURUSD breaks below the 50_SMA(Weekly), we expect further declines. The worst Stop Loss(SL) could be $1.072.
Please respect each other's ideas and express them politely if you agree or disagree .
Euro/U.S. Dollar Analyze (EURUSD), 2-hour time frame.
Be sure to follow the updated ideas.
Do not forget to put a Stop loss for your positions (For every position you want to open).
Please follow your strategy and updates; this is just my Idea, and I will gladly see your ideas in this post.
Please do not forget the ✅' like '✅ button 🙏😊 & Share it with your friends; thanks, and Trade safe.
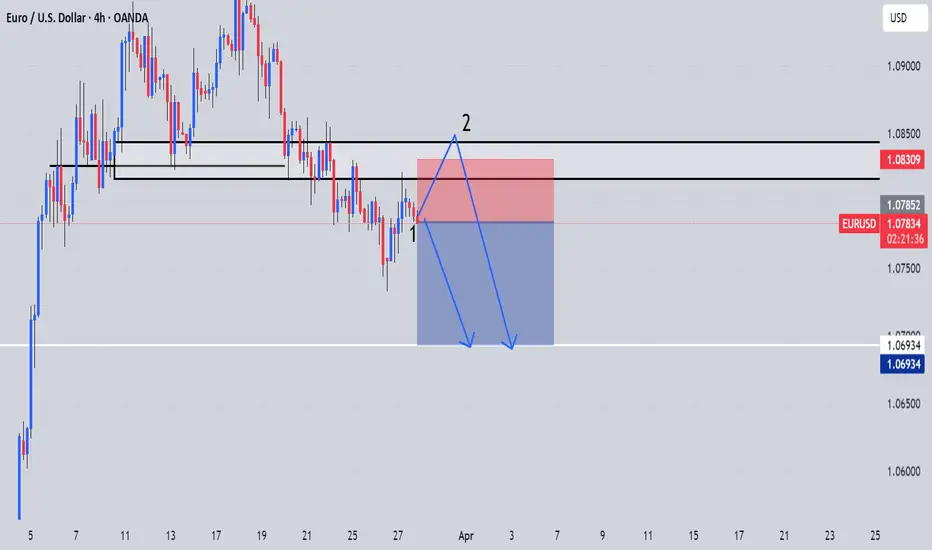
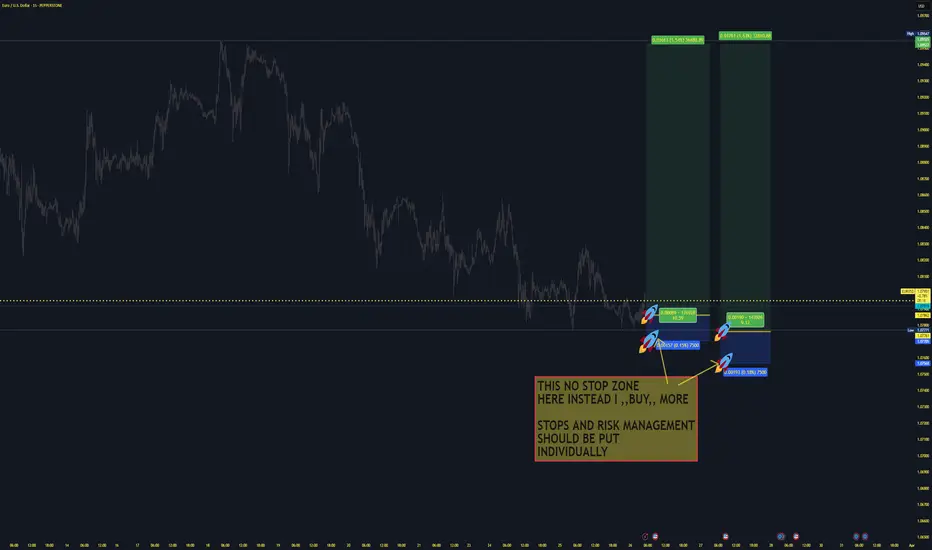
EURUSD LongEuro strong:Strong PMI
Dollar weak: Despite of weaker budegt deficit and weak US Economy
2 Approaches with 4 different entries(ROCKETS UP!)
1 Profit target
EURUSD - Potential Reversal Zones and ScenariosThis 4-hour chart of EURUSD highlights potential Fair Value Gaps (FVGs) that could act as strong areas of support and possible reversal zones. Price action is currently trending within a descending channel, with three possible bullish scenarios outlined:
1. A breakout from the upper boundary of the channel leading to an immediate bullish move.
2. A retracement into the first FVG zone, followed by a reversal upward.
3. A deeper retracement into the second FVG, aligned with the 0.618-0.65 Fibonacci retracement level, before a strong bullish rebound.
Keep an eye on these levels for high-probability trade setups. Patience is key!

EURUSD Will be in bearish directionHello Traders
In This Chart EURUSD HOURLY Forex Forecast By FOREX PLANET
today EURUSD analysis 👆
🟢This Chart includes_ (EURUSD market update)
🟢What is The Next Opportunity on EURUSD Market
🟢how to Enter to the Valid Entry With Assurance Profit
This CHART is For Trader's that Want to Improve Their Technical Analysis Skills and Their Trading By Understanding How To Analyze The Market Using Multiple Timeframes and Understanding The Bigger Picture on the Charts
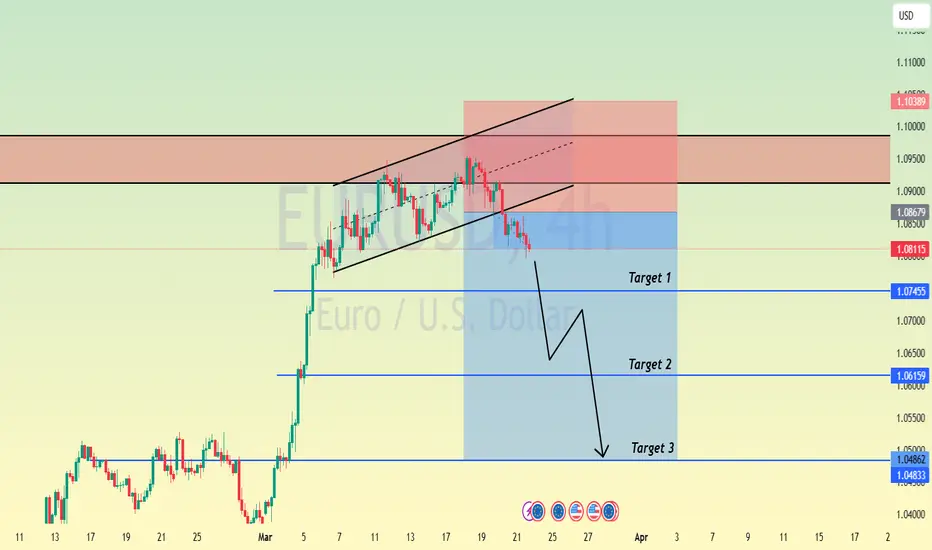
EURUSD:SELLHello friends
Given that the price is in this channel, we can now open a sell trade when the price has returned from the ceiling of the channel, of course with capital management...
The target is also specified.
*Trade safely with us*
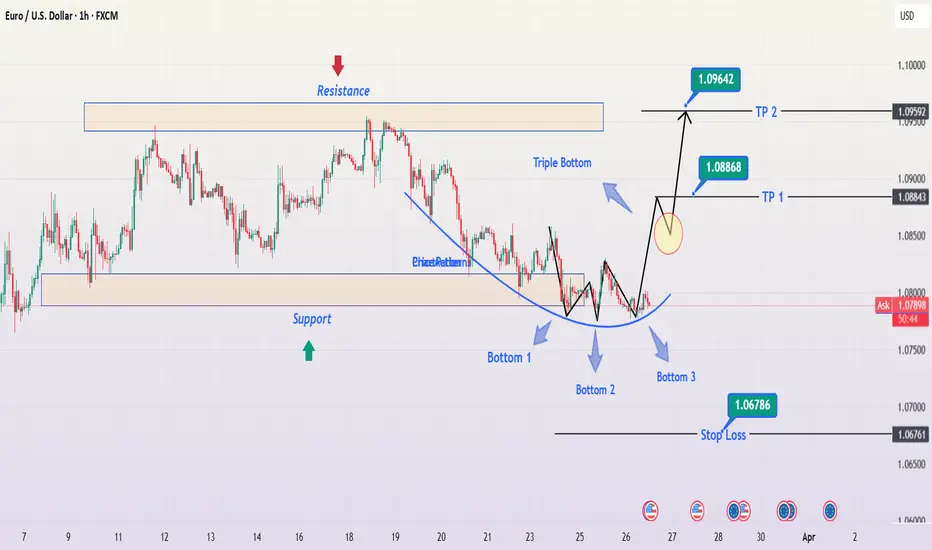
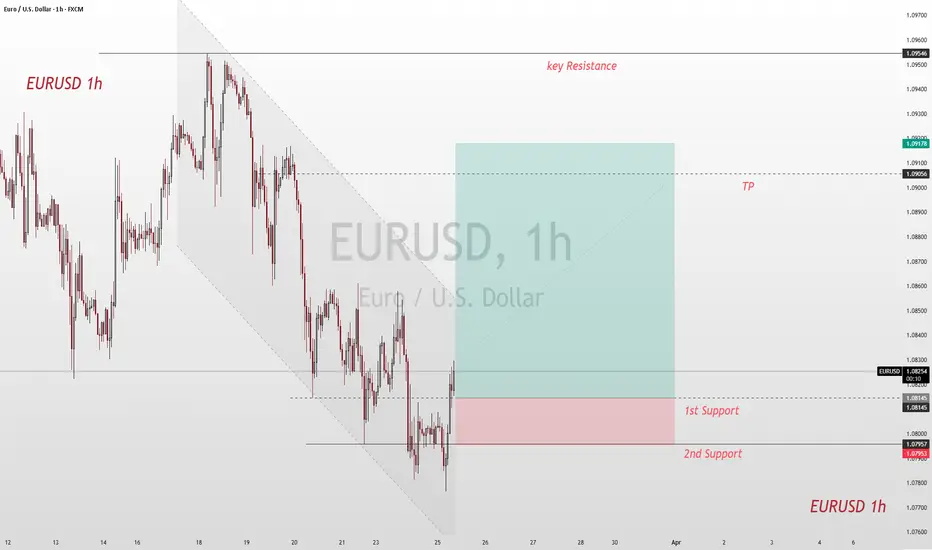
EUR/USD Triple Bottom Reversal | Bullish Breakout SetupChart Overview
This is a EUR/USD 1-hour chart showing a classic Triple Bottom Reversal Pattern, a strong bullish reversal signal. The price has tested a key support level multiple times, forming three distinct bottoms, indicating that sellers are losing momentum while buyers are stepping in.
This setup suggests an upcoming breakout, with well-defined entry, take profit, and stop-loss levels to capitalize on the potential upward move.
Technical Breakdown
1. Support & Resistance Zones
Support Zone (Highlighted in Beige)
The price has tested this zone multiple times without breaking below, confirming strong buying interest.
Each time the price touched this level, it rebounded, indicating accumulation by buyers.
Resistance Zone (Highlighted in Beige)
The price previously reversed from this level, making it a key area to watch for a breakout.
A confirmed breakout above this resistance could trigger strong upward momentum.
2. Triple Bottom Formation
A Triple Bottom is a strong bullish reversal pattern. It consists of:
Bottom 1: First rejection from support.
Bottom 2: A retest of support with buyers defending the level.
Bottom 3: The final touch before an upward move, confirming the pattern.
This pattern signals that selling pressure is diminishing and buyers are preparing for a strong breakout.
3. Bullish Reversal & Breakout Zone
A breakout above the neckline resistance (around 1.0843) will confirm the pattern.
Traders should wait for a confirmed candle close above the resistance before entering a long position.
A retest of the breakout zone can provide an additional entry opportunity.
Trade Setup & Key Levels
🔹 Entry Strategy
Aggressive Entry: Enter at the breakout level (above 1.0843) with volume confirmation.
Conservative Entry: Wait for a breakout retest before entering long.
🎯 Take Profit Targets
TP1: 1.08868 (First resistance zone)
TP2: 1.09642 (Major resistance zone, strong price reaction expected)
❌ Stop Loss Placement
Stop Loss: Below 1.06786, under the support zone.
This ensures that if the price breaks below the key level, the trade is invalidated.
Market Sentiment & Expected Move
If the price breaks the resistance → Expect a strong bullish move toward TP1 and TP2.
If the price fails to break out → It may consolidate further or retest support.
Watch for increased volume on the breakout to confirm strength.
📌 Final Thoughts
This is a high-probability bullish setup based on a well-formed Triple Bottom Reversal pattern. Traders should monitor price action near the breakout zone and manage risk effectively with proper stop-loss placement.
Attention! Key Signals in the EUR/USD Exchange Rate TrendThe EUR/USD pair has traded with a soft tone for five consecutive trading days, and the decline has expanded to 1.0776, the lowest level since March 6. However, the broad weakness of the US dollar in the middle of the European session pushed the currency pair to turn upward.
In the short term, according to the 4-hour chart, although the possibility of further upward movement is low, the downside potential also seems limited. The EUR/USD found buying support around the bullish 100-day moving average but failed to break through the bearish 20-day moving average. Finally, although technical indicators show an upward trend, they remain in negative territory.
EURUSD Trading Strategy:
buy@1.08200-1.08500
tp:1.08900-1.09300
I will share trading signals every day. All the signals have been accurate for a whole month in a row. If you also need them, please click on the link below the article to obtain them.
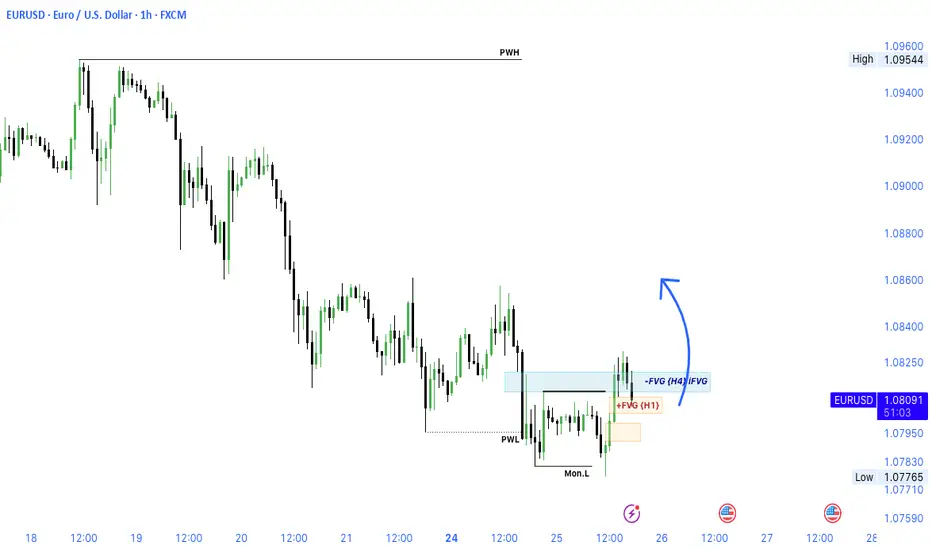
EUR/USD Buy BiasTrade Idea (EURUSD - Buy Bias)
Price has reclaimed the Monday Low (Mon.L) and mitigated the H1 FVG. It's now trading within a higher timeframe FVG (H4/D1) zone, showing bullish intent.
Targeting a move toward the previous weekly high (PWH).
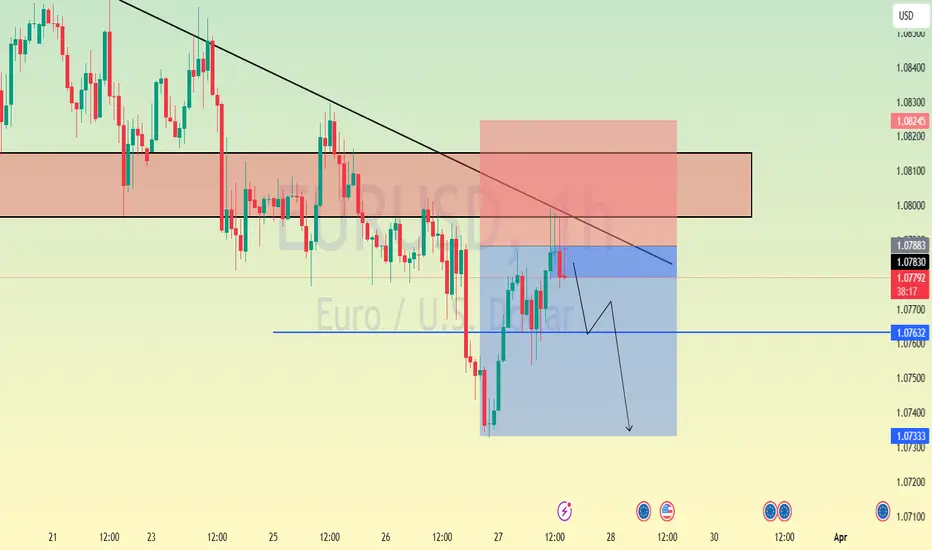
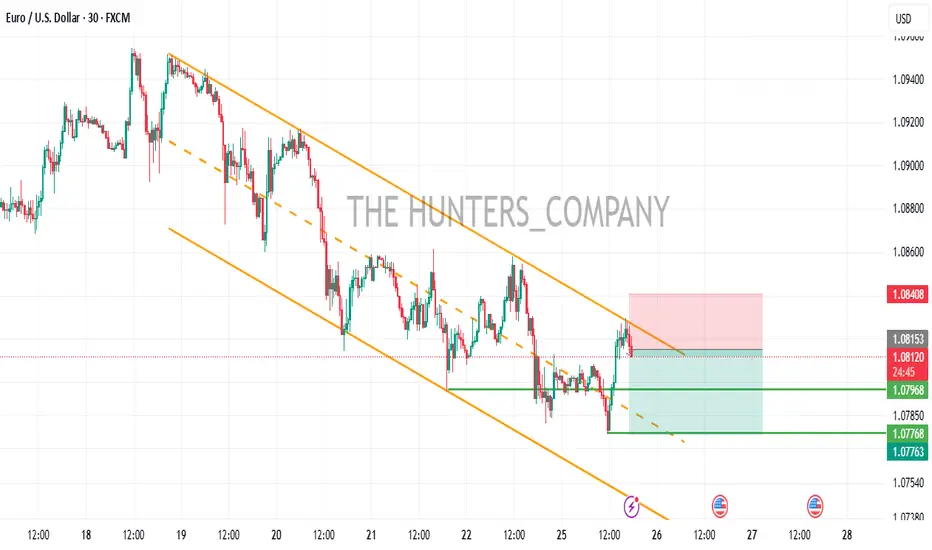
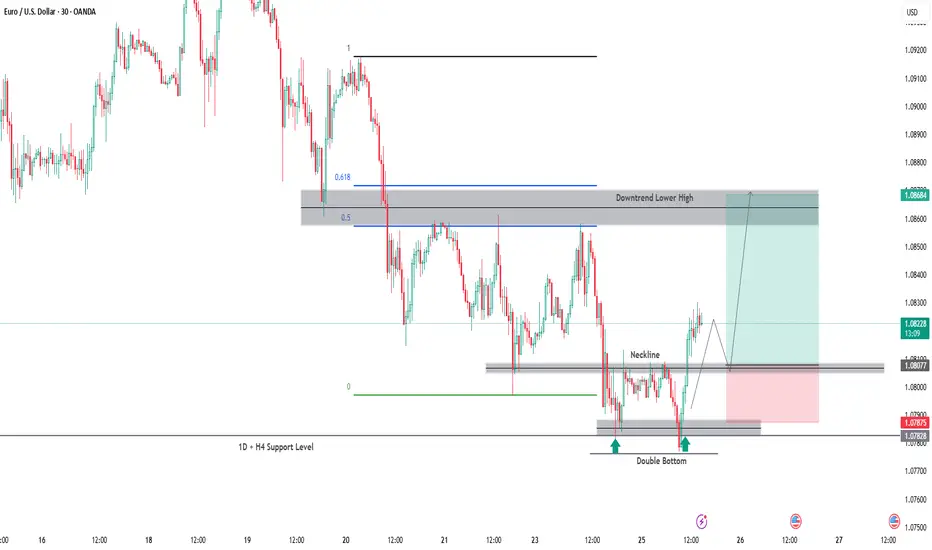
EUR USD Entry Setup 30M Timeframe🔹 Pattern: Double Bottom
🔹 Entry Condition: Wait for a clean break and retest of the neckline before entering.
No confirmation = No trade.
🔹 Higher Timeframe Context: Overall trend is bearish: this is just a pullback to the Lower High before a potential continuation of the downtrend.
⚠️ Patience is key let’s see how it plays out!
EUR/USD 1H Chart Analysis – Falling Wedge Breakout StrategyOverview of the Chart
The EUR/USD 1-hour chart is forming a falling wedge pattern, which is a bullish reversal setup. This indicates that although the price has been trending downward, the selling pressure is weakening, and a breakout to the upside is becoming more likely.
Currently, the price has broken above the wedge, signaling potential trend reversal. However, traders should watch for a retest of the breakout level to confirm whether the price holds above the resistance-turned-support area before further upward movement.
Key Components of the Chart
1️⃣ Falling Wedge Pattern (Bullish Reversal Signal)
A falling wedge consists of two downward-sloping trendlines that converge, showing a narrowing price range. This pattern is formed when:
The price makes lower highs and lower lows, indicating a downtrend.
The slope of the lower trendline is less steep than the upper one, meaning sellers are losing momentum.
Eventually, the price breaks out above the upper trendline, confirming a bullish reversal.
2️⃣ Support & Resistance Levels
✅ Support Zone (Key Demand Area)
The price recently tested a strong support level (highlighted in beige), where buyers aggressively entered the market.
This level has held multiple times, indicating that buyers are stepping in whenever the price reaches this zone.
The green upward arrow suggests that this is a key accumulation area, where demand is stronger than supply.
🚫 Resistance Zone (Profit Target)
The resistance zone near 1.09450 is the first major target for bulls.
Historically, price action has struggled to break through this level, making it a logical place to take profits.
3️⃣ Breakout Confirmation & Retest
The price has successfully broken out above the falling wedge, which is a strong buy signal.
However, a retest of the breakout level (marked by the yellow circle) might occur before further bullish continuation.
If the price retests and holds above the previous resistance (now support), this will confirm the breakout and provide an additional buying opportunity.
Trade Execution Strategy
📌 Entry Point:
Enter a long trade after the breakout confirmation.
For conservative traders, waiting for a successful retest before entering can reduce risk.
📌 Stop-Loss Placement:
Place a stop loss just below the recent swing low at 1.07541 to limit downside risk.
This ensures that if the breakout fails, the trade is exited with minimal loss.
📌 Profit Target:
The first take-profit target is at 1.09450, the key resistance level.
If bullish momentum continues, traders can look for higher targets based on price action.
📌 Risk-to-Reward Ratio:
This setup provides a favorable risk-to-reward ratio, meaning that potential profits outweigh the risk taken on the trade.
Technical Indicators Supporting the Trade
📈 Trend Reversal Signals
The market has been in a downtrend, but the falling wedge signals a potential reversal.
A higher low after the breakout would further confirm the uptrend.
📊 Volume Confirmation
Ideally, a breakout should be accompanied by increased volume, showing strong buying pressure.
If volume is low, a false breakout could occur, requiring careful trade management.
🔍 Retest & Price Action
A retest of the breakout level should hold above the wedge to confirm bullish momentum.
If the price fails to hold and falls back below, the breakout may have been a fakeout, meaning traders should exit or wait for re-entry.
Risk Management & Trade Considerations
Always use a stop-loss to manage risk.
If the price fails to stay above the breakout level, consider exiting early.
Watch for external market factors such as news events or economic data releases, which can impact EUR/USD volatility.
Conclusion: Bullish Momentum is Building 🚀
This falling wedge breakout on the EUR/USD chart provides a high-probability long trade setup. As long as price holds above the breakout level, bullish continuation toward 1.09450 is expected. Traders should monitor price action carefully and adjust their positions accordingly to maximize gains while managing risks.

EURUSD Trading: Unveiling the Precise Strategy GuideAfter last week's decline, the euro against the US dollar started to recover at the beginning of this week and is currently trading within the positive range around 1.0850.
According to the Wall Street Journal, the White House is adjusting its tariff policy set to take effect on April 2nd. It may cancel a series of tariffs targeting specific industries and instead impose reciprocal tariffs on countries with significant trade relations with the US. Affected by this news, during the European morning session, US stock index futures rose by 0.8% to 1.0%.
On the 4 - hour chart in the European morning session on Monday, the Relative Strength Index (RSI) indicator climbed to 50, indicating that the recent bearish momentum has dissipated to some extent.
In terms of the upward direction, the 50 - period Simple Moving Average (SMA) forms an interim resistance level at 1.0880, followed by 1.0900. If the euro - US dollar pair can firmly stand above this level, the next resistance level may be at 1.0950.
EURUSD Trading Strategy:
buy@1.08200-1.08500
tp:1.08900-1.09300
I will share trading signals every day. All the signals have been accurate for a whole month in a row. If you also need them, please click on the link below the article to obtain them.
EURUSD and GBPUSD Analysis todayHello traders, this is a complete multiple timeframe analysis of this pair. We see could find significant trading opportunities as per analysis upon price action confirmation we may take this trade. Smash the like button if you find value in this analysis and drop a comment if you have any questions or let me know which pair to cover in my next analysis.

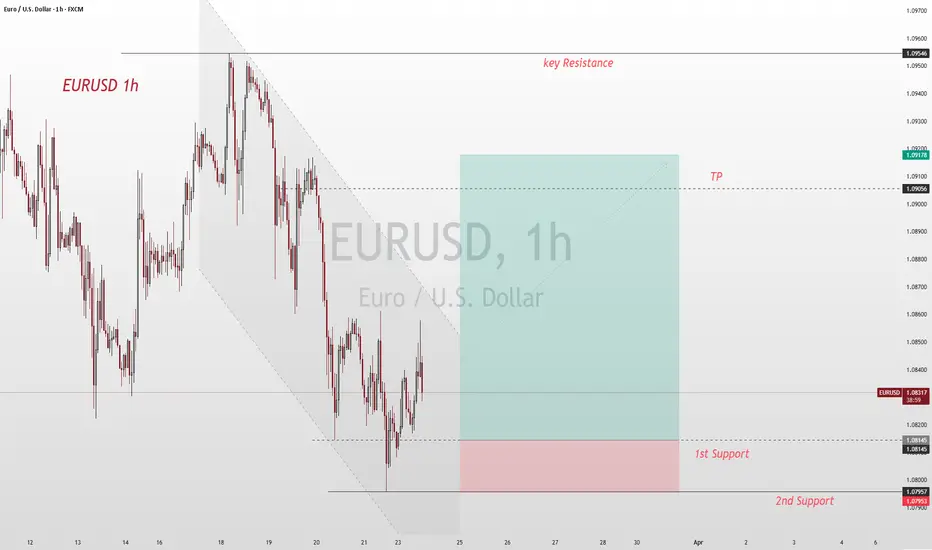
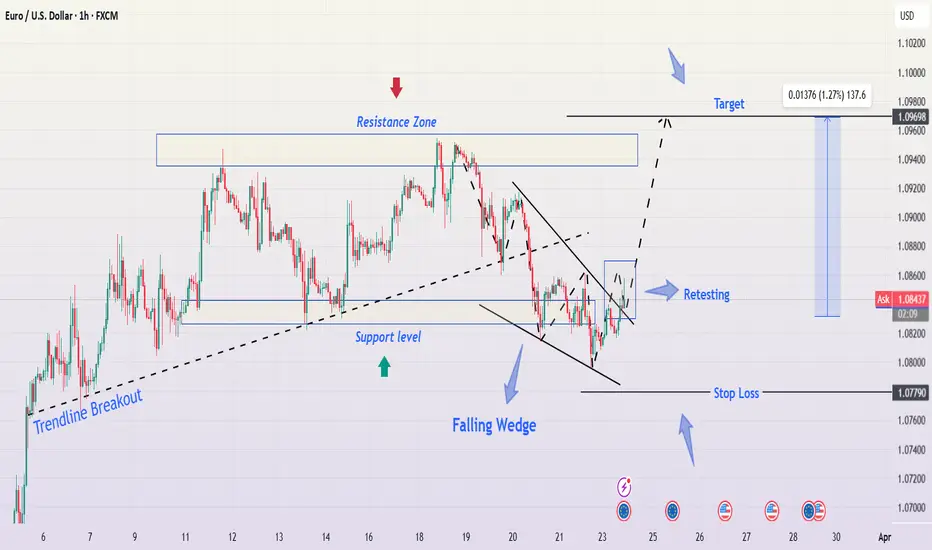
EUR/USD Falling Wedge Breakout – Professional Chart AnalysisOverview of the Chart
The EUR/USD 1-hour chart presents a bullish trading setup, featuring a well-defined falling wedge pattern, a trendline breakout, and a retest phase, signaling a potential upward move. The chart is marked with key technical elements such as support and resistance zones, breakout confirmation, and risk management parameters.
This analysis will break down each component of the chart, explaining the logic behind the setup and how traders can approach this opportunity.
1. Identified Chart Patterns
Falling Wedge Formation (Bullish Reversal Signal)
The price action formed a falling wedge, characterized by lower highs and lower lows, creating a narrowing price channel.
This pattern is typically a bullish reversal structure, as it indicates weakening selling pressure before an expected breakout.
The wedge’s downward movement ended with a strong breakout to the upside, signaling buyers regaining control.
2. Key Technical Levels
Support & Resistance Zones
Support Level (Buyers’ Stronghold)
The horizontal support level is a price area where buyers have previously stepped in, preventing further declines.
This level has been tested multiple times, reinforcing its strength as a key demand zone.
Resistance Zone (Profit Target Area)
The highlighted resistance zone represents a supply area where the price has struggled to move past in previous sessions.
The target price level aligns with this resistance, making it a realistic profit target for the long position.
3. Trendline Breakout Confirmation
Before forming the wedge, the chart shows an uptrend with a breakout above a trendline.
This trendline breakout was an early signal of bullish strength, aligning with the later wedge breakout.
After the breakout, the price came back for a retest, which is a key confirmation before further upward movement.
4. Retesting Phase Before the Upward Move
After breaking out of the wedge, the price returned to the breakout level to confirm support.
Retesting is a crucial validation step—if the price holds above this level, it increases the probability of a continued bullish move.
This retesting action provides a potential entry point for traders looking to go long.
5. Trade Setup & Risk Management Strategy
Trade Entry:
A buy entry is considered after the retest is confirmed (price holding above the breakout level).
Stop Loss Placement (Risk Control):
The stop loss is placed below the previous low at 1.07790, ensuring protection against fake breakouts or unexpected reversals.
Take Profit Target (Projected Price Move):
The target price is set at 1.09698, which aligns with previous resistance levels and the measured move from the wedge breakout.
This provides a strong risk-to-reward ratio, making the setup favorable for bullish traders.
6. Risk-Reward Ratio & Trade Viability
Risk: The distance between the entry point and the stop loss is relatively small, making it a low-risk trade.
Reward: The potential upside move is significantly higher than the risk, creating a high reward-to-risk ratio trade.
This type of technical confluence increases the probability of a successful trade, making it an attractive opportunity.
7. Conclusion & Trading Strategy
📌 Key Takeaways:
✅ The falling wedge breakout signals a bullish reversal.
✅ The trendline breakout and retest add further confirmation to the trade setup.
✅ The support and resistance zones provide a clear risk management strategy.
✅ The risk-reward ratio makes this an attractive long trade setup.
💡 Trading Plan:
🔹 Enter Long after retest confirmation above the breakout level.
🔹 Stop Loss: 1.07790 (below previous low).
🔹 Take Profit: 1.09698 (previous resistance zone).
Final Thoughts
This EUR/USD setup is a textbook example of a bullish reversal following a falling wedge breakout. Traders who patiently wait for a confirmed retest can capitalize on this high-probability trade setup, aiming for a strong bullish continuation.
🔹 Tags: #EURUSD #ForexTrading #TechnicalAnalysis #Breakout #PriceAction #TradingSetup #SupportResistance
EURUSDMy Trade Idea
My trade idea was simple:
If EUR/USD breaks above a key level, I will look for a retest and enter a long position after confirming the entry with candlestick confirmation.
If it breaks below, I will wait for a retest, confirm with a candlestick pattern, and enter a short position.
This is a very short-term trade, so I’ll skip if the setup doesn’t align. Follow for faster updates! 🚀
EURUSD(20250324) Today's AnalysisToday's buying and selling boundaries:
1.0824
Support and resistance levels:
1.0887
1.0863
1.0848
1.0799
1.0784
1.0760
Trading strategy:
If the price breaks through 1.0824, consider buying, the first target price is 1.0848
If the price breaks through 1.0799, consider selling, the first target price is 1.0784
EURUSD Will be in bearish directionHello Traders
In This Chart EURUSD HOURLY Forex Forecast By FOREX PLANET
today EURUSD analysis 👆
🟢This Chart includes_ (EURUSD market update)
🟢What is The Next Opportunity on EURUSD Market
🟢how to Enter to the Valid Entry With Assurance Profit
This CHART is For Trader's that Want to Improve Their Technical Analysis Skills and Their Trading By Understanding How To Analyze The Market Using Multiple Timeframes and Understanding The Bigger Picture on the Charts
EURUSD Analysis todayHello traders, this is a complete multiple timeframe analysis of this pair. We see could find significant trading opportunities as per analysis upon price action confirmation we may take this trade. Smash the like button if you find value in this analysis and drop a comment if you have any questions or let me know which pair to cover in my next analysis.
